Short
Short
S&P & Dow Sit in 'Neutral' Temp, Nasdaq Drift Toward 'Defensive'Sahm Research applies its proprietary DPWD market-temperature model — a breadth/trend/momentum composite calculated on the close — across the S&P 500, Nasdaq 100 and Dow as we start September.
The picture is interesting: the broad market is not hot, but it is also not breaking down. It is cooling from "active" toward "neutral," and the Nasdaq is the index quietly losing altitude.
Here is the latest read (data as of the 2026-09-02 close, ~2y of daily bars):
- SEED_ALEXDRAYM_SHORTINTEREST2:SP (US500): close 7,666.60 · TEMP10 82.1 → MODERATE (neutral). TEMP10 has slid from ~88 to ~82 over the last 10 sessions — still constructive, just less urgent.
- TVC:DJI (US30): close 53,061.95 · TEMP10 82.4 → MODERATE (neutral). Basically tracking the S&P; the old-economy index is holding the temperature up.
- NASDAQ:NDX (NAS100): close 26,217.83 · TEMP10 71.0 → CONSERVATIVE (defensive). This is the weak link — it is the only one sitting in the defensive band, and its TEMP10 has been grinding lower (73.5 → 71.0).
What that tells us: the "risk-on" thrust that powered the summer is fading at the index level, but the S&P and Dow are still above their temperature "cooling line." The divergence is the story — the megacap/tech complex (Nasdaq) is cooling faster than the broad market. That usually means leadership is narrowing.
On the technical side nothing has broken yet. The S&P and Dow are holding above the 20-day and 50-day; momentum (MACD score) is flat-to-neutral, not rolling over, and RSI(6) is mid-range (42–47) — no exhaustion, no blow-off. So this reads like a pause/consolidation inside an uptrend, not a reversal. The line we would watch: if the Nasdaq's temperature keeps slipping under 65 while the S&P holds, that is leadership confirming the narrowing; if the S&P's TEMP10 drops back under 75, the whole tape is telling you the August thrust is done.
On the institutional side, a few desks put out notes in the last few days that line up with the temperature read:
- NYSE:BAC BofA's "The Flow Show" (Aug 28) keeps flagging that the bull market is "rule of law, rule of the Fed, rule of the AI story" — i.e. the move is still liquidity + AI narrative driven, not broad fundamentals. That fits a market that is cooling at the index level but not collapsing.
- NYSE:MS Morgan Stanley's closed-door macro strategy talk (Aug 31) framed it as "macro vs tech" — the tug-of-war between a still-cautious-rate backdrop and the AI mega-cap bid. That is exactly the S&P-neutral / Nasdaq-defensive split our model is showing.
- NYSE:GS Goldman's Americas Tech & Internet Q2'26 earnings review (Sep 1) leans constructive on the AI/cloud complex into the Communacopia+Tech conference, but notes the bar is high after the run — which argues for consolidation, not acceleration, near term.
- NYSE:JPM J.P. Morgan and Goldman both revised Nvidia's CY27 outlook higher (late Aug–Sep 1). Since NASDAQ:NVDA is the single biggest weight in the Nasdaq and a top weight in the S&P, that is a floor under the indices — but it also means a lot of the index's support is concentrated in one name's earnings, which is why breadth (our temperature model) is cooling even as the headline holds.
Our view: this is a "grind, don't chase" tape. The S&P and Dow are fine while TEMP10 stays above ~75; the Nasdaq is the canary — watch 71 → 65. We are not calling a top, but we are also not adding risk up here when the temperature is this close to rolling over and leadership is this narrow. We would prefer to wait for either a reset in temperature (a dip that cools it toward the defensive band and snaps back) or a reclaim back above the recent TEMP10 highs (~88 on the S&P) to get more aggressive.
What would change our view: a clean push of S&P TEMP10 back above 88 = thrust resuming; Nasdaq TEMP10 losing 65 while S&P holds = leadership breakdown, trim beta. We also flag the macro wildcard — rate-path repricing and geopolitical uncertainty can flip sentiment fast, which is why we rely on the temperature model rather than a single narrative.
This is Sahm Research's analytical view and is not financial advice. Readers should conduct their own due diligence.  Short
Short
JPN225:Descending triangle developing here is the tradeThe Jappan 225 lost 2.85%, closing at 64,325 on Wednesday, to reach its lowest level in four weeks due to changes in the macroeconomic environment. The yield on Japan’s 10-year government bonds touched above 3% for the first time since 1996 due to increasing oil prices and expectations of additional tight monetary policy moves from the Bank of Japan. Stronger Japanese yen has put pressure on Japanese companies like Toyota, Sony, and Softbank. The index is still 53.76% higher year-to-date.
The daily chart depicts a broken trend structure. In the current case, TEMA 9 (64,618) serves as resistance, and the 50 EMA (66,718) and 200 EMA (58,910) form a wide and indecisive channel. The formation of a descending triangle since the high at about 69,000 in August reveals declining highs against a flat support at 63,500. The RSI (40.92) lags behind its signal (48.91), suggesting weak momentum. On the other hand, the MACD (−208.47 against −288.79 signal) shows a narrowing negative histogram (−80.32). This could point to the possible
Trade recommendation
Direction : Long
Entry horizon : 63,000 – 64,274
Primary target : 66,718
Secondary target : 68,000
Stop loss : Daily close below 62,000
Technical scenarios
BOJ hiatus and oil retreat, descending triangle breaches higher : Trump's comment that the US strikes in Iran would be short-lived temporarily reduced oil prices and JGB yields. Should de-escalation continue, the BOJ halts tightening, leading to a weak yen of around 150 and positive export performance. The MACD narrows, RSI returns above 50, and the descending triangle breaches higher towards 66,718 (50 EMA).
Sideways Compression, The BOJ Waiting Game: The Descending Triangle squeezes between support at 63,500 and lower peaks as the Bank of Japan’s meeting approaches in October. The market struggles sideways in indecision with an RSI ranging from 38 to 48 and MACD close to zero.
Triangle breakdown ,3% yield shock accelerates : Japan's 10-year yield exceeds 3.2% as oil stays above $95, forcing BOJ rate hike signals. The 63,500 support breaks, RSI drops below 35, and MACD widens negatively, targeting the 200 EMA at 58,910.
 Long
Long
 Long
Long
 Short
Short
 Short
Short
Short 
Long 
Japanese Stocks Under Pressure from Yen StrengtheningNikkei Update: Japanese Stocks Under Pressure from Yen Strengthening IG:NIKKEI
The benchmark Nikkei 225 index edged down 0.2% to hover around the 64,200 level, while the broader Topix index surged 0.7% to land at 4,110, reflecting a massive equity rotation amidst currency intervention dynamics and geopolitical factors.
------------------------------------------------------------------------------------------------------------
✅ Speculation of BOJ Currency Rate Check Drives Sharp Yen Appreciation
The primary catalyst weighing on exporters stems from Tokyo's monetary policy landscape:
- Signals of Direct FX Intervention: Rumors of a "rate check" by Japanese monetary authorities—aimed at stemming the Yen's slide—mechanically triggered massive Yen short-covering.
- Margin Pressure on Exporters: The sudden strengthening of the Yen eroded projected foreign-currency-derived profits (repatriated earnings) for major exporters, prompting daily de-risking in the Nikkei 225 index.
------------------------------------------------------------------------------------------------------------
✅ Price Action Analysis (H4 Timeframe)
⚡Market Structure & Break of Structure (BOS):
On the H4 macro timeframe, the market structure remains in a Bearish Trend phase. A prior sharp decline broke the upper consolidation range and executed a Break of Structure (BOS) below the green line at 64,925.9.
⚡Current Price Action:
At the 64,562.4 level, the price accelerated downward, piercing the consolidation floor and touching a local low of 63,705.0. However, the most recent H4 candle immediately responded to this breach by forming a long lower wick (indicating bullish rejection). The price is currently attempting to creep back up to test the Support-Turned-Resistance (SBR) area at the green line of 64,925.9.
------------------------------------------------------------------------------------------------------------
✅ Key Zones:
- ⚡Resistance / Supply Zone (SBR): The 64,925.9 green line range (nearest key Support-Turned-Resistance/SBR area) and the 66,852.1 green line range (upper gray box / Major Supply Zone).
- ⚡Support / Demand Zone: The 63,705.0 – 64,000.0 range (middle gray box where a liquidity sweep occurred) and the 62,054.8 green line range (lowest Major Demand floor).
------------------------------------------------------------------------------------------------------------
✅ Elliott Wave Analysis
Mapping wave cycle movements on the H4 timeframe:
⚡Wave Structure:
The impulsive decline from the ~69,600 peak toward the consolidation floor is counted as Wave 1 (or Wave A). The sideways consolidation that recently concluded is identified as Wave 2 (or Wave B).
⚡Projection:
Price action is projected to complete this micro-corrective rebound toward the 64,925.9 SBR range before reversing downward to resume the major Wave 3 expansion, targeting the 62,054.8 Major Demand green line. Short 
Short 
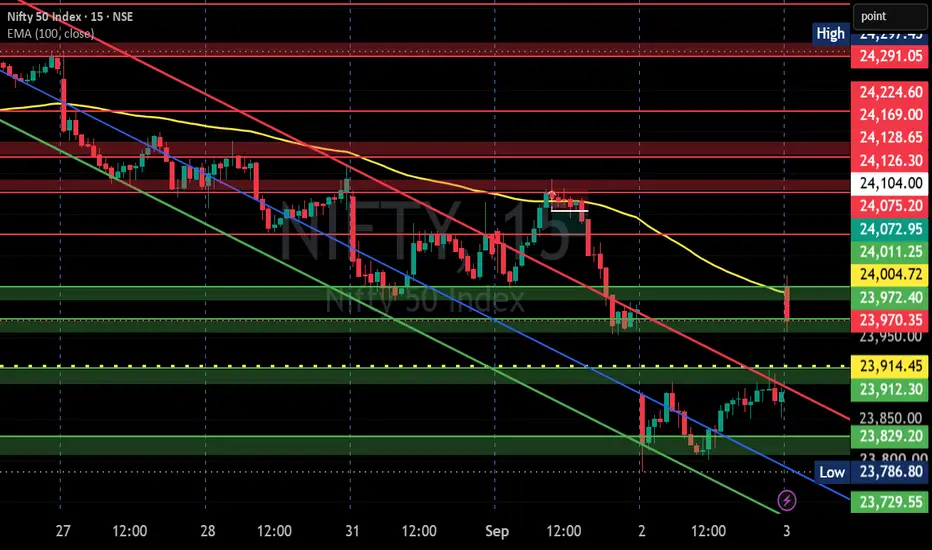
NIFTY S/R
Support and Resistance Levels:
Support Levels: These are price points (green line/shade) where a downward trend may be halted due to a concentration of buying interest. Imagine them as a safety net where buyers step in, preventing further decline.
Resistance Levels: Conversely, resistance levels (red line/shade) are where upward trends might stall due to increased selling interest. They act like a ceiling where sellers come in to push prices down.
Breakouts:
Bullish Breakout: When the price moves above resistance, it often indicates strong buying interest and the potential for a continued uptrend. Traders may view this as a signal to buy or hold.
Bearish Breakout: When the price falls below support, it can signal strong selling interest and the potential for a continued downtrend. Traders might see this as a cue to sell or avoid buying.
MA Ribbon (EMA 20, EMA 50, EMA 100, EMA 200) :
Above EMA: If the stock price is above the EMA, it suggests a potential uptrend or bullish momentum.
Below EMA: If the stock price is below the EMA, it indicates a potential downtrend or bearish momentum.
Trendline: A trendline is a straight line drawn on a chart to represent the general direction of a data point set.
Uptrend Line: Drawn by connecting the lows in an upward trend. Indicates that the price is moving higher over time. Acts as a support level, where prices tend to bounce upward.
Downtrend Line: Drawn by connecting the highs in a downward trend. Indicates that the price is moving lower over time. It acts as a resistance level, where prices tend to drop.
Disclaimer:
I am not SEBI registered. The information provided here is for learning purposes only and should not be interpreted as financial advice. Consider the broader market context and consult with a qualified financial advisor before making investment decisions. NIFTY SENTIMENT ANALYSIS 03/09/2026**NIFTY 50 — MILD BEARISH BIAS | SEPTEMBER 3, 2026**
**Market View:** 🔴 Mild Bearish
**Behaviour:** ⚡ Volatile
**Structure:** 🪤 Trap / Conflict
**Positioning:** PE Dominant
### Key Levels
🔴 **24,066 — Major Resistance**
🔴 **24,010.50 — Resistance**
⚠️ **23,954 — Immediate Level**
🎯 **23,898 — Key Pivot**
🟢 **23,842 — Critical Support**
**Current Price:** 23,986
### Time Factor
⏰ **Anchor Time: 12:45 PM**
### Sector Strength
🥇 **FMCG — 8**
🥈 **Banking — 2**
### Scenario
**Below 23,898 →** bearish pressure can strengthen toward **23,842**.
**Break & sustain below 23,842 →** further downside becomes probable.
**Hold + reclaim 23,898 →** bearish setup weakens and **bear-trap risk** increases.
The key today is not predicting every candle.
It is watching **how price reacts at the predefined levels.**
**Price gives the level.
Time gives the trigger.
Reaction gives the truth.**
🔴 **VERDICT: MILD BEARISH**
#NIFTY #NIFTY50 #TradingView #IndianStockMarket #Trading #OptionsTrading
Russell: Volume, Sellers, and the Area of Interest.Hello everyone :)
Something on the Russell chart caught my attention.
Whenever I get that feeling—that little spark in my eye—I feel like I have to understand what exactly caught my attention. It doesn't happen often, but when it does, I believe there's usually a reason for it.
I can see that buyers did react yesterday from the 2,915 area. This is a demand zone and potentially the last line of defense before a possible trend change on the daily timeframe.
However, there was one thing missing: volume.
The trading volume around that area was relatively average and not significant enough to aggressively push the price higher against all the momentum that has developed over the past several days.
The price is now approaching last week's trading range, and I'm very interested to see whether sellers will appear in that area.
More accurately, I wouldn't be surprised to see sellers showing up there.
If selling pressure develops, I will then be watching for another potential accumulation of energy around the 2,915 area.
There is no 100% certainty, and there is no perfection.
Just because a trade doesn't work doesn't mean I was wrong. Just because my stop loss gets hit doesn't mean I'm a bad trader.
It simply means that conditions changed compared to what I saw and interpreted at that specific moment when analyzing the chart.
No emotional attachment to profits, and no emotional attachment to losses.
 Short
Short
DXY: 99.95 Supply Wall vs. the 98.55 BounceDXY TVC:DXY Bounces From 98.55 — But Can the Rebound Survive the 99.95 Supply Wall?
The dollar just had its best bounce in weeks. Oil spiked above $91, 10-year yields hit their highest since January 2025, and Fed hike odds for September jumped to 66%. But here's the catch — DXY is running straight into a supply wall.
📊 Context: Why This Matters Now
DXY crashed to a three-month low of 98.80 on August 21 before rebounding above 99.50. The rally was fueled by surging oil prices above $91/barrel on renewed Middle East tensions, which pushed the 10-year Treasury yield to its highest level since January 2025. Markets now price a 66% probability of a September Fed hike — up from just 40% a week ago.
But the ADP report told a different story: only 44K private jobs added in July, the weakest in six months and well below the 70K forecast. With August ADP expected at 47K and NFP due Friday, the dollar sits at a crossroads — inflationary pressures pushing yields up, but a softening labor market capping the dollar's upside.
📉 Technical Structure: Rebound or Dead Cat?
The daily chart tells a clear story: medium and long-term moving averages are still sloping downward. Price sits below all major MAs. My read is this bounce is a correction within a downtrend — not a reversal.
🔴 Resistance Above:
99.73–99.95: Primary supply zone and the short-term bull/bear pivot. This is where trapped buyers from the prior breakdown sit.
100.07–100.27: 4H structural resistance + mid-term MA cluster.
101.60–101.80: Daily supply zone — the larger rebound target if 99.95 breaks.
🟢 Support Below:
99.44–99.35: First short-term support. Lose this and the bounce loses momentum.
98.55–98.80: The 4H/daily demand zone that launched this rebound. The line in the sand.
97.62: Next daily support if 98.55 fails.
🎯 Three Scenarios
Scenario 1 — Pullback then bounce: If DXY can't clear 99.73–99.95, expect a pullback to 99.35–99.28, possibly testing 98.80–98.55. If support holds with a bullish rejection candle and price reclaims 99.44, watch for another attempt at the supply zone.
Scenario 2 — Supply break: A 4H or daily close above 99.95 that flips to support would weaken the bearish structure, opening 100.07–100.27 and potentially 100.60+.
Scenario 3 — Support fails: A close below 98.55 means the bounce is dead. Price returns to the daily downtrend, with 97.62 as the next target.
⚠️ Risk View
The bearish thesis breaks if DXY closes above 99.95 on a daily basis and holds — that would signal the supply zone has been absorbed. Conversely, if NFP surprises strong, yields could surge further and push DXY through resistance. A weak NFP would likely send the dollar back to test 98.55. The Middle East situation remains fluid — any escalation in oil could extend the yield-driven dollar bid.
-
DXY is sitting between a short-term bounce and medium-term bearish pressure. Don't chase in the middle of the range. Wait for price to react at 99.73–99.95 resistance or 99.35 / 98.55 support before committing.
Trade plan: Hold 98.55 to stay bullish on the bounce. Below 99.95, manage risk as a rally into supply.
This analysis is for market observation and technical research only, not investment advice. Short 
Nikkei 225 LONG — 12H ALMA Setup (WR 86% · avg RR 1.5)SPREADEX:NIKKEI · 12H · long only.
(Context: Nikkei 225 — Japan equity beta via yen, BOJ path, and Asia risk appetite — not a discretionary “buy Japan” call.)
═
█ RESEARCH HUB
Category: Indices sentiment 32.4 (Fear) — built from 74 locked notes (11 constructive / 48 risk-off / 15 mixed); ticker verdicts +28 / −27. Category fear is broad (USD / mega-cap stress); Nikkei’s own verdict window stays constructive inside that gauge.
Sector: same bucket as category (indices) — no separate GICS sleeve.
Asset: positive. Living thesis: Japan holds ~$7T abroad and faces repatriation pressure so aging ALM can match liabilities at home — yen/Nikkei two-way, not a one-way equity bid.
Tape:
- 2026-08-20 · positive · Japan exports +23% on China shipments / AI demand — supports Japan equity beta and Asia supply-chain demand.
- Recent · mixed · Japan CPI beat hardens mid-Sep BOJ hike odds — yen/JP equities two-way into the meeting window.
- Recent · negative · Japan spent ~$96.5B defending the yen; USDJPY back toward 160 after a brief dip — intervention failed to stick; watch Nikkei into BOJ.
- 2026-07-29 · negative / mixed · ~$7T abroad + repatriation / ALM framing — yen weakness as ALM repatriation, not only carry unwind; Nikkei gains can look hollow vs gold.
- 2026-07-29 · negative · China Q2 4.3% GDP miss / domestic deflation — Asia demand headwind for Japan exporters.
Calendar:
- 2026-09-17 · BOJ September meeting / hike decision window · direct · cb
- 2026-09-02 · ADP Nonfarm + Fed Beige Book · indirect (global risk) · macro / cb
- 2026-09-04 · US August jobs / NFP · indirect · macro
- 2026-09-16 · FOMC · indirect (USD/JPY cross-beta) · cb
Hub verdict: Indices fear vs a positive Nikkei window with BOJ 17 Sep as the hard date — Hub is two-way : export/AI support vs yen intervention + hike odds. Averaging fades the 12H wash; it does not forecast the BOJ print.
═
█ MARKET EDGE
Long Edge 41.3 · Short Edge −31.3 ( 02 Sep ~ 64112 ).
Built from: TOTAL_BEAR phase · ALMA overheat below · deviation · price action — discount board into the arm.
Positive factors
- ALMA — 4H SHORT OVERHEAT-S · S:7 vs SAvg:3.3 — validation clock stretched below the band
- ALMA — 1D SHORT OVERHEAT-S · S:4 vs SAvg:2.9 — daily band stretched below
- ALMA — 3D SHORT OVERHEAT-S · S:5 vs SAvg:3.0 — slow clock stretched below
- SMC — 4H FVG Enter Bull ~ 64438 ( 02 Sep ) · bounce up B 53.0% · break down Br47.0% (n=762) — mild demand near the latest add
- SMC — 1D FVG Enter Bull ~ 64836 ( 31 Aug ) · bounce up B 58.1% · break down Br41.9% (n=248) — daily demand under the wash
- SMC — 1W FVG Enter Bull ~ 65796 ( 23 Aug ) · bounce up B 73.1% · break down Br26.9% (n=26) — weekly hold skew above the pocket
- PA — Fractal Low Formed / Broken — local low housekeeping into the arm
- Score skew long ~41.3 vs short ~−31.3 — board tilts repair
Negative factors
- EMA — 1W Above · Cur L:67 · Dev −10.2% — weekly still deeply stretched above; slow giveback risk if USDJPY / BOJ bites
- ALMA — 1W SHORT · S:2 vs SAvg:3.0 — weekly below-band not fully stretched
- TL — Head & Shoulders (Classic) ( 31 Aug ) · bounce B 60% · break Br40% (n=15) — thin-sample pattern ceiling into the mid-65ks
- SMC — 1D FVG Raid Bear ~ 66116 ( 26 Aug ) · reject down B46.2% · break up Br53.8% (n=208) — prior daily supply still overhead
- Pyramid already 3 of 4 — limited add room; thin cushion if BOJ week gaps before lot 4 / exit
- Yen intervention failure + hike odds can reprice Nikkei faster than the ~93-bar sample hold
═
█ DESK
Hub is two-way (positive Nikkei thesis · Indices fear · BOJ 17 Sep direct). Edge is a discount long (Long 41.3 vs Short −31.3) from 4H–3D ALMA OVERHEAT-S. Alignment: fade the 12H wash on Averaging into the BOJ window — not a hike forecast. Twin 12H template stays desk-only.
Three 12H lots from 01–02 Sep (~64970 / 64820 / 63882) into the mid-64ks after the late-Aug slide from the mid-65ks.
Takeaway: the 12H ALMA strategy and 86% WR / 1.5 avg RR support a disciplined three-lot arm ~64560 after the Japan equity wash, with 4H–3D ALMA below-band overheat, 1D/1W bull FVG bounce-up skew (~58–73%), and Edge long tilt framing repair fuel — but Hub stays two-way into BOJ 17 Sep, weekly EMA is still −10% stretched above, Head & Shoulders caps a clean breakout, and a 3/4 pyramid leaves thin add room if yen/BOJ headlines gap; nominal risk stays on the −10% hard stop / Pine exit path.
Base case: follow 12H ALMA Averaging · hold/add only if lot 4 qualifies on a lower close · digest the ~63880–64970 ladder toward the ~64800–65800 FVG shelves if yen beta stabilizes without a gap through the stop.
Bear case: lose the ~63880 add · BOJ/yen headlines gap Nikkei lower · template posts −10% toward ~58102 from the working average · wait for the next bar-close arm.
═
█ STRATEGY
ALMA Averaging Strategy: ALMA 3 / σ2, SD band 2, min diff 1/4, 25% per bar, up to 4 adds, hard stop −10% from the working average.
Lots (3 of 4):
- Lot 1 — 01 Sep 10:00 UTC ~ 64970
- Lot 2 — 01 Sep 22:00 UTC ~ 64820
- Lot 3 — 02 Sep 10:00 UTC ~ 63882
Working average ~ 64557 . Hard stop −10% from that average ~ 58101 .
Lot 4 stays 25% per bar if a lower 12H close qualifies.
Strategy Tester (NIKKEI 12H):
Win rate 86% · profit factor 4.8 · max drawdown 27%
Avg winning trade +10.3% · avg losing trade −7.0%
Typical hold ~93×12H bars on winners — Japan equity mean-reversion grid on the 12H Averaging template · 110-trade sample
Exits follow Pine ALMA flip + min diff or the −10% hard stop from the working average.
Chart: SPREADEX:NIKKEI 12H — ALMA Averaging Strategy.
Educational idea. Live position — past backtest ≠ future results. NFA. Long 
DXY | The Structure That May Define the Next Decade DXY | The Structure That May Define the Next Decade 🌀
⏱️ Estimated Reading Time: 3 Minutes
On the current DXY chart, two major long-term scenarios remain under consideration: a Bullish Scenario and a Bearish Scenario. The difference between them begins with one critical question:
What exactly is the structure of the major move from the 2008 low to the previous peak?
The answer may help define the long-term direction of the U.S. Dollar Index.
🟢 Scenario One | Bullish Structure and Long-Term Continuation
In the bullish scenario, the major structure from the 2008 low may be part of a higher-degree Double Zigzag.
Under this interpretation, the previous large structure may represent Wave W, which itself developed as a Zigzag. The market then entered a corrective phase, and the previous peak may represent the beginning of the next major section of the larger structure—potentially leading toward Wave Y.
In this case, the current three-wave correction becomes extremely important. If the market completes this corrective structure and subsequently develops a valid bullish motive sequence, the probability of the larger bullish scenario increases.
Therefore, the bullish scenario still requires structural confirmation. A simple rise in price is not enough. The market must demonstrate that, after completing the correction, it is capable of producing a new motive structure.
A move toward and eventually through higher structural levels—particularly if accompanied by a clear impulsive sequence—could provide the first serious evidence that the bullish market is gaining control.
🔴 Scenario Two | A Major Impulse from the 2008 Low
The bearish scenario interprets the same long-term advance differently.
Under this view, the move from the 2008 low to the previous major peak may represent a five-wave impulsive structure. In other words, the entire advance could be part of a motive sequence of a much higher degree.
If this interpretation is correct, the previous peak may have completed a major wave, while the three-wave decline that followed may represent only a Zigzag correction for Wave B at the higher degree.
However, there is an important issue.
The current correction may still lack sufficient depth relative to the magnitude of the larger impulsive structure. For this reason, we cannot assume that the correction has necessarily ended in its simplest form.
The market may still develop:
A Simple Zigzag
A Double Zigzag
Or a more complex corrective combination
If the correction continues to develop, DXY could initially move toward the structural area of the B wave visible in the daily Zigzag before the larger structure becomes clearer.
🔍 The Most Important Question Right Now
At this stage, the key question is not whether DXY will simply rise or fall.
The real question is:
What pattern is the current price action actually building?
Are we completing a three-wave corrective decline?
Or is the decline developing into a clear five-wave impulsive structure?
Could we be seeing nested 1–2 structures, potentially preparing the market for a stronger expansion?
Or is price developing a Diagonal pattern?
The answers to these structural questions will determine the next analytical roadmap.
If the current decline maintains a corrective character and is followed by a valid bullish motive structure, the bullish scenario will gain increasing strength.
However, if price continues to develop a clear bearish impulsive sequence—and the corrections that follow remain consistent with the rules and guidelines of the Elliott Wave Principle—the bearish scenario at the larger degree will gain greater credibility.
⚖️ Conclusion | Structure Determines Direction
For now, both scenarios still require structural confirmation.
This is why the key levels highlighted on the chart are important. A simple break of a level should not automatically be considered final confirmation.
The more important question is:
What structure does the market build after the break?
A valid motive move followed by a correction consistent with Elliott Wave rules and guidelines could provide an important green light for the next scenario.
For now, our focus remains on the three waves and their internal structure.
Are they corrective?
Are they impulsive?
Or are they only part of a much larger combination?
As Elliott Wave analysts, we do not decide the future in advance.
We identify the structure the market is building in real time.
And until the market reveals its answer through structure, patience remains part of the analysis.
Structure First. Direction Second.
Patterns whisper. I listen.
— Mr. Nobody 🌀📊
U.S. Dollar Index
Feb 18, 2025
DXY – A Deep Decline Ahead? (Aggressive Bearish Scenario)
Dollar Index
Jun 7
DXY Structural Analysis: Navigating the Diagonal
Russell 2000 LONG — 12H ALMA Setup (WR 86% · avg RR 1.3)IG:RUSSELL · 12H · long only.
(Context: Russell 2000 — US small-cap beta via rates, breadth, and risk appetite — not a discretionary “buy the IWM dip” call.)
═
█ RESEARCH HUB
Category: Indices sentiment 32.4 (Fear) — built from 74 locked notes (11 constructive / 48 risk-off / 15 mixed); ticker verdicts +28 / −27. Fear is category-wide (USD / mega-cap stress in the verdict panel), not a Russell-only dossier.
Sector: same bucket as category (indices) — no separate GICS sleeve.
Asset: positive. Living one-liner is a Fed/Warsh global-investment growth read — constructive for risk beta
Tape:
- Category drivers skew risk-off on USD / large-cap proxies while JP / NQ verdicts stay constructive — breadth tape is two-sided into the jobs / FOMC week.
Calendar:
- 2026-09-02 · ADP Nonfarm + Fed Beige Book · indirect (US risk beta) · macro / cb
- 2026-09-04 · US August jobs / NFP (last print before FOMC) · indirect · macro
- 2026-09-16 · FOMC · indirect (rates / small-cap beta) · cb
Hub verdict: Indices fear vs a constructive asset one-liner — Hub is cautious on the index complex , not a veto. Small-cap Averaging fades the 12H wash into the jobs/FOMC week; the fear gauge is the backdrop, not a rate call.
═
█ MARKET EDGE
Long Edge 50.5 · Short Edge −40.6 ( 02 Sep ~ 2920 ).
Built from: TOTAL_BEAR phase · deviation stretch · ALMA overheat below · RSI oversold — discount board, not trend confirmation.
Positive factors
- ALMA — 1D SHORT OVERHEAT-S · S:5 vs SAvg:2.4 — daily band stretched below into the arm
- ALMA — 3D SHORT OVERHEAT-S · S:5 vs SAvg:3.0 — slow clock also stretched below
- EMA — 4H Below · Cur S:20 · Dev +1.8% · 1D Below · Cur S:5 · Dev +2.3% — validation clocks still discounted
- SMC — 4H OB Enter Normal Bull ~ 2924.8 ( 02 Sep ) · bounce up B 54.7% · break down Br45.3% (n=106) — mild demand at the fill pocket
- SMC — 1W FVG Enter Bull ~ 2970.3 ( 23 Aug ) · bounce up B 71.1% · break down Br28.9% (n=38) — weekly hold skew above the wash
- RSI 9 Oversold · 1D — oversold print on the daily clock
- Score skew long ~50.5 vs short ~−40.6 — board tilts discount / repair
Negative factors
- EMA — 1W Above · Cur L:63 · Dev −7.4% — weekly still long-side stretched; slow giveback risk if rates bite
- ALMA — 4H LONG · L:2 vs LAvg:3.5 — faster validation clock already above the band while 1D/3D stay OVERHEAT-S (TF war)
- ALMA — 1W SHORT · S:2 vs SAvg:2.7 — weekly below-band not fully stretched
- TL — Double Top (Classic) ( 31 Aug ) · bounce B 70% · break Br30% (n=53) — pattern bounce skew, but ceiling risk into the mid-2.9ks
- PA — Fractal High + Bearish FVG formed — local supply housekeeping at the arm
- Pyramid already 2 of 4 — thin cushion if the next 12H bars fail before lots 3–4 qualify
═
█ DESK
Hub is cautious (Indices fear · jobs/FOMC week). Edge is a clear discount long (Long 50.5 vs Short −40.6) from 1D/3D ALMA OVERHEAT-S and below-EMA stretch on 1H–1D. Alignment: fade the small-cap wash on the 12H Averaging clock — not a breadth breakout call. Separate from any open 6H Russell Idea on the profile.
Bar-close refill on 12H into the ~2920 pocket after the late-Aug / 01 Sep slide, not a chase of a one-bar bounce.
Takeaway: the 12H ALMA strategy and 86% WR / 1.3 avg RR support a disciplined two-lot arm ~2920 after the small-cap wash, with 1D/3D ALMA below-band overheat, 4H/1D bull demand skew (~55%), and weekly FVG bounce-up 71% framing repair fuel — but Indices Hub stays in Fear, weekly EMA is still −7.4% stretched above, 4H ALMA has already flipped LONG, and a Double Top print caps a clean breakout chase; nominal risk stays on the −10% hard stop / Pine exit path.
Base case: follow 12H ALMA Averaging · hold/add on qualifying 12H closes while the ~2915–2925 pocket digests · mean-revert toward the prior ~2955–2970 weekly FVG shelf if small-cap beta stabilizes without a gap through the stop.
Bear case: lose the ~2915–2920 demand cluster · jobs/FOMC headlines gap lower · template posts −10% toward ~2628 from the working average · wait for the next bar-close arm.
═
█ STRATEGY
ALMA Averaging Strategy: ALMA 3 / σ2, SD band 2, min diff 3/3, 25% per bar, up to 4 adds, hard stop −10% from the working average.
Lots (2 of 4):
- Lot 1 — 01 Sep 23:00 UTC ~ 2922.7
- Lot 2 — 02 Sep 11:00 UTC ~ 2916.2
Working average ~ 2919.5 . Hard stop −10% from that average ~ 2627.5 .
Adds 3–4 stay 25% per bar if lower 12H closes qualify.
Strategy Tester (RUSSELL 12H):
Win rate 86% · profit factor 4.2 · max drawdown 16%
Avg winning trade +6.0% · avg losing trade −4.7%
Typical hold ~56×12H bars on winners — US small-cap mean-reversion grid on the 12H Averaging template · 71-trade sample
Exits follow Pine ALMA flip + min diff or the −10% hard stop from the working average.
Chart: IG:RUSSELL 12H — ALMA Averaging Strategy.
Educational idea. Live position — past backtest ≠ future results. NFA. Long 
Long 
Long