Market indices
DAX 40: Back Above 24,840. Now 25,000 Decides.Chip stocks just had their best day in weeks, and DAX rode the wave back above the 24,840 line it broke last Friday.
THE LEVEL THAT FLIPPED OVERNIGHT
Micron, SK Hynix and SanDisk all jumped 4-8% on Monday. UBS called the whole move a "positioning unwind" after a huge run-up this year, not a sign anything is actually broken. That rebound pulled DAX back above 24,840, the line that snapped on Friday and stayed broken through the weekend. Now the question is whether it holds.
THE LEVELS ON RECORD
Reclaim: 25,200, the July 2 breakout shelf. Clear this and the bearish case is dead.
Today's hurdle: 25,000, the next resistance on the way up.
The new floor: 24,840, just reclaimed overnight. This has to hold.
Downside marker: 24,635, already tagged on Friday if the floor gives way again.
THE PLAN FOR EACH SIDE
Long: a 1H close above 25,000 opens the door back to 25,200.
Short: a 1H close back below 24,840 that holds reopens 24,635.
No trade: between 24,840 and 25,000, this is still just digesting the bounce.
IF I'M WRONG
A close back under 24,840 means the overnight reclaim was a fakeout, not a real recovery. No shame in that. It just means the chip-stock rebound didn't have enough behind it to carry DAX with it, and 24,635 comes back into play.
A BOUNCE ISN'T A TREND YET
Reclaiming a broken level overnight feels like a big deal, but it's only the first step. The real test is whether price can push through the next resistance above it. Until DAX clears 25,000, this is a level getting retested, not a trend that's changed.
Zooming into the daily DAX map () for the bigger structure. I will update this idea as the levels get tested.
UK100 Price Outlook – Trade Setup🌐Macro Background
The UK100 index staged a modest rebound in early trading following a selloff—its largest single-day drop in over a week. Investor focus is firmly fixed on the domestic political transition and upcoming economic releases. Following Andy Burnham's assumption of office as Prime Minister, markets are closely assessing the incoming administration's fiscal strategy, economic policy trajectory, and cabinet formation.
Beyond Westminster, macroeconomic catalysts are set to drive near-term volatility. Upcoming UK employment figures and tomorrow’s critical CPI inflation data will serve as key metrics for gauging the Bank of England's (BoE) monetary policy trajectory and near-term rate expectations.
📊Technical Structure
Price action is currently oscillating within an ascending channel structure defined by higher highs and higher lows since early July.
Key Resistance Zone ($10,530 – $10,571): The index recently faced strong selling pressure at the upper boundary.
Key Support Zone ($10,396 – $10,436): Following the pullback, price is hovering near mid-channel support.
🎯Trade Setup
Given that the index is currently holding near the lower boundary of its ascending structure, a Range-Bound Buy on Support / Pullback strategy is favoured:
Entry Point: Look for long positions on a retest or price stabilisation within the $10,436 – $10,460 region.
Take Profit 1 (TP1): $10,530 (lower boundary of the Resistance Zone).
Take Profit 2 (TP2): $10,571 (upper edge of the Resistance Zone / recent swing high).
❌Invalidation
If it closes decisively below $10,396, breaking the lower trendline of the channel.
📝Trade Summary
Go Long on UK100 in the $10,436 – $10,460 zone, targeting $10,530 – $10,571, as the index rebounds off ascending channel support amidst UK political transition and key labor/CPI data releases (Stop Loss below $10,390).
⚠️Disclaimer
This analysis is for reference only and does not constitute trading advice. Financial markets involve significant risk; proper risk and position management are essential.
SPX500 H1: Buyers Are Defending the Short-Term Bottom ZoneSPX500 is attempting to stabilize after a strong decline from the peak area around 7,575. The price is currently trading above the key support zone at 7,455, where buying pressure has repeatedly emerged and helped the index avoid forming a new lower low.
If this support zone continues to hold, SPX500 could establish a short-term bottom and extend its recovery toward the 7,500 area, followed by the main target around 7,550. However, buyers still need a clear confirmation signal, such as a strong bullish candle or the formation of a higher low structure.
Entry focus: Prefer Buy setups when price retests 7,455 and shows bullish confirmation.
Target: 7,550.
Invalidation: A clear H1 candle close below 7,455 would indicate that the support zone has failed, increasing the possibility of further selling pressure.
US100 Market Structure | Concept In ActionThis US100 breakdown is a follow-up to yesterday's Market Structure Read.
In the previous video, the focus was on understanding how market structure is analysed from the higher timeframe down to the lower timeframe before considering any execution.
Today, we revisit that same concept using a practical market example.
The purpose of this video is not to provide a trading signal or suggest that the same outcome will always occur.
Instead, it shows how the market developed after the analysis and why waiting for structure, confirmation and disciplined execution remains an important part of the decision-making process.
The process remains the same:
• Higher timeframe context
• Market structure
• Key reaction areas
• Lower timeframe confirmation
• Risk management
The objective is not to predict every move.
The objective is to build context first and allow price to confirm the idea before taking action.
This follow-up is shared to connect yesterday's educational breakdown with a real market example and to reinforce the importance of following a structured process.
Educational content only. Not financial advice. Past performance does not guarantee future results.
US30 H1 — Bullish Recovery SetupUS30 is attempting to recover after reacting from the 51,850–51,900 support area.
We are watching for bullish continuation while price holds above 51,820, with potential toward 52,300 first and 52,630 as the main target.
Invalidation: Below 51,820
Targets: 52,300 and 52,630
Nikkei: Japanese Stocks Rise in Post-Holiday TradingNikkei: Japanese Stocks Rise in Post-Holiday Trading IG:NIKKEI
The benchmark Nikkei 225 index surged +1.2% to climb above 64,900, while the Topix index also gained +0.8% to 3,950, effectively recouping most of last week's losses after market participants returned from the extended holiday weekend.
In accordance with our precise portfolio calculations yesterday, the wave of selling pressure on semiconductor and artificial intelligence ecosystem stocks has officially subsided.
Institutional investors in Japan launched a wholesale buying spree (bargain hunting), following the gains on Wall Street overnight after the bleeding in New York technology stocks stopped.
✅ Validation of the End of the Hardware Correction (Post-Holiday Tech Rebound)
The main catalysts that rekindled confidence in Asia Pacific institutional investors came from Wall Street last night:
- ⚡Market Gains Acceleration: The halt in the sell-off in US semiconductor giants (Nvidia +1.5%) provided a significant breath of fresh air for the Tokyo stock exchange.
- ⚡Confidence Restoration: Market participants in Japan used last week's price adjustments as a golden opportunity to repurchase discounted hardware companies ahead of the release of Alphabet's draft capex guidance this week.
Large-scale wholesale buying sprees hit the Tokyo stock exchange's capitalization leaders this afternoon:
- ⚡Kioxia Holdings ($6,600) Soars +3.4% & Ibiden Co Soars +3.0%: Kioxia led the flash memory sector's reversal, soaring after recovering from the pressure of Bain Capital's share dumping last week. Ibiden also soared, driven by a rush of foreign capital, supported by high orders for advanced chip packaging circuit boards.
- ⚡Advantest Corp (+0.8%), Taiyo Yuden (+0.9%), & Fujikura Ltd (+0.9%): The cluster of semiconductor test machines, passive electronic components, and compact fiber optic/copper cables rebounded, confirming a structural recovery in the physical computing supply chain.
- ⚡Mitsubishi UFJ Financial ($8,306) +0.8% & Sumitomo Mitsui ($8,316) +0.9%: The major banking sectors (MUFG & SMFG) moved higher linearly, along with retail giant Fast Retailing (+1.3%), acting as a bulwark of support, securing the Topix index's close in the green.
Nifty strategy for 21-07-2026Nifty may open on gap down note as per sgx nifty around at 24140 levels in today morning session where nifty has taken support in yesterday. I am expecting nifty may consolidated between 24300 to 23800 levels until upto closed either upside or downside on daily charts.Brent crudeoil traded nearly 90 dollars levels so emerging markets may face some pressure which are depends on import crudeoil from gulf countries. in yesterday U.S markets are down due to oil prices surges and inflation worries in the U.S. so I am advised to traders follow the sell on rise strategy in today session. I am expecting volatality session for today due to option expiry held in today so traders can trade at support and resistance levels with strict stop losses.
Nifty trading levels :
Sell nifty : (open price for risky traders)
:24190(for safe traders)
stop loss : 24265
1st target : 24080
2nd target : 23950
stock of the day : PNB in this stock breakout occured in the descending triangle pattern on daily charts with good volumes so I am expecting some more upside in this stock.
Buy price : 110
stop loss : 107(on daily closing price)
target : 115
Disclaimer : I am not a SEBI Research Analyst please take advise from your financial advisor before take position based on my recommendation.
Thanking for your support if liked my content please suggest to your friends to follow my channel
Please drop a comment on whether my recommendation is useful and correct my mistakes
NIFTY 50: Gap-Down Opening Expected Amid Weak Global CuesNIFTY is expected to open with a gap down due to weak global cues. The 15-minute chart continues to trade below a descending trendline, indicating that the short-term bias remains cautious unless price reclaims the trendline resistance.
Key Intraday Levels
Support Zones:
24,120–24,150
24,060–24,090
23,980–24,020
Resistance Zones:
24,180–24,210
24,240–24,270
24,320–24,350
Intraday Options Trading Setup
Bearish Setup:
Buy 24,150 PE if NIFTY fails to sustain above 24,200 after the first 10–15 minutes.
Stop-loss: Spot above 24,220
Targets: 24,100 and 24,060
Bullish Setup (Only on Confirmation):
Buy 24,250 CE or 24,300 CE only after a 15-minute candle closes above 24,250.
Stop-loss: Spot below 24,210
Targets: 24,320 and 24,350
My View
Weak global cues suggest a cautious start. I will avoid trading immediately after the opening and wait for the first 10–15 minutes to confirm the day's direction. As long as NIFTY remains below 24,240–24,270, rallies may face selling pressure. A sustained move above this zone could trigger short covering and shift the intraday momentum in favour of the bulls.
Suggestion:
Trade only after confirmation, respect your stop-loss, and let price action decide the direction. On volatile days, capital preservation is more important than taking frequent trades.
Education purpose only and not financial advice.
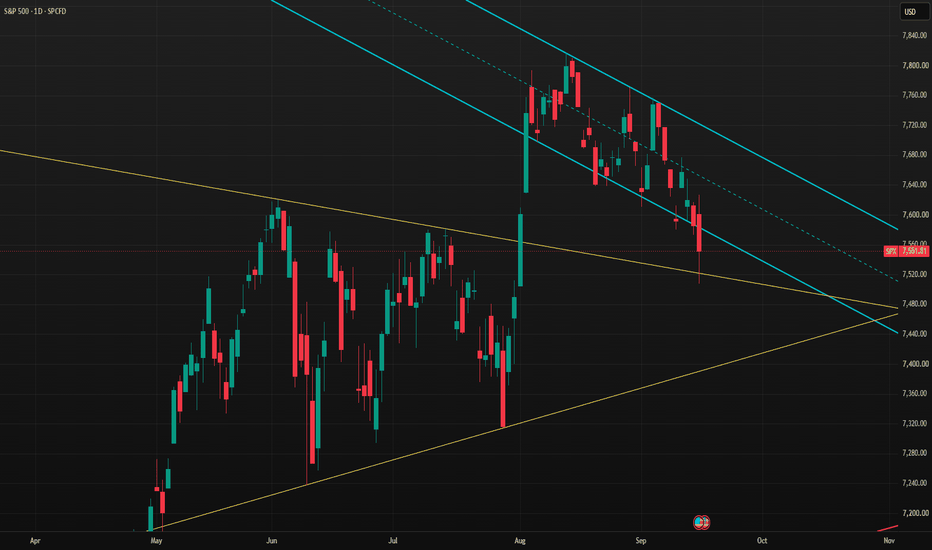
Spx 500 -- A Burdensome Stone
Matthew 3:11-12 I indeed baptize you with water unto repentance. but He that cometh after me is mightier than I, whose shoes I am not worthy to bear: He shall baptize you with the Holy Ghost, and with fire: Whose fan is in His hand, and He will throughly purge His floor, and gather His wheat into the garner; but He will burn up the chaff with unquenchable fire.
Matthew 7:24-25 Therefore whosoever heareth these sayings of Mine, and doeth them, I will liken him unto a wise man, which built his house upon a rock: And the rain descended, and the floods came, and the winds blew, and beat upon that house; and it fell not: for it was founded upon a rock.
Matthew 16:25 For whosoever will save his life shall lose it: and whosoever will lose his life for My sake shall find it.
Matthew 21:44 And whosoever shall fall on this stone shall be broken: but on whomsoever it shall fall, it will grind him to powder.
Romans 10:9-10 If thou shalt confess with thy mouth the Lord Jesus, and shalt believe in thine heart that God hath raised Him from the dead, thou shalt be saved. For with the heart man believeth unto righteousness; and with the mouth confession is made unto salvation.
S&P 500 — chips rebound into big tech earnings, testing tThe S&P 500 has been in a strong uptrend through 2025 into 2026, the MA bundle mostly holding as support through each pullback along the way.
Last week brought a real pullback — a sharp selloff in chip stocks pulled the index back from its recent highs. This week, chips are recovering, and the index is testing its bundle again just as a heavy stretch of megacap earnings begins (Alphabet, Tesla, Intel, IBM all reporting this week).
This is a useful structural test: does the bundle hold as support again through earnings volatility, or does this pullback mark a real break in trend? Not a prediction — a way to read what the structure is doing right now, as real news flow hits the tape.
Not financial advice — for analysis and education only. Method: Insen / OpenTraders.
Nifty50 Index - Intraday Technical Analysis for 21st July, 26NSE:NIFTY
Nifty 50 Index (NSE) | Intraday Structure | July 21, 2026
Nifty is trading around 24,239.50, pinning itself right against the 24,239 Zero Line. The index has rebounded into a tight consolidation block after absorbing downside liquidations toward 24,140 in the prior session, attempting to establish structural equilibrium around its central value node.
Price action enters the new trading session heavily compressed within the primary inflection pivot. Institutional desks are holding back major directional size, waiting for a high-volume candle breakout away from this cluster to confirm trend expansion. Let a clean 15-minute candle close confirm directional acceptance before allocating capital.
Bullish Triggers
Long Entry: Above 24,216 (strongly validated if price actively secures structural footing above the 24,201 Add Long band).
Targets: 24,319 - 24,369
Risk Control: Structure weakens below 24,201. Hard exit below 24,173.
Bearish Triggers
Short Entry: Below 24,186 (validated if the 24,239 Zero Line persistently acts as a rigid distribution ceiling).
Targets: 24,158 - 24,108
Risk Control: Cover immediately above 24,229. Bias structurally protected below 24,266.
No-Trade Chop Zone: 24,173 - 24,216
Expect highly rotational, choppy price action within this decision block as option sellers look to grind out premium. Avoid chasing early morning spikes inside this range; let a clean structural candle breakout provide true execution verification.
Execution Rule: Structure first, confirmation next. Zero anticipation.
Hit Boost and drop your view in the comments if you're tracking these levels today.
#Nifty50
DAX 40: 24,840 Caps the BounceThird straight day the memory-chip rout has run, and now it's got company. Over the weekend the US struck Iran again, Iran hit back at Gulf bases, and the blockade got reinstated -- Brent jumped to its highest since June 11. Two separate storms, one shared victim: DAX bounced off Friday's low but hasn't been able to clear the ceiling that broke last week.
THE WALL AT 24,840
Reclaim: 25,200 (Jul 2 breakout shelf) -- kills the bearish case entirely.
First test: 25,000 -- lost five sessions ago, now overhead resistance.
Make-or-break: 24,840 -- broke for the first time Friday, and price is capped underneath it again this weekend.
Target: 24,636 -- already tagged Friday's low, the level I'm watching for a retest.
THE PLAN IF THE WALL HOLDS
Short: a 1H close back below roughly 24,780 with 24,840 rejected on the bounce -- entry there, stop above 24,900 (this weekend's high), target 24,636 first then 24,400.
No trade: 24,780-24,900, still digesting the weekend gap.
Bull invalidation: a 1H close back above 24,840 that actually holds, or above 25,000 outright -- either kills the short case and I'll say so.
TWO CRISES, ONE LEVEL
Geopolitics and semiconductors don't usually share a calendar. Right now they do, and both point the same direction, which is exactly why 24,840 has held as resistance on the bounce instead of getting reclaimed outright. But two narratives converging on one level cuts both ways -- if either eases (a ceasefire headline, a chip-stock bounce), the level can flip fast. Don't mistake conviction from two stories for certainty from one chart. No shame in being wrong here if it happens -- I'll own it.
I will update this idea as the levels get tested.
(Zooming into the daily DAX map: )
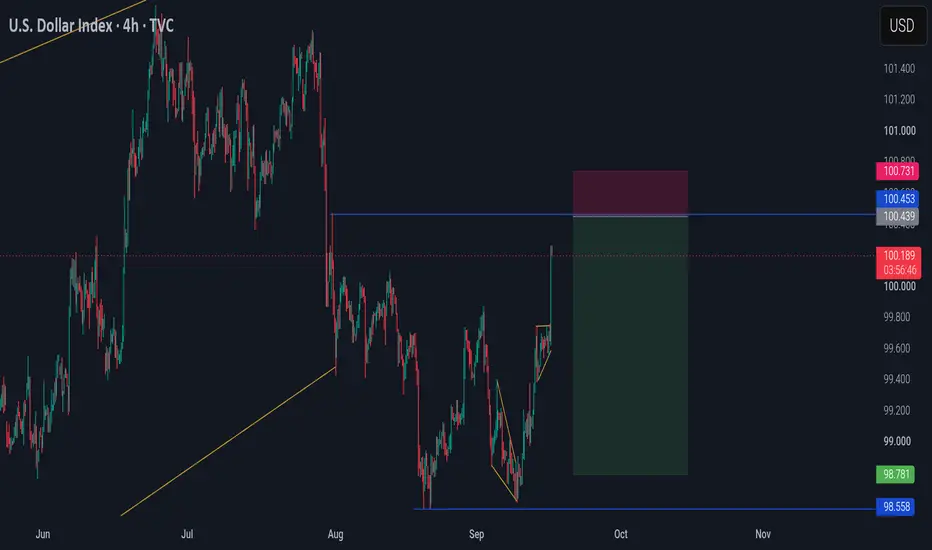
US Dollar M30 | Potential Sell-Off AheadThe price has rejected off our sell entry level at 100.47, which is an overlap resistance.
Our stop loss is set at 100.69, which is a pullback resistance.
Our take profit is set at 100.25, a pullback support.
High Risk Investment Warning
Stratos Markets Limited fxcm.com Stratos Europe Ltd, fxcm.com CFDs are complex instruments and come with a high risk of losing money rapidly due to leverage. 69% of retail investor accounts lose money when trading CFDs with this provider. You should consider whether you understand how CFDs work and whether you can afford to take the high risk of losing your money.
Stratos Global LLC fxcm.com Losses can exceed deposits.
Please be advised that the information presented on TradingView is provided to FXCM (‘Company’, ‘we’) by a third-party provider (‘TFA Global Pte Ltd’). Please be reminded that you are solely responsible for the trading decisions on your account. Any information and/or content is intended entirely for research, educational and informational purposes only and does not constitute investment or consultation advice or investment strategy. The information is not tailored to the investment needs of any specific person and therefore does not involve a consideration of any of the investment objectives, financial situation or needs of any viewer that may receive it. Past performance is not a reliable indicator of future results. Actual results may differ materially from those anticipated in forward-looking or past performance statements. We assume no liability as to the accuracy or completeness of any of the information and/or content provided herein and the Company cannot be held responsible for any omission, mistake nor for any loss or damage including without limitation to any loss of profit which may arise from reliance on any information supplied by TFA Global Pte Ltd.
Stratos Trading Pty. Limited fxcm.com Trading FX/CFDs carries significant risks. FXCM AU (AFSL 309763), please read the Financial Services Guide, Product Disclosure Statement, Target Market Determination and Terms of Business at fxcm.com
Bullish bounce setup?US Dollar could fall to the support level, which is a pullback support and could bounce from this level to our take profit.
Entry: 100.65
Why we like it:
There is a pullback support level.
Stop loss: 100.46
Why we like it:
There is a pullback support level.
Take profit: 100.93
Why we like it:
There is a pullback resistance level.
Enjoying your TradingView experience? Review us!
Please be advised that the information presented on TradingView is provided to Vantage (‘Vantage Global Limited’, ‘we’) by a third-party provider (‘Everest Fortune Group’). Please be reminded that you are solely responsible for the trading decisions on your account. There is a very high degree of risk involved in trading. Any information and/or content is intended entirely for research, educational and informational purposes only and does not constitute investment or consultation advice or investment strategy. The information is not tailored to the investment needs of any specific person and therefore does not involve a consideration of any of the investment objectives, financial situation or needs of any viewer that may receive it. Kindly also note that past performance is not a reliable indicator of future results. Actual results may differ materially from those anticipated in forward-looking or past performance statements. We assume no liability as to the accuracy or completeness of any of the information and/or content provided herein and the Company cannot be held responsible for any omission, mistake nor for any loss or damage including without limitation to any loss of profit which may arise from reliance on any information supplied by Everest Fortune Group.
SPX Weekly Cycle: Q1 Pulldowns & 2nd Half LegsOverview:
Looking at the SPCFD:SPX weekly chart, a distinct seasonal rhythm emerges across recent years. Beyond the clean rising wedge structure and steady volume accumulation, the calendar footprint shows a clear biannual pullback cycle.
1. The Q1 Anchor Pullback:
Every year since 2022, the first major structural correction initiates during the first quarter:
2023: Early spring dip before the summer rally leg.
2024: Late March pause and quick flush.
2025: Sharp drop down baseline before a full V shaped recovery.
2026: Mid Q1 pullback shaking out weak hands early.
2. The Mid to Late Year Leg:
The second pullback of the annual cycle typically hits around the late July to early Q3 window (seen mid August 22, late July 2023, and July 2024).
The outlier was 2025. Why? Because the early 2025 correction was unusually severe in depth, it displaced the standard Q3 timing and pushed the structural reset dynamic around.
3. Rising Wedge:
Volume: Weekly volume remains elevated inside this rising wedge. This points to active institutional turnover and sector rotation rather than an exhausted, dry liquidity squeeze.
RSI Divergence: Lower highs on the weekly RSI show momentum slowing. However, weekly RSI divergence is notoriously early. With RSI still holding strong near 60, divergence acts as a background context signal rather than an immediate reversal trigger.
Conclusion:
As price trades near channel resistance, history favors respecting the mid year seasonal window while monitoring fast EMA support levels for structural integrity. Not calling for a correction, but caution!
$SOXX vs $NDX: AI Hardware vs Broad Tech CycleWhile the Nasdaq 100 and Semiconductors generally move together, their big divergences since 2024 show who is really leading the market:
Yellow Box (Broad Tech Leads):
What happened: Big Tech ( NASDAQ:AMZN , NASDAQ:AAPL , NASDAQ:GOOGL , NASDAQ:TSLA ) provided steady stability while chipmakers took a breather to clear out extra inventory and wait for corporate budgets to catch up.
White Box (Chips Take the Lead):
What happened: AI infrastructure went into hyper-drive. Massive spending on chips sent NASDAQ:SOXX on a wild run. Because chip stocks move faster and hit harder than broad tech, NASDAQ:SOX surged higher and steeper than $NDX.
The Recent Pullback:
What happened: NASDAQ:SOXX got stretched too far, too fast. When the market takes a breath, the highest flying sector drops the hardest. Hence, why chip stocks took a deeper dive recently while broad tech held up relatively better.
Nifty Analysis EOD – 20 July 2026 – Monday🟢 Nifty Analysis EOD – 20 July 2026 – Monday 🔴
Calm Before Expiry: Bulls and Bears Breathe Easy Inside a 112-Point Cage
🗞 Nifty Summary
Nifty opened with a gap down of 148 points after a weekend filled with geopolitical noise. The very first one-minute candle itself carved out the full 112.45-point range for the day — and then the session just lived inside that range till the close. Compact, yes. But plenty of drama packed in.
The day closed at 24,238.50 (adjusted close 24,238.50). What makes today’s candle interesting is that it fits a near-perfect inside bar pattern by the book — range well within the previous session’s range, both sides contained. With the ATR sitting at 239.60, today’s contraction feels deliberate. The market seems to be coiling energy ahead of tomorrow’s weekly expiry.
My back test data says most Mondays tend to stay within the IB range, or give a fakeout on either side. So I’m usually not looking for an IB breakout trade on Mondays — and that read played out today. The IBL breakdown ended up offering a nice contra trade opportunity instead.
Tomorrow’s opening is the one thing I’ll be watching closely before forming any directional bias for the session. The expiry session usually brings the volatility that today’s session held back.
🛡 5 Min Intraday Chart with Levels
📉 Daily Time Frame Chart with Intraday Levels
🕯 Daily Candle Breakdown
Open: 24,190.05
High: 24,266.10
Low: 24,135.85
Close: 24,238.50
Change: −95.80 (−0.39%)
🏗️ Structure Breakdown
Type: Bullish Inside Bar — demand absorbed the gap-down open and recovered toward the upper half
Range: ≈ 130 points — moderate volatility
Body: ≈ 48 points — mild buyer pressure, close well off the lows but below open
Upper Wick: ≈ 28 points — some supply resistance near the highs
Lower Wick: ≈ 54 points — decent demand response from the session lows
🛡 5 Min Intraday Chart
⚔️ Gladiator Strategy Update
ATR: 239.60
IB Range: 112.45 → Medium
Market Structure: Balanced
Trade Highlights:
10:34 Short Trade: Target Hit (R:R 1:4.16)
12:11 Long Trade: SL Hit
12:52 Long Trade: Target Hit (R:R 1:3.41)
Trade Summary: The short at 10:34 worked well — a 1:4.16 on a Monday inside-range session is not something to take lightly. The 12:11 long got stopped out, which is part of the game in a range-bound session where neither side commits fully. Good that the 12:52 long came back and delivered a 1:3.41. Two targets and one SL — the system held its shape today. Overall a decent Monday, especially given the kind of compressed price action we were working with.
🧱 Support & Resistance Levels
Resistance Zones: 24,260 | 24,300 | 24,360 ~ 24,380 | 24,430 | 24,460
Support Zones: 24,200 ~ 24,160 | 24,100 | 24,030
🧠 Final Thoughts
“Stillness is not absence of direction — it is direction holding its breath.”
Today was one of those sessions where the market said a lot by doing very little. A 148-point gap down at open, and then nearly the entire day spent inside that first candle’s range. The drama was real, just compressed.
For tomorrow, the levels I’m watching are 24,260 and 24,300 on the upside — if those give way early, the 24,360 ~ 24,380 zone becomes the next conversation. On the downside, 24,200 ~ 24,160 is the floor that needs to hold. A clean break below that, and 24,100 comes into the picture quickly on an expiry session.
Tomorrow I’ll let the opening play out before deciding anything. Weekly expiry sessions can flip fast — the plan is to watch, wait for a setup that makes sense, and not force a trade just because it’s expiry day.
✏️ Disclaimer
This is my personal digital diary and represents my own analysis and point of view. It is not financial advice; please consult a professional advisor before making any trading decisions.