Nifty levels - Jul 15, 2026Nifty support and resistance levels are valuable tools for making informed trading decisions, specifically when combined with the analysis of 5-minute timeframe candlesticks and VWAP. By closely monitoring these levels and observing the price movements within this timeframe, traders can enhance the accuracy of their entry and exit points. It is important to bear in mind that support and resistance levels are not fixed, and they can change over time as market conditions evolve.
The dashed lines on the chart indicate the reaction levels, serving as additional points of significance to consider. Furthermore, take note of the response at the levels of the High, Low, and Close values from the day prior.
We hope you find this information beneficial in your trading endeavors.
* If you found the idea appealing, kindly tap the Boost icon located below the chart. We encourage you to share your thoughts and comments regarding it.
Wishing you success in your trading activities!
Market indices
BankNifty levels - Jul 15, 2026Utilizing the support and resistance levels of BankNifty, along with the 5-minute timeframe candlesticks and VWAP, can enhance the precision of trade entries and exits on or near these levels. It is crucial to recognize that these levels are not static, and they undergo alterations as market dynamics evolve.
The dashed lines on the chart indicate the reaction levels, serving as additional points of significance. Furthermore, take note of the response at the levels of the High, Low, and Close values from the day prior.
We trust that this information proves valuable to you.
* If you found the idea appealing, kindly tap the Boost icon located below the chart. We encourage you to share your thoughts and comments regarding it.
Wishing you successful trading endeavors!
CPI May Be the First Leg, Not the BottomA softer headline CPI may offer temporary relief if falling gasoline prices pull inflation lower. But the market is looking beyond the headline.
Core inflation is still expected to remain sticky, while Christopher Waller has warned that persistently high core inflation could force the Fed to consider tightening policy. That leaves investors facing a difficult combination: weaker equity valuations, higher Treasury yields and less confidence in a near-term rate-cut cycle.
If CPI disappoints, U.S. stocks could extend their decline as crowded AI and growth trades are repriced first.
My scenario is that the market may find a short-term trading bottom around August, followed by a relief rebound. But that rebound may not mark the end of the correction. A second wave of selling could return around October if inflation remains sticky, yields stay elevated and earnings expectations begin to weaken.
The key signals to watch are:
Core CPI and services inflation
The 2-year and 10-year Treasury yields
Fed hike expectations
Market breadth
AI and semiconductor leadership
Credit-market stress
A lower headline CPI does not automatically mean that inflation is under control. Energy can create a temporary disinflation illusion while the core trend remains uncomfortable.
August may bring a tradable low. October may bring the next test.
Market commentary only. Not investment advice.
Yesterday played out wellThe FTSE finished yesterday around the 10498 area and was remarkably resilient considering the broader risk-off move.
The main reason for that is oil. The FTSE's heavy exposure to the energy sector means rising crude prices can actually provide support to the index through the likes of BP and Shell. That is exactly what we saw yesterday, with energy strength helping offset weakness elsewhere in the market. However, the FTSE is not completely immune from a global equity sell-off.
European futures are pointing lower this morning and if the DAX and US futures continue to weaken, I think the FTSE will eventually struggle to hold up on energy strength alone.
What I'm Watching
The first area I am watching is the recent support around the 10460 area.
Below that, the 10400 zone becomes increasingly important.
If we see an early drop into support followed by buyers stepping back in, then the FTSE could once again prove to be the strongest of the major indices.
The first meaningful resistance is around the 10540 area, with 10585 above that.
A break and hold above those levels would put the bulls back in control.
Trading Plan
I am neutral to slightly bearish initially.
I don't want to buy the first dip blindly.
The ideal long setup would be an early sell-off into support followed by a strong bullish reaction and a reclaim of the short-term moving averages.
If 10460 breaks cleanly and the market starts forming lower highs, then I would be more interested in selling a failed bounce towards the 10400 area.
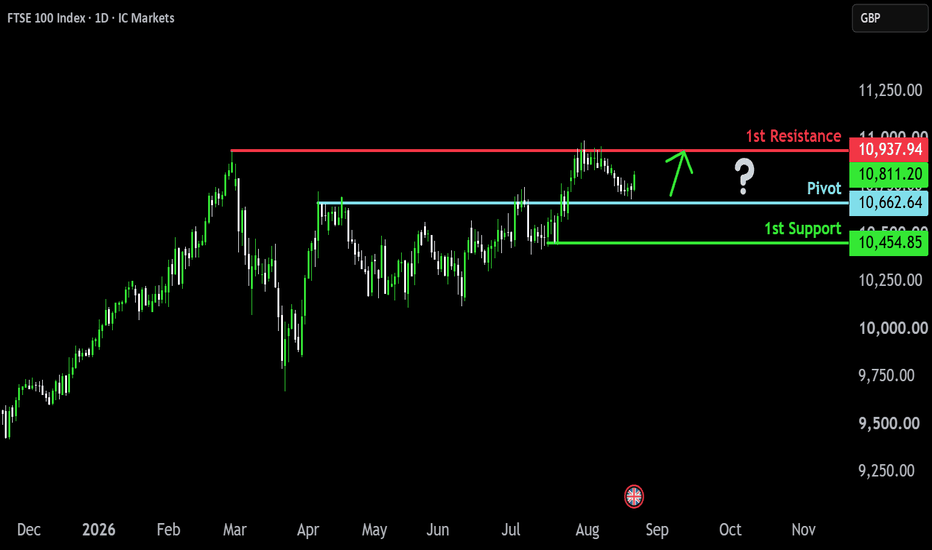
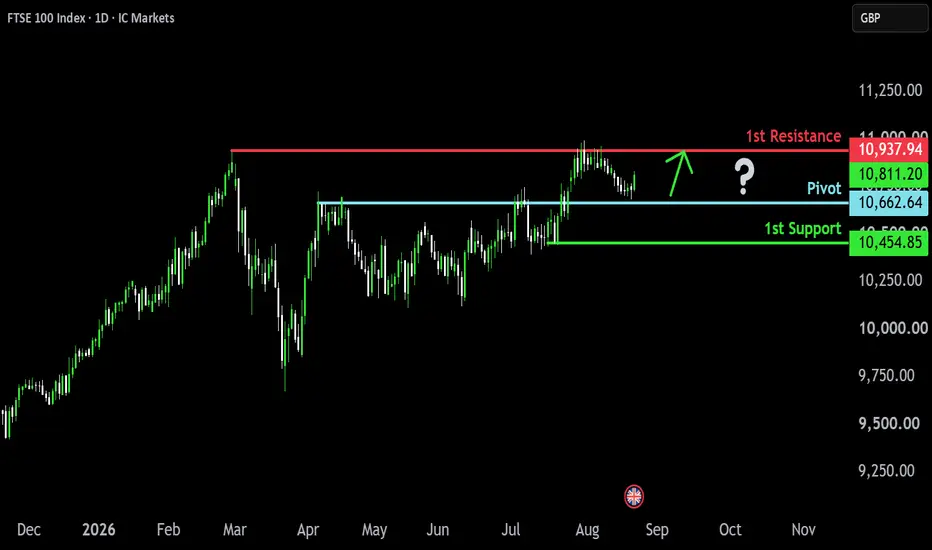
FTSE 100: Momentum Weakens as Key Support Comes Under PressureThe FTSE 100 has failed at the April high near 10,725, and momentum is beginning to deteriorate.
The RSI has slipped below 50, while both the MACD and DMI are turning increasingly negative, suggesting upside momentum is fading.
The market is currently testing the 55-day moving average around 10,410. A sustained break below this level would expose the 200-day moving average near 10,156.
The longer-term picture remains constructiveโfor now. The 200-day moving average has underpinned the bull trend for over a year and sits close to the 55-week moving average at 9,903, creating an important support zone.
However, the key level to watch is the March reaction low at 9,670. A weekly close below this level would break the pattern of higher highs and higher lows that defines the current uptrend and would significantly increase the risk that a major top is forming.
At present, the FTSE 100 remains range-bound, but the technical evidence suggests the balance of risk is beginning to shift to the downside.
Disclaimer:
The information posted on Trading View is for informative purposes and is not intended to constitute advice in any form, including but not limited to investment, accounting, tax, legal or regulatory advice. The information therefore has no regard to the specific investment objectives, financial situation or particular needs of any specific recipient. Opinions expressed are our current opinions as of the date appearing on Trading View only. All illustrations, forecasts or hypothetical data are for illustrative purposes only. The Society of Technical Analysts Ltd does not make representation that the information provided is appropriate for use in all jurisdictions or by all Investors or other potential Investors. Parties are therefore responsible for compliance with applicable local laws and regulations. The Society of Technical Analysts will not be held liable for any loss or damage resulting directly or indirectly from the use of any information on this site.
Japan 225Hi guys, so I got a new prop account. It's a naira account and I have passed the two phases. Currently expecting a 6% drawdown.
I figured that have a good RR doesn't come from refinement but from what you see on the chart. Yes, people do 5 pips sl and so but i can't because of reason unknown to me.
So i have had this trade for the longest of time. Set your alert let's see if we will ride this down to the apex...
DXY BULLISH REVERSAL: Major Trendline Breakdown Confirmed!DXY BULLISH REVERSAL: Major Trendline Breakdown Confirmed! ๐
Description:
The U.S. Dollar Index (DXY) has confirmed a significant bullish market structure shift on the 2h timeframe. After a prolonged bearish phase, price has aggressively forced a clean breakout above the long-standing dynamic descending trendline resistance. This structural displacement confirms that the immediate institutional order flow has shifted from sell-side dominance to buy-side accumulation. We anticipate a continued bullish expansion to clear overhead liquidity and reach the projected upside targets.
Key Structural Levels:
๐ด Major Support / Invalidation Zone: 100.800 โ 101.000 (Body close back below the broken trendline)
๐ Current Reaction Level: 101.166
๐ต 1st Bullish Objective: 101.457 (1ST RESISTANCE)
๐ต 2nd Bullish Objective: 101.775 (2ND RESISTANCE)
Trading Perspective:
Look for high-probability long execution setups on lower timeframes (M15/M5) inside local demand zones or on any minor corrective pullback to test the broken trendline area as support. A clean 2h candle body close back below the broken trendline zone will fully invalidate this bullish setup.
This analysis is based on technical structure and market behavior, not financial advice.
SPX: Breakout Retest โ Former Resistance Turning Into Support?๐ #SPX | Technical Analysis
The S&P 500 continues to develop a bullish scenario after breaking the resistance of the descending wedge. This is an important technical signal in favor of further upside movement.
Today, the key moment is a possible retest of the broken resistance. The market now needs to confirm that the former resistance is ready to turn into new support.
If the price holds above the breakout zone and buyers maintain control, this will provide additional confirmation of the strength of the current move and may open the way for further growth.
๐ What we are watching now:
โข The descending wedge has been broken to the upside.
โข A retest of the broken resistance is possible.
โข EMA50 remains the nearest dynamic support.
โข EMA200 continues to support the long-term bullish structure.
โข RSI remains in a positive zone.
โข OsMA supports the bullish momentum.
๐ฏ Key points to watch:
โข Price reaction during the retest of the broken level.
โข Holding above the upper boundary of the wedge.
โข Confirmation of support from buyers.
โข Price staying above EMA50.
โ ๏ธ Important:
Today, we need confirmation of the breakout. If the former resistance turns into support, this will significantly strengthen the bullish scenario. These retests often become important confirmation points before the next upward impulse.
The market structure currently looks constructive, but the successful retest will provide the strongest confirmation of buyer strength.
Another Test of 7555 AheadHello, traders!๐ด
In my previous post, I specifically highlighted the less obvious 7555 level. It has now proven to be a very important areaโ๏ธโ๏ธโ๏ธ, and my upcoming analysis will continue to be based on how price reacts around it.
As I mentioned in the last update:
โI consider this level to be the key factor in determining the next move. If SPX breaks above 7555 and manages to hold that level, clearing the all-time high at 7625 should not be a major challenge. In that case, the path toward the next target at 7950 opens up. However, if price gets rejected at 7555 once again or forms another false breakout, there's a high probability we'll see a move back toward the 7450-7500 area, where the 100 EMA and 200 EMA on the 4H timeframe are currently located.โ
So far, this ๐ป scenario has played out exactly as expected. We saw a rejection from 7555 followed by a pullback to 7500 โ
The fact that the pullback is currently finding support at the 4H EMA 100 while also holding above the 1H EMA 100 and EMA 200 is clearly a bullish sign๐ก๏ธ๐ก๏ธ๐ก๏ธ For that reason, I expect another attempt to break through 7555 in the near future.
๐ป๐ชThe bearish scenario remains unchanged. If those moving averages are broken with strong momentum, the next key support levels become:
Support levels:
โข 7300 โ Local horizontal support
โข 7200 โ Area of the 1D EMA 100
โข 7000 โ Previous all-time high
Peace, everyone๐
โ ๏ธ Disclaimer:
All information shared on this channel is for educational and informational purposes only and should not be considered investment advice. The author is not responsible for your trading decisions. Always manage your risk and make your own independent decisions.
Germany DAX 40 ($DE40) 1H: Volatility CompressionGermany DAX 40 ( ICMARKETS:DE40 ) 1H: Volatility Compression Inside Major Rectangle Range โ Awaiting Institutional Breakout Trigger
### ๐ฉ๐ช Germany DAX 40 Index ( ICMARKETS:DE40 ) 1H Technical Brief (Ref: DE40_2026-07-14_08-35-55.png)
We are deploying a tactical short-term market study on the Germany DAX 40 ( ICMARKETS:DE40 ) on the 1-Hour (1H) time matrix. The European benchmark has locked into a highly structured **Rectangle Consolidation Range**, compressing aggregate volume between multi-day liquidity parameters.
The index displays quiet intraday balance today, trading up **+0.15% at 24,975.00**, anchored dead-center within this distribution block.
---
### ๐ The Range Architecture:
Our framework isolates two major structural boundaries governing current order flow:
1. **The 25,200 Supply Ceiling:** The upper boundary of the rectangle block (horizontal red line sitting at **25,153.69**) presents a massive technical wall for the bulls. This structural ceiling heavily confluences with the dynamic **200-period EMA (purple line at 25,152.03)**. Buyers have consistently faced aggressive institutional distribution at this boundary.
2. **The 24,770 Demand Floor:** Conversely, the lower boundary of the range (horizontal red line sitting at **24,814.69**) remains heavily defended. This support corridor is reinforced by a major long-term **Ascending Support Trendline (the red diagonal LTA)**, which has systematically absorbed sell-side flush sequences.
*The flat, horizontal alignment of our short-term **72-period SMA ribbons (orange line sitting at 25,038.35)** further mathematically validates this equilibrium phase.*
---
### ๐ Tactical Playbook: Patience and Boundary Confirmation
As long as the index remains trapped within this rectangle, localized price action remains highly random. Our systematic playbook advises standing aside and waiting for a clean institutional breakout sequence:
* **Bullish Breakout Scenario:** Requires a decisive 1H/4H candle close above **25,200** and the 200-EMA. Acceptance above this zone invalidates the range sellers and triggers a momentum squeeze toward the **25,450+** premium targets.
* **Bearish Breakdown Scenario:** A confirmed breach below the **24,770** baseline and the diagonal red LTA will signal an immediate breakdown of structural support, opening the door for an aggressive markdown leg into discount arrays below **24,550**.
### ๐ Trading Plan Summary:
* **Immediate Bias:** Strictly Neutral (Congestion Phase)
* **Overhead Resistance:** 25,150 โ 25,200 (Range Top & 200-EMA Confluence)
* **Downside Support:** 24,770 โ 24,815 (Range Bottom & Ascending LTA)
---
๐ **ChartPro Data**
*European Equity Architecture, Volume Compression Frameworks & Systematic Breakout Sourcing.*
โ ๏ธ **Disclaimer:** For educational and informational purposes only. This technical study represents a personal trading model and does not constitute financial or investment advice.
Renew blockade of Strait of Hormuz support for the US dollar.Renewed Middle East tensions have reignited inflation concerns as oil supply through the Strait of Hormuz halts again. Meanwhile, the latest US Strategic Petroleum Reserve stockpile fell to its lowest level since 1984, which may pressure the US to resolve the conflicts sooner.
Meanwhile, Fedโs Waller noted that the Fed should raise interest rates soon this month if inflation remains persistent. The swap market indicates that the odds of a rate hike this month have surged to 50%. However, today's CPI release may ease due to the recent decline in oil prices, but the market focuses more on the Core CPI figure, which gauges stable inflation factors. A stronger-than-expected Core CPI may further bolster rate hike expectations and provide additional support for the US dollar index.
Technically, the US dollar index broke above 101.2 and remains above this level with expanding EMAs, signaling potential further upside.
If the US dollar index breaches above 101.40, the price may advance to find resistance at 101.70.
Conversely, falling below 101.2 may prompt a decline toward the next support at 100.60.
By Van Ha Trinh - Financial Market Strategist at Exness
DAX 40: 25,000 Cracks Overnight - Sellers Gathering at 24,840While Europe slept, the world got louder. Iran shut the Strait of Hormuz, Washington answered with strikes, oil ripped 9% higher - and the DAX quietly gave back 25,000 in the overnight session. This morning's cash open delivered the verdict: no reclaim. Price is trading in the 24,900s and sellers are gathering at the last floor standing.
ONE STRAIT, ONE FLOOR
Roughly 20% of the world's oil moves through Hormuz - that is why a closed strait shows up in Frankfurt within hours. 25,000 survived four tests last week; the fifth came at 2 AM with nobody at the desk, and the open confirmed it: the round number is now the ceiling. Below sits 24,840, last Wednesday's drop low - the make-or-break. Above, 25,200 (the July 2 breakout shelf) is still the level that flips this structure bullish.
THE TRADE
Short on a 1H close below 24,840, stop above 25,000, target 24,636. Between 24,840 and 25,000 I do nothing - that pocket is where stops get eaten. If the market reclaims 25,000 and holds it, I stand aside. No trade is also a position.
WHERE I'M WRONG
Back above 25,200 and the top-out call is dead. No shame in that.
A BREAK AT 2 AM IS A CLAIM - DAYLIGHT IS THE VERDICT
Thin overnight liquidity breaks levels that the open sometimes takes straight back. That is why this idea waited for the cash open: the first thing Frankfurt did was sell the bounce. When fresh sellers show up in daylight to defend an overnight break, the break is real. This zooms into the floor from my daily map, "DAX: Back Above 25,000 After a 1,060-Point Dive". ()
I will update this idea as the levels get tested.
14.07.26 Daily ForecastPairs on Watch -
FX:NZDUSD : The daily timeframe showing two tweezer tops and failing to see gives great confluence for the longs, and we have a larger structure forming almost a 123 move to the upside where we can play that last part long. If the DXY does sell short term, we can look for a 1H stack here and filter to the 15M for a risk entry or reduce risk and manage into the high. In and out move in a way and knowing the DXY can change quickly.
FX:NZDJPY : We can see on the higher timeframe price has completed 90% of the previous structure to the left, it is at this point we see either a larger pullback or a change in direction. I am now looking for a 1H stack of price for the longs, as the potential V shape is not playing ball right now so the sells are not main focus. Filter to the 15M for a risk entry long.
FX:AUDUSD : This pair needs a little more development but could go under the radar playing the last leg of the larger ascending structure. With the idea of the DXY selling off short term, we could see a stack of price form here as a 123 move to complete the overall structure, an easy 3:1 in the last move if the DXY goes short.
U.S. Dollar Index (DXY) Bull Run Continues | 102.500 Target๐ DXY "U.S. DOLLAR INDEX" โ Index CFD Market Trade Opportunity Guide (Day/Swing Trade)๐น
Dear Ladies & Gentlemen โ Thief OG's, ๐
The vault doors are open again! ๐ The Greenback is flexing its muscle and the Thief Trader radar has locked onto DXY. Let's plan this heist with precision. ๐ฏ
โโโโโโโโโโโโโโโโโโโโโ
๐ PLAN: BULLISH SETUP
๐๏ธ Vault Zone (Entry):
You can enter the market at any price level โ flexible entry, thief style. No rush, no FOMO. ๐ฅท๐ฏ
Getaway Points (Targets):
Heads up Thief OG's โ a Police Force Zone (strong resistance) sits ahead, layered with overbought conditions + a potential trap/reversal risk. Escape with profits before the sirens go off! ๐จ
๐ฆ Main Getaway Target: @ 102.500
โก Day Trader Getaway 1: @ 101.500
โก Day Trader Getaway 2: @ 102.000
๐ Thief SL (Stop Loss):
@ 99.500
๐ Note: I'am not recommending you set only my TP/SL blindly โ that's your own call, Thief OG's. Make money, then take money, at your own risk. ๐ฐ
โโโโโโโโโโโโโโโโโโโโโ
๐ CORRELATED PAIRS TO WATCH ($-denominated)
๐ถ EUR/USD ($1.1360 zone): Inverse correlation โ EUR carries the heaviest DXY basket weight (~57.6%). A bullish DXY heist typically drags Fiber lower.
๐ท GBP/USD ($1.3350 zone): Inverse correlation โ Cable tends to slide when the Dollar squad flexes strength.
๐ด USD/JPY (ยฅ162.00 zone): Positive correlation โ Dollar strength + energy-driven yield spreads keep this pair climbing.
๐จ๐ญ USD/CHF ($0.8000+ zone): Positive correlation โ Swissy often tracks DXY's directional footprints closely.
๐ฅ XAU/USD ($4,000 zone): Inverse correlation โ Gold is the getaway rival; when Dollar robs the market, Gold usually pays the price.
โโโโโโโโโโโโโโโโโโโโโ
๐ FUNDAMENTAL & MACRO INTEL
๐๏ธ Fed funds rate steady at 3.50%โ3.75% since the June FOMC meeting โ first policy meeting under new Fed Chair Kevin Warsh.
๐ June CPI data is due for release today, following May's inflation print at a three-year high, driven largely by energy costs.
๐ฃ๏ธ Fed Chair Warsh is scheduled to testify before Congress this week, alongside several other Fed officials โ markets will parse every word for rate-path clues.
โ๏ธ Safe-haven flows remain active as Middle East tensions (US-Iran, Strait of Hormuz) continue to influence oil prices and broader risk sentiment.
๐ Rate-hike odds for the July 28โ29 FOMC meeting remain a live debate among market participants, with expectations shifting session to session based on incoming data.(This is a neutral snapshot of what the market is actually pricing โ not shaped to fit the trade direction above.)
โโโโโโโโโโโโโโโโโโโโโ
๐
UPCOMING HIGH-IMPACT EVENTS (London Time ๐ฌ๐ง)
๐ธ US CPI (June) โ Today, 13:30 London Time
๐ธ Fed Chair Warsh Congressional Testimony โ This week, ~15:00 London Time
๐ธ FOMC Interest Rate Decision โ 29 Jul, 19:00 London Time
โโโโโโโโโโโโโโโโโโโโโ
Thief Trader's Wisdom:
"A real thief doesn't chase the market โ he waits in the shadows for the market to walk into the trap." ๐
"Discipline is the mask that hides fear. Wear it every trade." ๐ญ
NAS100 H1 | Bullish Recovery AheadOn the 1-hour timeframe, NAS100 has shown a strong bullish reaction after sweeping liquidity from the 28,650โ28,700 Sell-Side Liquidity zone. The sharp rejection from this area confirms that institutional buyers stepped into the market, leading to a Market Structure Shift (MSS) and signaling that bearish momentum has weakened significantly.
Price has successfully reclaimed the broken descending trendline and is now trading above a series of higher lows, indicating that buyers are gradually taking control of the short-term market structure. The recent impulsive rally suggests that the market is attempting to retrace toward premium pricing, with the next objective being the nearby Order Block around 29,450โ29,500.
This Order Block is an important decision point. If buyers maintain momentum and secure a confirmed breakout above this level, the next upside target becomes the Strong Resistance & Higher-Timeframe Order Block (29,850โ29,950). This zone previously triggered a significant bearish reaction and is expected to attract fresh selling interest once price revisits it.
A successful breakout above the major supply zone would expose the psychological 30,000 resistance, opening the path toward the higher-timeframe Strong Order Block near 30,250โ30,350, where buy-side liquidity is likely resting. However, if price fails to hold above the current Order Block, a corrective pullback toward the 29,050โ29,100 Propulsion Order Block & Support Zone remains a healthy possibility before buyers attempt another continuation move.
From a Smart Money Concepts (SMC) perspective, the market has completed a sell-side liquidity sweep, confirmed multiple bullish Market Structure Shifts (MSS), and transitioned into a bullish retracement phase. The overall structure favors buyers as long as price continues respecting higher lows and remains above the reclaimed support zones.
Key Levels to Watch
๐ข Support Zone: 29,050โ29,100
๐ Current Order Block: 29,450โ29,500
๐ Strong Resistance & HTF Order Block: 29,850โ29,950
๐ฏ Psychological Resistance: 30,000
๐ Major HTF Order Block: 30,250โ30,350
Overall Bias
๐ H1 Bias: Bullish. The recent liquidity sweep, bullish MSS, and recovery above the descending trendline indicate increasing buying strength. A sustained breakout above 29,500 would increase the probability of a continuation toward 29,900, followed by the 30,000โ30,300 higher-timeframe supply zone.
TITLE THORA SHORT LIKHO
US500 (S&P 500) 4H โ Bearish Rejection | Macro + Technical ConflMacro Outlook:
The broader macro environment continues to support a cautious outlook for U.S. equities. Markets remain sensitive to higher-for-longer interest rate expectations, elevated Treasury yields, and uncertainty surrounding upcoming economic data. While the long-term trend remains constructive, the short-term macro backdrop favors defensive positioning and potential downside from key resistance.
Technical Outlook:
We are watching the US500 reject from a well-defined 4H supply zone after an impulsive rally. Price has returned to an area where sellers previously stepped in, making this a high-probability location for another bearish reaction.
As long as price remains below the supply zone, we expect sellers to maintain control with the potential for a move toward the next demand area around 7,430.
Trade Plan:
Bias: Bearish
Entry: 4H supply zone (current rejection area)
Stop Loss: Above 7,590
Take Profit: 7,430 demand zone
What We're Watching:
Bearish rejection candles within the supply zone.
Lower highs and lower lows confirming downside momentum.
Continued macro pressure from elevated yields and cautious risk sentiment.
Failure for buyers to reclaim the supply zone.
Risk Management:
We wait for confirmation before entering and always define our risk with a predetermined stop loss. A strong 4H close above the supply zone would invalidate the bearish setup and shift our short-term outlook to neutral.
NIFTY Weekly Expiry Outlook -14 JulyWeak global market sentiment suggests that Nifty could open with a gap-down.
Bullish Setup
If Nifty reclaims 24,100 and sustains above this level on a 15-minute closing basis, it may rally towards 24,160โ24,180. A strong breakout above this zone could extend the move to 24,220 and above.
Bearish Setup
If Nifty fails to hold the 24,020โ24,000 support zone, it may decline towards 23,940โ23,900. A decisive break below 23,900 could lead to further downside.
My View
With today being weekly expiry, volatility is expected to remain high throughout the session. While Gift Nifty points to a weak opening, the first hour is likely to determine the day's trend. I will wait for confirmation instead of predicting the direction, as expiry sessions often witness sharp reversals and short-covering rallies.
Trading Suggestion
Avoid taking trades immediately
after the opening bell. Let the first 15โ20 minutes pass and wait for a confirmed breakout or breakdown before entering. Trade with strict stop-losses, avoid chasing fast moves, and consider booking profits quickly, as option premiums can change rapidly on expiry day.
Trade the trend, not your prediction. Capital protection comes first.
Education purpose only and not financial advice.
S&P 500 & GOLD CORRELATIONDON'T BE FOOLED BY THE S&P 500! Here's the chart I shared with my students on our 'Q3 Market Breakdown' report. Let's go into a bit more depth regarding it & how the S&P 500 could front-run the big move on Gold for the next few months.
From my 'Elliott Wave Theory' strategy point of view, the S&P 500 is possibly due one more ATH (All-Time-High) to complete Wave V (Major Wave 5). So far we've seen the Major Wave 3 & 4 complete, with the final bullish cycle in progress.
Wave 5 so far has created - Wave I, II, III & IV with final bullish leg Wave V now in progress. Check chart annotations๐บ As this bullish leg moves higher, it is likely to drag Gold higher with it towards $4,800 - $5,040๐
Once the S&P 500 completes this bullish cycle & starts to decline, we could witness a 27% crash. Institutional investors will panic from this crash & needs fund to keep their losing positions from being liquidated. This'll lead to them selling off their Gold, which should drag Gold to its next major target of $3,800 or even $2,800๐
Nifty strategy for 14-07-2026Nifty may open on gap down note as per sgx nifty around at 24000 levels which is yesterday opening level in today morning session. coming to yesterday nifty opened around at 24000 at these level nifty took strong support and bounced back upto 24250 levels at these level profit booking occured and finally closed at 24211 by formed bullish candle on daily charts so I am expecting nifty may maintain 24000 levels in the short term until upto closed below 23800 levels on daily charts. India vix spiked 9% in yesterday traded around at 13 levels still it is favour to bulls so investors add positions around at opening levels and maintain keep stop loss at 23900 levels for the intraday.
Nifty trading levels :
Buy price : (opening price for risky traders)
: 23950(for safe traders)
stop loss : 23840
1st target : 24120
2nd target : 24250
stock of the day : Netweb technology
Buy price : (opening price for risky traders)
:(4320 for risky traders)
stop loss : 4200
1st target : 4420
2nd target : 4501
Disclaimer : I am not a SEBI Research Analyst please take advise from your financial advisor before take position based on my recommendation.
Thanking for your support if liked my content please suggest to your friends to follow my channel
Please drop a comment on whether my recommendation is useful and correct my mistakes
NAS100: Double Top Confirmed โ Can Bears Force a Flush?Here is a structured breakdown matching your selected title that you can copy and paste directly into your TradingView description box:
Overview
Following an aggressive multi-day rally, the NAS100 put in a local top just below the 29,900 mark. The index has now locked in a clean Double Top reversal pattern on the 4-hour timeframe.
The immediate breakdown past structural support has shifted control firmly to the sellers, opening up a clear path toward lower liquidity targets as momentum accelerates downward.
Key Technical Points
The Pattern Confirmation: The breakdown below the 29,321.8 ENTRY level officially validates the Double Top formation. This level has now successfully flipped from support to short-term resistance.
Momentum Breakdown: The Machine Learning RSI (Zeiierman) indicator tracked a stark lower high during the second peak, confirming a major shift in underlying momentum. The indicator line continues to slope sharply downward with no immediate signs of a bullish divergence.
Risk/Reward Parameters:
Invalidation / Stop Loss (SL): 29,431.1 (positioned safely above the recent localized structure breakdown)
Trading Scenarios to Watch
๐ป Bearish Case (Targeting Downside Liquidity): As long as price action remains capped underneath the broken entry line at 29,321.8, sellers remain completely in control. The immediate objective is a clean flush down to TP1 at 29,148.8 (Risk-to-Reward: 2), followed by a deeper extension toward TP2 at 28,975.8 (Risk-to-Reward: 4).
๐ Bullish Invalidation: For this short setup to fail, the bulls must force an aggressive, high-volume reclaim of the 29,321.8 pivot line to trap the breakout bears and shift structure back into a sideways consolidation.
Are you shorting this Nasdaq breakdown to the targets, or expecting a fakeout bounce? Let me know your bias below!