Market indices
Index collections
S&P500 Is it about to correct to 7000 minimum?The S&P500 index (SPX) has turned into a sideways consolidation for almost 2 months, putting a stop to the relentless 9 straight green weeks rally that preceded it. At the same time, the 1W RSI has been falling under Lower Highs pressure.
Every time we saw this RSI pattern since late 2021, the inde
21.07.26 Daily ForecastGood day everyone!!
No video forecast today due to being out of the door early to work, hopefully this should be the last day before fully resuming video forecasts as normal.
As you can see from previous forecasts with the DXY, we did get that move to the upside as expected. Now it is a question
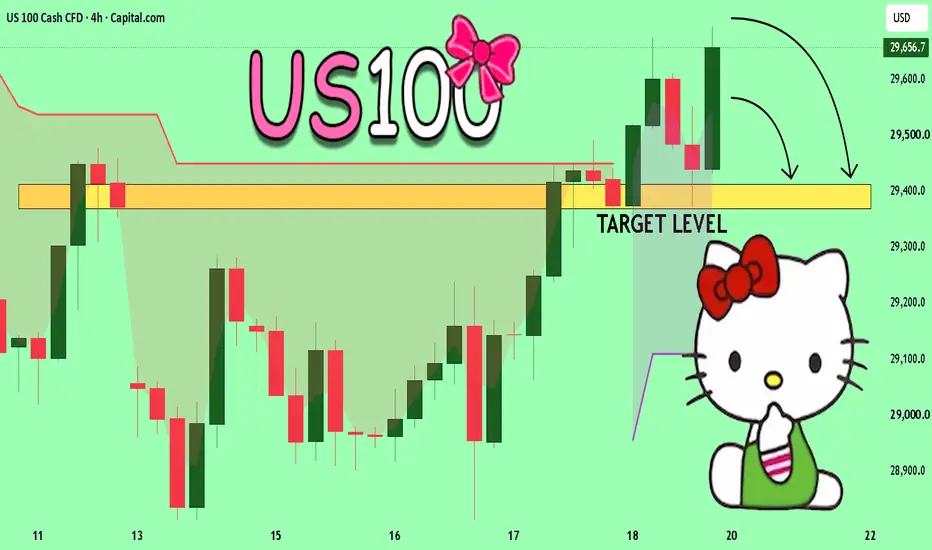
USNAS100 | Decision Zone Before Big Tech EarningsUSNAS100 | Decision Zone Before Big Tech Earnings
Markets are entering one of the most volatile weeks of the quarter, with earnings from major technology companies including Google and several other AI leaders expected to drive sentiment. Their results could determine whether the Nasdaq resumes its
S&P500 INDEX (US/500): Your Trading Plan ExplainedThe ⚠️S&P500 index is currently testing a horizontal structure that was recently breached. It is highly probable that this level has now become support.
For a confirmed buying opportunity, please observe the formation of a double bottom pattern on the 4-hour chart.
Should the price break and close
NAS100 — Daily FVG Short Into Monthly DrawStill trading inside a bearish structure — lower highs holding since the June peak.
The daily FVG at 29,061–29,235 is the entry POI. Price retraces into unfilled inefficiency, sellers step back in.
Target is the monthly low at 28,202. That level isn't just external range liquidity — there's a mont
*US TECH 100 BULLISH REVERSAL FROM KEY SUPPORT — TARGET 29,296**
US Tech 100 has formed a strong bullish rebound after testing the **28,400 major support zone**. The price has recovered from the recent sell-off and is now showing increasing buying momentum. A sustained move above the **29,000 psychological level** could open the way toward the marked **29,296 ta
DXY Bullish Recovery from Support – Eyes on 101.02 Resistance
The **U.S. Dollar Index (DXY)** is showing signs of a potential bullish recovery after finding strong support around the **100.45–100.50** demand zone. Price recently bounced from this key support area and is attempting to stabilize above the **100.70** level.
Although the broader trend has been b
FTSE 100 Bearish Setup
Price has rejected from the upper boundary of the 4H range/resistance zone.
The rejection also coincides with a potential rising wedge / Head & Shoulders breaking to the downside.
Stochastic has a bearish cross following the rejection, suggesting momentum may be shifting lower.
See all popular ideas
Frequently asked questions
An index is a financial instrument that measures the performance of underlying assets or tracks other financial data. Some indices are designed to provide a broad view of the market, while others focus on tracking a particular sector of the economy. Indices give traders an instant snapshot of market sentiment with a rising index suggesting optimism about the economy and a declining index signaling uncertainty.
For example, the S&P 500 Index (SPX) tracks the performance of 500 large publicly traded companies in the United States, while the US consumer price index (CPI) measures US inflation and deflation.
Usually, indices are expressed in points, but some, like the S&P 500, can be expressed in the national currency.
With TradingView, you can follow all indices in one place.
For example, the S&P 500 Index (SPX) tracks the performance of 500 large publicly traded companies in the United States, while the US consumer price index (CPI) measures US inflation and deflation.
Usually, indices are expressed in points, but some, like the S&P 500, can be expressed in the national currency.
With TradingView, you can follow all indices in one place.
Indices are used to track assets or financial data, so they're not designed for trading, but some financial instruments linked to indices can be traded on exchanges. They include mutual funds, exchange-traded funds (ETFs), index futures, contracts for difference (CFDs), and options on indices.
We recommend conducting a thorough analysis before settling with any of these instruments: explore indices ideas and forecasts and then select a reliable brokerage on TradingView. Once you open an account, you'll be all set to start investing in indices.
The main global indices that investors and traders track include the S&P 500, FTSE 100, Dow Jones, and more.
For your convenience, we have a list of all major indices in one place — analyze their stats to conduct a well-rounded analysis.
Stock market indices are mainly used to gauge the health of a particular sector of the world economy. For example, as one of the main global indices, the S&P 500 (SPX) provides investors and traders with insight into the health of the US economy. Another reputable index, the DAX Index, helps assess the performance of German blue-chip companies. It is one of the primary indicators of Germany's economic health in particular and, more broadly, the EU's economic health.
Today, CAC 40 is 8,363.14 . It has decreased by 1.30% over the past month. DAX is 25,011.35 (0.26% down since last month) while FTSE 100 is 10,585.91 GBP (1.78% up since last month).
For the broader outlook, we have a list with indices of the European countries.
As of today, the S&P 500 stands at 7,511.21 , showing a 0.32% increase over the past month. Dow Jones is currently at 52,317.54 , reflecting a 1.45% increase during the same period. Meanwhile, Nasdaq 100 has reached 29,171.11 , marking a 3.60% decrease compared to the previous month.
For the broader outlook, we have a list with all indices in one place.
The Standard and Poor's 500 (SPX) is one of the most reputable indices, tracking the performance of 500 largest publicly traded US-based companies. It represents approximately 80% of the total US equity market capitalization, making it the prime indicator of the US economy's health.
Today, the SPX is 7,511.21 , it has increased by 0.32% over the past month.
On TradingView, you can track SPX components and watch the SPX chart to stay on top on index dynamics.
Today, the SPX is 7,511.21 , it has increased by 0.32% over the past month.
On TradingView, you can track SPX components and watch the SPX chart to stay on top on index dynamics.
The Dow Jones, or just the Dow, is short for the Dow Jones Industrial Average Index (DJI). It is one of the most reputable indices, tracking the performance of 30 blue-chip US stocks. All of them are stable and trusted companies boasting a long history of weathering the market under different circumstances, from gains during bull runs to surviving global economic crises.
Today, the DJI is 52,317.54 , it has increased by 1.45% over the past month.
On TradingView, you can track DJI components and watch the DJI chart to stay on top of index dynamics.
Today, the DJI is 52,317.54 , it has increased by 1.45% over the past month.
On TradingView, you can track DJI components and watch the DJI chart to stay on top of index dynamics.
An index fund is a financial instrument that tracks the performance of a financial index. Since indices cannot be bought as they are, index funds can have different structures that provide investors with exposure to the identical price fluctuations of a given set of stocks.
For example, an index fund can hold the exact stocks in a proportion similar to the index's initial weight, given to each stock. Therefore, as the index changes, a well-structured index fund would change by the same value.
To gain insight into market indices, explore our community ideas on indices.
For example, an index fund can hold the exact stocks in a proportion similar to the index's initial weight, given to each stock. Therefore, as the index changes, a well-structured index fund would change by the same value.
To gain insight into market indices, explore our community ideas on indices.