Short
Short
 Long
Long
Long 
Short 
EGX30 vs US Real Yields: Fed Impact on ThursdayThe Fed decision today isn't really about a 25 bp hike — the market has largely priced it in. The real question: what happens to US real yields after the decision?
📊 US MACRO SNAPSHOT
- Jobs: +162K in August vs 53K expected. Unemployment steady at 4.1%.
- Inflation: headline CPI 3.4%, but mostly energy-driven — gasoline is up ~27% YoY. Core CPI is 2.4%, the lowest since 2021, though the monthly core reading came in hotter than expected.
- Retail sales (released today): +1.2% vs +0.8% expected; control group +1.4% vs +0.4%.
Bottom line: the US consumer is still spending, and inflation remains above target because of oil. That puts the Fed in a tough spot.
🔍 THE INDICATOR I'M WATCHING: DFII10
DFII10 is the 10-year US Treasury real yield — the return after expected inflation.
- 2.60% (Sep 14 close), up from 2.43% a week earlier.
- The nominal 10Y closed at 5.00% on Sep 15, its highest close since 2007.
Key point: 10Y breakeven inflation is roughly flat near 2.4%. Yields are not rising on inflation fears — real yields themselves are climbing. That is the most painful type of tightening for emerging markets.
When global investors can lock in a high real return in a near-risk-free dollar asset, they demand more to take equity and EM risk. Result: pressure on valuations, cautious foreign flows, and tighter financing.
🎯 WHAT'S PRICED IN?
- Futures price ~90% odds of a 25 bp hike to 3.75%–4.00% — the first hike since July 2023.
- Reuters poll (Sep 14): 86 of 101 economists expect a hike tonight; 37 of 70 expect at least one more by end-March 2027.
- The previous poll had 65 of 93 expecting a hold.
- Bank of America expects 3 hikes; futures price roughly 4 hikes through July 2027.
🏦 WARSH & THE FED
- July: the Fed held 9–3, with three dissenters favoring a hike.
- Jackson Hole: Warsh said he doesn't like giving markets advance commitments — something I appreciate — but also said the Fed "has work to do" if core inflation isn't falling fast enough. Hike odds jumped from 34% to 57% afterward.
🏛 POLITICAL PRESSURE
The White House says a hike isn't necessary. That argues for a hold, not a cut — cuts aren't in current pricing.
My personal view: cuts could return to the table later if the labor market weakens clearly, oil drops sharply, or 5%+ yields start hurting financing conditions — especially since Warsh himself has argued AI will pull inflation down.
Even a hold tonight carries risk: Deutsche Bank says it would be the biggest dovish surprise at a scheduled meeting since 1994. If read as political capitulation, long-end yields could rise instead of fall.
💭 MY VIEW
Anything above 25 bp looks very unlikely — it would be an unnecessary shock.
The real surprises are more likely in:
- The dot plot: June signaled one hike in 2026. An additional hike would confirm a tightening cycle.
- Number and direction of dissents, plus updated economic projections.
Note: the October meeting falls just before the US midterms, so the Fed will likely avoid any move then — hike or cut — to avoid looking political.
🔀 POST-DECISION SCENARIOS
1️⃣ Hike 25 + DFII10 stable/falling → best case; supportive for EM and EGX.
2️⃣ Hike 25 + hawkish tone + DFII10 holds above 2.50% → pressure; cautious liquidity.
3️⃣ Surprise hold → initial rally that may fade if seen as soft on inflation.
4️⃣ Hike 50 → very unlikely, clearly negative shock.
📈 WHY IT MATTERS FOR EGYPT
The Central Bank of Egypt held its deposit rate at 19% in August. Every US hike narrows the rate differential that attracts foreign investors into Egyptian T-bills.
And it's not just the Fed: the ECB has hiked, and the BoJ is expected to lift rates to a 31-year high — more competition for EM-bound liquidity.
The EGX is closed at decision time, so the first reaction comes in Thursday's session, the last before the weekend. Tonight's move in yields and the dollar will shape the setup before the open.
✅ WHAT TO WATCH AFTER THE DECISION
- DFII10: back below 2.50%, or holding above?
- US10Y: sustaining above 5%?
- DXY: at 99.7 — the key signal is a break above 100.
- Brent: ~$106–108.
Easing in these = breathing room for EM. Holding above these levels = pressure persists.
What happens in America doesn't stay in America.
⏰ Decision: 2:00 PM ET (18:00 UTC). Press conference: 2:30 PM ET.
Data as of Sep 16, 2026, before the decision.
Educational content, not investment advice.  Long
Long
Why Bond Yields Matter to Every TraderThe bond market is sending a message that is becoming increasingly difficult to ignore. The US 10-year Treasury yield has climbed to around 5%, pushing through its previous peak and back to levels last seen in 2023.
For those of us trading the S&P 500, gold or EUR/USD, it might be tempting to leave the bond market to the bond specialists. But yields feed directly into the environment these markets trade in, affecting equity valuations, the opportunity cost of holding gold and the relative-rate expectations behind currencies.
The useful part isn't trying to predict where bond yields go next. It's understanding what a move in yields means for the markets we actually trade, and knowing that the answer is different for each one.
Start with the yield
The US 10-year gives us a useful starting point. Yields have been trending higher for much of this year, but the latest acceleration has taken them through the previous peak and back to the highs reached in 2023.
Fiscal concerns, persistent inflation pressures and the outlook for government borrowing have all played a role. For our purposes, however, the more useful question is what other markets are doing in response.
US 10-year Treasury yield daily candle chart
Past performance is not a reliable indicator of future results
Bond prices and yields move in opposite directions, so rising yields reflect falling prices and a higher return being demanded by the market. But that doesn't give us a universal risk-off signal. The information yields provide depends on which market we're analysing, what is driving the move and, crucially, how price is responding.
Equities: think discount rate
For equities, one of the main transmission mechanisms is the discount rate. A share price reflects the value investors place on a company's future cash flows, and when longer-term interest rates rise, the rate used to discount those future cash flows also increases. All else being equal, that reduces their value today.
The effect can be particularly relevant for growth companies, where a greater proportion of the valuation may depend on earnings expected further into the future. Rising government bond yields also increase the return available from comparatively lower-risk assets, raising the hurdle equities have to clear.
The mistake is turning that relationship into a simple rule that says rising yields must mean falling share prices.
S&P 500 daily candle chart
Past performance is not a reliable indicator of future results
The current S&P 500 chart shows why. Treasury yields have climbed to multi-year highs, yet the index has remained relatively resilient. Price has pulled back from its recent peak and short-term momentum has softened, but it is only now testing the combination of its previous breakout area and rising 50-day moving average.
If a potential headwind is strengthening but the market refuses to deteriorate significantly, we shouldn't simply assume price must eventually conform to the textbook relationship. Strong economic growth, earnings expectations and risk appetite can all compete with the effect of higher yields.
Instead, we can turn the relationship around and ask how well the equity market is absorbing the rise in yields. Sometimes the response to a headwind tells us more than the headwind itself.
Gold: think real yields
Gold requires a slightly different approach. Unlike government bonds, gold doesn't produce an income stream, so as the return available from interest-bearing assets increases, the opportunity cost of holding a non-yielding asset can rise with it.
Gold daily candle chart
Past performance is not a reliable indicator of future results
Gold has pulled back from its recent swing high and is now testing its rising 50-day moving average, but that price action cannot simply be attributed to the rise in nominal Treasury yields. For gold, real yields can often provide the more useful comparison because they adjust the return available from bonds for expected inflation.
The distinction matters. If nominal yields are rising largely because inflation expectations are increasing, the change in the inflation-adjusted return available from bonds may be much smaller. A rise in real yields creates a more direct increase in the opportunity cost associated with holding gold.
Even then, we shouldn't expect a perfect relationship. The dollar, geopolitical risk, central-bank demand and wider risk appetite can all influence gold at the same time. Yields provide another layer of context rather than a standalone signal.
Currencies: think relative yields
EUR/USD has also weakened as US yields have pushed higher, with the pair extending its recent decline and returning towards its rising 50-day moving average. It would be tempting to connect those two moves directly, but currencies require another adjustment to our framework.
EUR/USD daily candle chart
Past performance is not a reliable indicator of future results
EUR/USD represents the relative value of two currencies, so a move in US yields becomes more useful when compared with what is happening to yields and interest-rate expectations in the euro area.
If US yields rise faster than comparable European yields, the relative return available from dollar-denominated assets can become more attractive. If yields on both sides are moving together, the change in the relative-rate picture may be much smaller.
The same principle applies across FX. Rather than asking whether US yields are simply rising or falling, we want to understand how the rate backdrop is changing relative to the other side of the currency pair and then judge how price responds.
One move, three different questions
Bond yields aren't a shortcut for predicting what equities, gold or currencies will do next. Their value comes from helping us understand the environment in which those markets are trading.
For the S&P 500, we can ask how equities are responding to a changing discount-rate backdrop. For gold, we can focus more closely on real yields and the opportunity cost of holding a non-yielding asset. For EUR/USD, the emphasis shifts towards relative yields and how the US rate backdrop compares with Europe.
The recent move in the US 10-year has made those relationships difficult to ignore, but the framework remains useful long after the current move has played out. Bond yields aren't a trading signal. They are another part of the market helping us understand what our trades are up against.
Disclaimer: This is for information and learning purposes only. The information provided does not constitute investment advice nor take into account the individual financial circumstances or objectives of any investor. Any information that may be provided relating to past performance is not a reliable indicator of future results or performance. Social media channels are not relevant for UK residents.
Spread bets and CFDs are complex instruments and come with a high risk of losing money rapidly due to leverage. 89% of retail investor accounts lose money when trading spread bets and CFDs with this provider. You should consider whether you understand how spread bets and CFDs work and whether you can afford to take the high risk of losing your money.
 Long
Long
Long 
Short 
NASDAQ 100 at Key Support as Fed Rate Decision LoomsAhead of the FOMC’s interest rate decision, the NASDAQ 100 is in a vulnerable position, trading near a key technical support level that could be tested by the Fed’s communication, or lack thereof. If the Fed raises rates as the market expects and signals a more hawkish path, the NASDAQ 100 could fall below support at around 28,950, potentially retreating to its July lows.
The chart also shows what appears to be a descending triangle, a bearish pattern that, with follow-through, could see the NASDAQ 100 break below support. Meanwhile, the RSI has been trending lower, indicating that momentum has turned bearish.
The path higher for the NASDAQ 100 looks more challenging now and would likely require a dovish surprise from the Fed. If the Fed holds rates steady and signals it is willing to give inflation more time before raising rates, the NASDAQ 100 could surge above its 50-day moving average, breaking the downtrend and invalidating the descending triangle. In that scenario, the index could return to all-time highs.
The challenge is that the market is assigning roughly a 90% chance of a Fed rate rise in September, while also pricing in multiple increases over the next several months. This suggests that, if the Fed does raise rates, the market does not expect it to be a one-off.
Written by Michael J. Kramer, founder of Mott Capital Management.
Disclaimer: CMC Markets is an execution-only service provider. The material (whether or not it states any opinions) is for general information purposes only and does not take into account your personal circumstances or objectives. Nothing in this material is (or should be considered to be) financial, investment or other advice on which reliance should be placed.
No opinion given in the material constitutes a recommendation by CMC Markets or the author that any particular investment, security, transaction, or investment strategy is suitable for any specific person. The material has not been prepared in accordance with legal requirements designed to promote the independence of investment research. Although we are not specifically prevented from dealing before providing this material, we do not seek to take advantage of the material prior to its dissemination.
Short 
US30: Bullish Harmonic Setup at Key Support ZoneUS30: Bullish Harmonic Setup at Key Support Zone
US30 has completed a potential bullish harmonic structure, with price now approaching the D point around the 51,800–52,000 area.
The reaction from this zone was important. The buyers are defending the D-point region and looks like US30 already started a recovery toward the marked resistance levels.
The first target is around 52,730, followed by 53,340. If momentum remains strong and the higher resistance is cleared, the next target sits near 54,090.
The setup remains dependent on price holding the current reversal area. A sustained move below the D-point structure would weaken the bullish scenario and invalidate the projected path.
Key levels:
🎯 52,730
🎯 53,340
🎯 54,090
You can find more details on the chart.
Thanks! 🍀
⚠️PS: Do your own analysis and use your own strategy to join the trade.
❤️ If this analysis helps your trading day, please support it with a like or comment ❤️
 Long
Long

US30 vs 52,700: BREAKOUT OR TRAP? | Dow Jones Battle Zone🏴☠️💰 US30 / DJI30 — Dow Jones Industrial Average Index CFD
🎯 "THE WALL STREET VAULT HEIST" — Day Trade / Swing Trade Market Opportunity Guide
━━━━━━━━━━━━━━━━━━━━━━━━━━━━━━━━━━━━━━
📸 LIVE MARKET SNAPSHOT — 16 September 2026 (London/BST Time)
━━━━━━━━━━━━━━━━━━━━━━━━━━━━━━━━━━━━━━
🔹 US30 / DJI30 (Dow Jones Industrial Average Index CFD) — ~52,100 area (following Tuesday's 322-point sell-off; 52-week range: 45,057 — 54,744)
🔹 US500 (S&P 500 CFD) — ~7,601 pts (down ~0.4% on Tuesday; 52-week high: 7,817)
🔹 US100 (NASDAQ 100 CFD) — ~29,580 area (rejection near 29,600–29,650 resistance)
🔹 DXY (US Dollar Index) — ~99.72 (strengthening, up 5 consecutive sessions ahead of Fed decision)
🔹 XAU/USD (Gold CFD) — ~$4,290/oz (lowest since early August; pressured by strong USD & surging yields)
🔹 WTI Crude Oil — ~$103.52/bbl (Saudi East-West pipeline offline; Middle East supply disruption driving prices)
🔹 US 10-Year Treasury Yield — ~5.02% (highest since July 2007; bond selloff intensifying)
🔹 US 30-Year Treasury Yield — ~5.36%
⚡ NOTE: Live data is CFD-based — prices may vary slightly by broker/provider. Always verify on your own platform before executing.
━━━━━━━━━━━━━━━━━━━━━━━━━━━━━━━━━━━━━━
🧠 MY ANALYSIS — READING THE MARKET LIKE A MASTER THIEF
━━━━━━━━━━━━━━━━━━━━━━━━━━━━━━━━━━━━━━
The Dow Jones Industrial Average (US30 / DJI30) is one of the most closely watched Blue-Chip equity indices on the planet — 30 powerhouse companies, one legendary index, and right now the price action is sitting at a crucial technical crossroads.
After trading within its 52-week range of 45,057 to 54,744, the index pulled back sharply on Tuesday, shedding 322 points to close near the 52,099 zone. The losses were broad-based across cyclical and tech-exposed names, with the broader market reacting to elevated Treasury yields, sticky inflation, a surging US Dollar, and a dominant Fed rate-hike narrative heading into today's FOMC decision.
The 10-year Treasury yield cracking above 5.00% for the first time since 2007 is a historic macro signal. Rising bond yields increase the opportunity cost of holding equities — money rotates from stocks into bonds — which creates structural headwinds for indices like the US30 / DJI30 when yields spike aggressively. Yet historically, well-structured resistance breakouts on strong institutional demand can override short-term yield pressure, particularly when macro data paints a dual narrative.
The heist we're mapping out today requires patience at the gate — the plan only activates on a confirmed resistance breakout. No breakout, no entry. Discipline is the edge that separates thieves from tourists in these markets.
━━━━━━━━━━━━━━━━━━━━━━━━━━━━━━━━━━━━━━
📊 MY MARKET BIAS — THE DIRECTIONAL CALL
━━━━━━━━━━━━━━━━━━━━━━━━━━━━━━━━━━━━━━
🟢 BIAS: BULLISH — Conditional on Resistance Breakout
The Thief Trader's market bias on US30 / DJI30 is leaning BULLISH — but strictly conditional. The setup requires a confirmed and sustained breakout above the key resistance level at 52,700. Until price clearly clears and closes above that level with volume confirmation, this trade plan sits in standby mode.
A clean breakout above 52,700 opens the road toward the first vault at 53,700, with the main vault and final target sitting at 54,500. That upper zone coincides with a powerful technical structure — an area where overbought momentum, strong historical resistance, and potential institutional distribution (smart money traps) converge — which is exactly why we're planning our exit strategy there.
The Thief OG's know the play: enter cleanly, take profits systematically, and never overstay your welcome near the "police force" resistance.
━━━━━━━━━━━━━━━━━━━━━━━━━━━━━━━━━━━━━━
🎯 THE HEIST PLAN — OPERATION WALL STREET VAULT
━━━━━━━━━━━━━━━━━━━━━━━━━━━━━━━━━━━━━━
🔫 ENTRY TRIGGER — WAIT FOR THE BREAKOUT:
→ Entry Level: Resistance Breakout @ 52,700
→ Do NOT chase the price. Let the market come to you. Once 52,700 breaks and holds, that is your green light to execute the heist. Use a Buy Stop order above 52,700 or wait for a confirmed candle close above on your preferred timeframe before entering.
🏦 TARGET VAULTS — WHERE THE GOLD IS:
→ 🥇 1st Target (First Vault): 53,700
— Take partial profits here. Lock in a portion of the haul. Smart thieves always secure a bag before reaching the main vault.
→ 🏆 Main / Final Target (2nd Vault): 54,500
— This is the BIG vault. At 54,500, the police force is active — a historically significant resistance zone where overbought conditions, institutional distribution, smart money traps, and potential reversal signals all converge. The plan is to reach this zone and ESCAPE with profits. Do not get greedy. The best thieves always know when to run.
⚠️ Dear Ladies & Gentleman (Thief OG's) — I am NOT recommending you to set only my TP levels as your mandatory exit. It is your own choice — you can make money, then take money at your own risk and your own judgment. These are reference vaults, not financial gospel.
🛡️ STOP LOSS — THE ESCAPE HATCH:
→ Thief SL: 52,000
→ Placed below the key support structure and the breakout zone, designed to protect capital if the breakout fails or reverses sharply.
⚠️ Dear Ladies & Gentleman (Thief OG's) — I am NOT recommending you to set only my SL as the only option. It is your own choice — you can manage your risk, use trailing stops, or hedge positions at your own discretion and your own risk. Trade smart, protect the vault.
━━━━━━━━━━━━━━━━━━━━━━━━━━━━━━━━━━━━━━
👁️ AREAS I AM WATCHING — THE THIEF'S SURVEILLANCE ZONES
━━━━━━━━━━━━━━━━━━━━━━━━━━━━━━━━━━━━━━
🔍 Key Levels Under the Thief Trader's Watch:
→ 📌 52,700 — The breakout trigger zone. Above this level, bulls take control.
→ 📌 52,099 — Tuesday's close / current consolidation pivot.
→ 📌 52,000 — Thief SL zone. Structural support. If this fails, the trade is off.
→ 📌 51,875 — 52-week intraday recent low. Critical demand zone.
→ 📌 53,700 — First vault / intermediate resistance. Partial profit zone.
→ 📌 54,500 — Main vault. Police force resistance zone. Overbought + reversal trap territory.
→ 📌 54,744 — 52-week high. Absolute ceiling reference. A break above here would be historically significant.
🔥 The FOMC Interest Rate Decision (Today, 16 September 2026 at 19:00 BST / 14:00 ET) is the single biggest volatility trigger for this trade. Expect sharp index movement following the announcement. Size appropriately and manage risk around this event.
━━━━━━━━━━━━━━━━━━━━━━━━━━━━━━━━━━━━━━
🔗 CORRELATED PAIRS & ASSETS TO WATCH
━━━━━━━━━━━━━━━━━━━━━━━━━━━━━━━━━━━━━━
Understanding correlated markets gives the Thief Trader a 360-degree view of the battlefield. Watch these alongside US30 / DJI30:
📊 US500 (S&P 500 CFD) — ~7,601 pts
→ The S&P 500 and US30 / DJI30 move in near-lockstep during broad risk-on / risk-off events. A strong US500 breakout above recent resistance confirms a favorable environment for a US30 / DJI30 bullish breakout. Watch for alignment.
📊 US100 (NASDAQ 100 CFD) — ~29,580 pts
→ The tech-heavy NASDAQ 100 leads momentum. If US100 breaks out above 29,600–29,650 resistance, it signals renewed risk appetite that historically provides tailwind fuel for US30 / DJI30. Currently showing rejection near this zone — a key signal to monitor for confirmation or failure.
💵 DXY (US Dollar Index) — ~99.72
→ INVERSE correlation with US30 / DJI30 in risk-off environments. A strengthening Dollar puts pressure on equity indices as investors reposition. If the Fed hike is fully priced in and the Dollar begins to pull back post-FOMC, it would be a bullish unlock for the Dow.
🥇 XAU/USD (Gold CFD) — ~$4,290/oz
→ Gold and equities compete for safe-haven flows. Gold is currently under pressure from rising yields and a strong Dollar. If gold stabilizes and risk appetite returns post-Fed, equity flows may increase — a secondary confirmation signal for the US30 / DJI30 breakout.
🛢️ WTI Crude Oil — ~$103.52/bbl
→ Elevated oil prices (~$100+ per barrel) are a double-edged sword. Energy sector names (Chevron, ExxonMobil) inside the Dow get a lift from high oil prices, providing some structural support. However, energy-driven inflation increases the risk of further Fed tightening, which is a headwind for the broader index. Watch oil direction closely — sustained oil above $105–$110 could reignite inflation fears and weigh on the bulls.
━━━━━━━━━━━━━━━━━━━━━━━━━━━━━━━━━━━━━━
🌍 FUNDAMENTAL & MACRO FACTORS — WHAT THE MARKET IS ACTUALLY SAYING
━━━━━━━━━━━━━━━━━━━━━━━━━━━━━━━━━━━━━━
The Thief Trader keeps the fundamentals section strictly neutral — the market data speaks for itself. Here is what is actually driving price right now, without filtering it to suit any directional bias:
🟢 BULLISH DRIVERS FOR US30 / DJI30:
✅ Strong Corporate Earnings Base — Dow component companies including Chevron (+2.53%), 3M (+1.75%), and JPMorgan (+1.11%) showed resilience even on Tuesday's broadly bearish session.
✅ 52-Week Range Context — At ~52,099, the index trades well above its 52-week low of 45,057, maintaining a structurally positive longer-term trend above major moving average zones.
✅ Energy Sector Uplift — Elevated oil prices near $103–$105 per barrel provide direct earnings support to energy-heavy Dow components, offering a partial earnings buffer.
✅ Dollar Stabilization Risk — If the FOMC decision today (16 September 2026, 19:00 BST) is fully priced as expected and Chair Warsh delivers a "one and done" tone rather than signalling aggressive further hikes, a Dollar pullback could trigger equity inflows.
✅ Post-FOMC Historical Tendency — Historically, US equity indices tend to recover and rally in the sessions following an expected and well-communicated rate hike, as uncertainty removes itself from the market.
🔴 BEARISH DRIVERS FOR US30 / DJI30:
⚠️ Fed Rate Hike Risk — Today's FOMC meeting (16 September 2026) carries approximately a 92–93% market-implied probability of a 25 basis point rate hike, lifting the federal funds rate to 3.75%–4.00%. Higher rates increase borrowing costs for Dow companies and shift investor preference toward fixed income.
⚠️ 10-Year Treasury Yield at 5.02% — Yield at the highest level since July 2007. At this level, bonds begin to offer attractive returns that compete directly with equity dividend yields, pulling capital allocation away from stocks.
⚠️ Headline CPI at 3.4% (August 2026) — Annual inflation remained elevated and sticky, unchanged from July, driven largely by energy costs. Core CPI at 2.4% annually — still well above the Fed's 2% target.
⚠️ Brent Crude at ~$107.50/bbl, WTI at ~$103.52/bbl — Middle East supply disruption from Saudi Arabia's East-West pipeline closure and Houthi activity near the Strait of Bab el-Mandeb continues to fuel energy inflation.
⚠️ Broad Market Weakness — US stocks fell on Tuesday (S&P -0.4%, Dow -322 points, NASDAQ -0.6%) driven by the combination of rising Treasury yields, geopolitical risk, and FOMC uncertainty. Selling pressure was led by Nike (-2.35%), Alphabet (-2.28%), and Amazon (-2.00%).
⚠️ Dollar Strength (DXY ~99.72) — Five consecutive sessions of Dollar appreciation creates headwinds for USD-denominated assets and multinational earnings within Dow components.
━━━━━━━━━━━━━━━━━━━━━━━━━━━━━━━━━━━━━━
📅 ECONOMIC CALENDAR — HIGH IMPACT EVENTS (LONDON/BST TIME)
━━━━━━━━━━━━━━━━━━━━━━━━━━━━━━━━━━━━━━
🔥 TODAY — Wednesday, 16 September 2026:
→ 13:30 BST — US Advance Monthly Retail Sales (August 2026) 🔴 HIGH IMPACT
→ 19:00 BST — FOMC Interest Rate Decision + Summary of Economic Projections + Dot Plot 🚨 EXTREME IMPACT
→ 19:30 BST — Fed Chair Kevin Warsh Press Conference 🚨 EXTREME IMPACT
🔥 TOMORROW — Thursday, 17 September 2026:
→ 12:00 BST — Bank of England (BoE) MPC Rate Decision 🔴 HIGH IMPACT
(Current Bank Rate: 3.75% | 30% probability of hike to 4.00% | MPC voted 6-3 to hold in July)
→ Ongoing — Middle East geopolitical developments & crude oil supply risk 🔴 ONGOING HIGH IMPACT
⚡ Upcoming Further Dates:
→ 27–28 October 2026 — Next FOMC Meeting
→ 5 November 2026 — Next BoE MPC Meeting (with quarterly Monetary Policy Report)
→ 8–9 December 2026 — Final FOMC Meeting of 2026
→ 14 October 2026 — US CPI September 2026 Release (08:30 ET / 13:30 BST)
━━━━━━━━━━━━━━━━━━━━━━━━━━━━━━━━━━━━━━
📚 EDUCATIONAL BREAKDOWN — MASTER THE CRAFT, THIEF OG'S
━━━━━━━━━━━━━━━━━━━━━━━━━━━━━━━━━━━━━━
🎓 Lesson from the Vault: Understanding Resistance Breakout Trades on Index CFDs
Trading a resistance breakout on a major equity index like the US30 / DJI30 is one of the most powerful technical setups available — but also one of the most frequently faked by the market. Here's the Thief Trader's breakdown of what makes this setup work, and what to watch out for:
🔑 What is a Resistance Breakout?
A resistance level is a price zone where sellers have historically overwhelmed buyers, causing price to reverse or stall. When price eventually breaks above that level with momentum and volume, it signals that buyers have absorbed all the selling pressure — and the resistance flips into new support. This is the "crack in the vault door" moment.
🔑 Why 52,700 is the Key Level Here:
This level has acted as a structural ceiling where sellers defended aggressively in recent sessions. A clean close above 52,700 signals that institutional buyers are stepping in with intent. Without that confirmation, price is merely approaching resistance — not breaking it.
🔑 Volume Confirmation:
Strong breakouts are typically accompanied by above-average volume. On index CFDs, watch for expansion in trading interest across correlated futures (Dow Jones Futures / YM) as additional confirmation.
🔑 The "Police Force" Concept (Thief Trader Edition):
Near the 54,500 zone — our main vault — the technical picture shifts dramatically. Multiple resistance levels, a historically overbought RSI zone, and the proximity to the 52-week high at 54,744 make this an area where institutional sellers (the "police force") are likely to defend aggressively. Smart money often distributes positions near highs, trapping late-entry retail buyers. This is why the plan calls for taking profits at this zone — not holding blindly through it.
🔑 Why Treasury Yields Matter for Index Traders:
When the US 10-year Treasury yield rises above 5% (as it did on 15 September 2026), equity traders must pay attention. Higher yields make risk-free government bonds more attractive relative to stocks. If the equity risk premium (the extra return stocks offer over bonds) shrinks, institutional money rotates. Index traders who understand this relationship trade with a significantly sharper edge.
🔑 Managing Risk Around FOMC Events:
Major central bank decisions like today's FOMC announcement at 19:00 BST typically cause sharp, fast-moving price action with expanded spreads. Experienced traders often reduce position sizes going into announcements, wait for the initial volatility spike to settle, and then re-evaluate the breakout level with the new information in hand. Never size up into an unknown event.
━━━━━━━━━━━━━━━━━━━━━━━━━━━━━━━━━━━━━━
🏴☠️ THIEF TRADER MOTIVATION — FROM THE MARKET HEIST MASTER
━━━━━━━━━━━━━━━━━━━━━━━━━━━━━━━━━━━━━━
"Every great heist begins with the same rule — you don't rush the vault. You study it, you case it, you learn every lock and every guard rotation. Then when the moment arrives, you move with precision, not panic. The market is no different. Most traders lose because they charge the door before it opens. The Thief OG's wait for the breakout, execute the plan, take their profits, and disappear before the police arrive at 54,500. Patience is not weakness — patience is the master key. Now let's get to work and steal this market clean."
— The Market Heist Master 🏴☠️💰
If this idea added value to your trading toolkit today, show the Thief Trader crew some love:
👍 BOOST this idea to help more traders discover the heist plan
❤️ LIKE it up — every like tells the algorithm this content is worth sharing
💬 Drop a COMMENT — What's your read on the US30 / DJI30 breakout? Let's talk about it
📌 FOLLOW the Thief Trader for daily heist plans across Forex, Indices, Commodities & Crypto
Together, the Thief OG's move smarter, trade sharper, and escape with more. See you in the vault. 🏦🔓 DOW JONES confirmed a new Bearish Leg to 49000 at least.Dow Jones (DJIA) has been trading within a Channel Up since the April 07 2025 Low and has spent the last week trading entirely below its 1D MA50 (blue trend-line). That has always been a confirmed Bearish Leg signal within this pattern, with its 1D RSI also trading on the symmetrical level as the 1D MA50 break-outs of the previous two Bearish Legs.
In total those declined by -11.30% and -14.73% respectively, with the most recent one last March, finding Support exactly on the 1W MA75 (red trend-line). The was exactly within the 0.382 - 0.236 Fibonacci range (green zone), which is a strong Support on this pattern.
Based on this, we expect Dow to decline to at least 49000, potentially coming close to the 1W MA75 once more.
---
** Please LIKE 👍, FOLLOW ✅, SHARE 🙌 and COMMENT ✍ if you enjoy this idea! Also share your ideas and charts in the comments section below! This is best way to keep it relevant, support us, keep the content here free and allow the idea to reach as many people as possible. **
---
💸💸💸💸💸💸
👇 👇 👇 👇 👇 👇 Short 
Short 
 Short
Short
 Short
Short
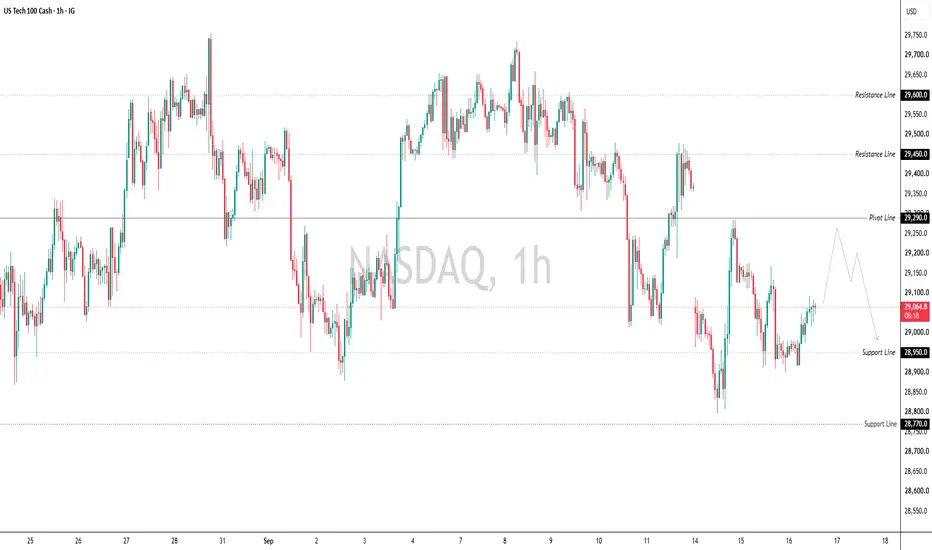
USNAS100 | 29040 Could Decide the Next Move
USNAS100 remains under bearish pressure while trading below 29040, with the broader fundamental environment also weighing on technology stocks.
However, after the recent decline, Nasdaq is attempting a short-term corrective recovery toward 29040. This level will be important in determining whether sellers regain control or the recovery extends.
Technically
As long as USNAS100 remains below 29040, the broader bearish structure stays active.
The price could first correct toward 29040. If buyers fail to break and stabilize above this resistance, renewed selling pressure could push Nasdaq back toward 28610. A confirmed break below 28610 would expose the next support around 28400.
On the other hand, a confirmed break and stability above 29040 would weaken the immediate bearish structure and support bullish momentum toward 29290.
Fundamentally, the combination of AI-sector weakness, elevated Treasury yields, higher oil prices and strong Fed rate-hike expectations continues to create pressure on Nasdaq, meaning bullish moves remain vulnerable unless the technical structure confirms a stronger reversal.
Pivot Line: 28940
Support: 28610 – 28400
Resistance: 29040 – 29290
Short