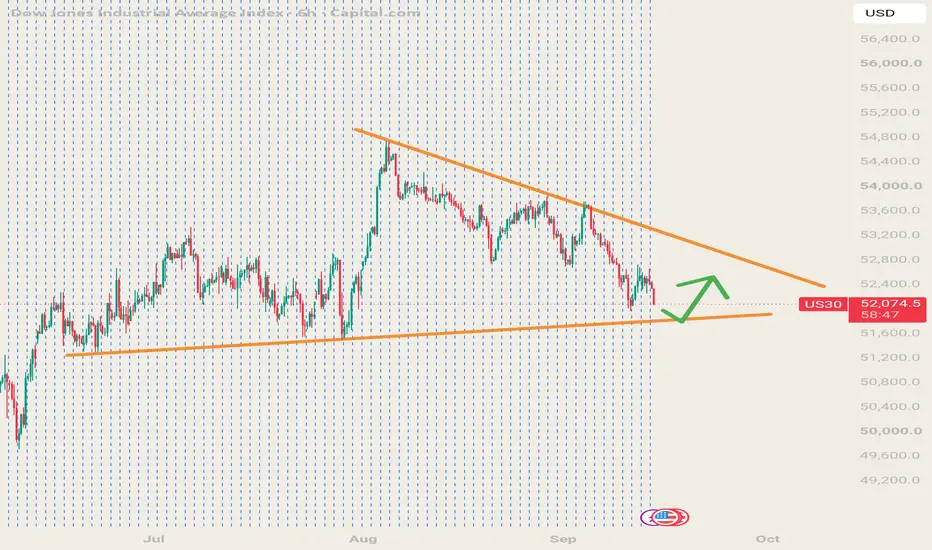
Long
Long
S&P500 targeting the 1W MA100 by Midterm Elections.Last week (September 08, see chart below), we gave a strong Sell Signal on the S&P500 index (SPX), as it had started the new Bearish Leg of its 1-month Channel Down:
Both our Target and the 1D MA50 got hit and now the market faces the next medium-term Support, the 1D MA100 (green trend-line), which held the July 31 bottom and has been basically holding since the April 10 break-out.
If broken, expect the S&P500 to seek its 1W MA100 (red trend-line), which sits exactly within the 0.618 - 0.786 Fibonacci range of the 4-year Channel Up. The Sine Waves show that since May 2022, every roughly 385 days, the market drops and tests its 1W MA100.
Based on that, we expect the market to hit 6800 going towards the Midterm Elections.
---
** Please LIKE 👍, FOLLOW ✅, SHARE 🙌 and COMMENT ✍ if you enjoy this idea! Also share your ideas and charts in the comments section below! This is best way to keep it relevant, support us, keep the content here free and allow the idea to reach as many people as possible. **
---
💸💸💸💸💸💸
👇 👇 👇 👇 👇 👇  Short
Short
 Short
Short
Mastering Financial Intelligence🧠 Neural Networks in Financial Market Forecasting
Financial markets generate an enormous amount of data every day. Prices, volumes, currencies, commodities, interest rates and other markets are constantly interacting with one another. For an individual trader, identifying all these relationships can be difficult.
This is where neural networks can offer a different perspective.
Inspired by the way the human brain learns, neural networks are mathematical systems that learn patterns and relationships from data. In financial markets, they can analyze large amounts of technical, intermarket and fundamental data to identify relationships that may not be obvious by simply looking at price charts.
Look Beyond a Single Market
A common mistake in market analysis is to look at a market in isolation.
For example, when analyzing crude oil, a trader might focus on crude oil's price, volume and technical indicators. But crude oil can also be influenced by currencies, interest rates, stock indexes and other commodities.
This is the idea behind intermarket analysis : markets are connected, and information from one market can sometimes provide clues about another.
A neural network can process these different inputs simultaneously and search for patterns—including lead-and-lag relationships that may be difficult to identify manually.
How Does a Neural Network Work?
A basic neural network consists of three main layers : Input Layer → Hidden Layer → Output Layer
The input layer receives the market data. This could include prices, volume, open interest, technical indicators and information from related markets.
The hidden layer processes this information and attempts to identify patterns and relationships within it. During training, the network adjusts numerical weights associated with its connections as it learns.
Finally, the output layer produces the forecast, for example, a projected price, trend or technical indicator.
The learning process can be simplified as: Data → Forecast → Error → Adjustment → Improved Forecast
One popular approach is back-propagation , where the network uses its forecasting error to adjust its internal weights and improve future predictions.
The Biggest Challenge: Overtraining
There is, however, a major danger.
A neural network can become too specialized to its historical data. Instead of learning useful relationships that can work in the future, it may simply memorize the peculiarities of the past.
This is known as overtraining or overfitting , and it is similar to curve-fitting in trading-system development.
A model that produces excellent results on historical data isn't necessarily a good model.
The real test is whether it can perform on data it has never seen before .
Testing the Real Skill
To evaluate a neural network properly, historical data can be divided into training and testing periods.
The network learns from the training data and is then evaluated using independent out-of-sample data .
This helps answer an important question: Has the network actually learned a useful pattern or has it simply memorized history?
Different network designs can also be tested and compared. Input data, preprocessing, architecture and training procedures may be modified before selecting the final model.
The Financial IQ Advantage
The real value of neural networks isn't that they can predict the future perfectly. No technology can eliminate market uncertainty.
Their value lies in their ability to examine enormous amounts of information and search for relationships that humans may overlook.
For traders and investors, this encourages a more intelligent way of thinking:
Don't just ask what one chart is doing. Ask what other markets might be telling you.
Neural networks can help transform: Market Data → Hidden Patterns → Forecasts → Better Decisions
But they should be viewed as a tool , not a magic bullet.
The competitive advantage comes from combining technology with good data, sound analysis, proper testing and disciplined decision-making.
The market may look like a collection of separate charts. Neural networks remind us that beneath those charts, everything may be connected. Education 
 Short
Short
AI Wobble Leaves US 100 Sentiment on a Knife EdgeIts already been a tough start to the week for technology stocks in the US 100 index as traders reacted negatively on Monday to the shock proposal made over the weekend by influential Anthropic CEO Dario Amodei, who urged the AI industry to slow the development of its most advanced models in order for adequate guardrails to be put in place, comments further supported by Sam Altman of OpenAI and Elon Musk.
The fallout saw chipmaker stocks within the US 100, leading the index down from a close at 29370 on Friday to a low of 28804 yesterday afternoon, a drop of 1.9% before some fresh demand resurfaced. Chipmakers were hit especially hard on concerns that a slowdown in AI development could lead to a reuction in AI capital expenditure which has been the major factor driving their value to numerous record highs.
If this wasn’t enough of a challenge for stock traders to negotiate this week, sentiment remains on a knife edge ahead of the Federal Reserve (Fed) interest rate decision, which is due for release on Wednesday at 1900 BST. Economists and investors are divided on whether the Fed decides to hike rates for the first time in 2026 to stem the immediate threat from rising inflation or keep rates unchanged to allow policymakers to analyse another month of key data readings. As a rule, Fed rate hikes tend to weigh on technology/growth stocks in the US 100 index as it makes borrowing more expensive.
Whatever the Fed decides, the press conference, which commences at 1930 BST on Wednesday, could also be a volatility flashpoint for US 100 prices, as traders respond to Fed Chair Kevin Warsh’s comments on inflation and future rate moves into the end of 2026.
Technical Update: Decision Making Process Develops:
The technical picture for the US 100 index continues to reflect an uncertain sentiment backdrop, with the latest upside recovery failing at 30246 (August 17th high), still well below the June 1st all-time high at 30656. Some traders may view this price action as a weak test of the previous 30656 extreme, which could be a negative for future directional moves.
However, as the chart above shows, since mid‑August prices have traced out a period of sideways movement between 28873 (August 24th low) and 29749 (August 28th high). This type of more balanced activity may be viewed as a decision‑making process, with a closing breakout from the price range required to suggest where the next directional risks could lie.
Potential Support Levels:
With 28873 (August 24th low) potentially marking the lower extreme of the current sideways trading range, this level may be viewed as the first key support. Closing breaks below 28873, if seen, could develop the possibility of negative momentum reemerging.
Closing breaks below 28873 could suggest the decision‑making process has been resolved to the downside, resulting in further price weakness and tests of support at 27050 (July 29th low). Closing breaks below 27050 could open potential for moves toward 26714 (50% Fibonacci retracement of the March 31st to June 1st strength), even 25830 (61.8% retracement).
Potential Resistance Levels:
Currently the sideways price range still remains intact, with the upper extremes potentially marked by resistance at 29749 (August 28th high). Therefore, if this sideways activity is to be resolved in a positive way, it may be reflected by closes above 29749, which could lead to further attempts at price strength.
Closes above 29749, if seen, could lead to further price upside momentum to challenge the August 17th high at 30246. If this level were also broken on a closing basis, price moves could extend toward the June 1st all‑time high at 30656.
The material provided here has not been prepared accordance with legal requirements designed to promote the independence of investment research and as such is considered to be a marketing communication. Whilst it is not subject to any prohibition on dealing ahead of the dissemination of investment research, we will not seek to take any advantage before providing it to our clients.
Pepperstone doesn’t represent that the material provided here is accurate, current or complete, and therefore shouldn’t be relied upon as such. The information, whether from a third party or not, isn’t to be considered as a recommendation; or an offer to buy or sell; or the solicitation of an offer to buy or sell any security, financial product or instrument; or to participate in any particular trading strategy. It does not take into account readers’ financial situation or investment objectives. We advise any readers of this content to seek their own advice. Without the approval of Pepperstone, reproduction or redistribution of this information isn’t permitted.  Long
Long
 Short
Short
DAX 40 ($DE40) Daily: Strong Corrective Wave TargetsDAX 40 ( ICMARKETS:DE40 ) Daily: Strong Corrective Wave Targets 200-EMA & 24,693 Confluence Zone Following Channel Breakdown
### 🇩🇪 Germany DAX 40 Index ( ICMARKETS:DE40 ) Daily Technical Matrix (Ref: DE40_2026-09-15_08-48-43.png)
Following up on our previous structural outlook published on August 13, 2026, and updated as of September 15, 2026, the Germany DAX 40 Index ( ICMARKETS:DE40 / IC Markets) is executing a pronounced corrective decline. Price action has decisively broken below its primary ascending channel guide (green trendline) and trailing **17-EMA**, heading directly toward its high-confluence dynamic and structural support node.
The index is trading down **-1.16% (-295.10 pts)** at **25,221.30**, entering the lower Fibonacci retracement bands.
---
### 🔍 Technical Architecture & Level Roadmap:
Our quantitative Daily (1D) framework isolates the key Fibonacci levels, structural polarity floors, and downside extension targets:
1. **High-Confluence Demand Target (Green Circle Focus Node):**
* **200-Period Exponential Moving Average (200-EMA):** **24,813.28** (purple line) — Core dynamic institutional baseline driving macro trend support.
* **Horizontal Polarity Support Floor:** **24,693.80** (red line) — Structural horizontal boundary aligning perfectly with the **1.000 Fib (24,686.70)** swing base.
2. **Fibonacci Retracement Grid:**
* **0.618 Retracement:** **25,407.88** — Immediate overhead hurdle recently surrendered by buyers.
* **0.786 Retracement:** **25,090.74** — Intermediate buffer zone ahead of the main support node.
* **0.382 / 0.236 Retracements:** **25,853.37** / **26,128.97** — Confluence resistance parameters.
3. **Overhead Supply & Dynamic Ceilings:**
* **17-Period Dynamic Resistance (17-EMA):** **25,775.94** (red line) — Trailing dynamic ceiling to reclaim for short-term stabilization.
* **Macro All-Time High Resistance:** **26,606.92** — Range ceiling.
4. **Bearish Extension Projections (In Case of Breakdown):**
* **1.618 Fibonacci Extension Target:** **23,520.19** — Primary downside expansion zone if **24,693.80** fails.
* **2.618 Fibonacci Extension Target:** **21,632.50** — Secondary macro target floor.
---
### 🛡️ Strategic Operational Scenarios:
* **Scenario A — Support Defense at 200-EMA Confluence:** The primary expected reaction zone lies within the **24,813.28 (200-EMA) – 24,693.80** structural belt. A bullish defense and reversal structure in this green highlight node provides a high-probability base for trend continuation toward **25,775.94 (17-EMA)**.
* **Scenario B — Structural Breakdown Below 24,693:** A daily close beneath **24,693.80** invalidates the macro support node, confirming an extended impulse lower toward **23,520.19 (1.618 Fib Extension)** and potentially **21,632.50 (2.618 Fib Extension)**.
### 📊 Tactical Parameters Summary:
* **Current Bias:** Corrective Pullback / Support Test
* **Primary Support Node (200-EMA / Static Floor):** 24,813.28 / 24,693.80
* **Immediate Dynamic Resistance (17-EMA):** 25,775.94
* **Macro Range Peak:** 26,606.92
* **Bearish Fibonacci Extension Targets:** 23,520.19 (1.618) | 21,632.50 (2.618)
---
📊 **ChartPro Data**
*European Equities Architecture, Fibonacci Matrix & Systematic Risk Management.*
⚠️ **Disclaimer:** For educational and informational purposes only. This active market study represents a personal trading framework and does not constitute financial or investment advice. Short 
China H Shares ($CHINAHHKD) Daily: Rejection at 200-EMA China H Shares ( OANDA:CHINAHHKD ) Daily: Rejection at 200-EMA and Descending Trendline Threatens 8,142 Support Floor
### 🇨🇳 China H Shares ( OANDA:CHINAHHKD ) Daily Technical Matrix (Ref: CHINAHHKD_2026-09-15_08-41-44.png)
We are issuing an updated Daily (1D) macro structural study for the China H Shares Index ( OANDA:CHINAHHKD / OANDA). Following a clear technical rejection at the confluence of the descending macro trendline (LTD) and institutional moving average anchors, price action has resumed its downward impulse, accelerating lower toward immediate structural demand.
The index is trading sharply lower down **-1.58% (-131.5 pts)** at **8,198.5**, pressing directly against its local baseline support.
---
### 🔍 Technical Architecture & Level Roadmap:
Our quantitative daily setup isolates the key dynamic barriers, horizontal thresholds, and downside target projections governing this active bearish leg:
1. **Overhead Rejection Confluence Node:**
* **Macro Descending Trendline (LTD):** Dynamic diagonal ceiling capping all major recovery attempts since Q1.
* **200-Period Exponential Moving Average (200-EMA):** **8,533.6** (purple line) — Institutional macro trend baseline successfully acting as strong overhead supply.
* **17-Period Dynamic Resistance (17-EMA):** **8,366.8** (red line) — Trailing dynamic resistance line recently lost by buyers.
* **Major Resistance Ceiling:** **8,721.6** — Key horizontal supply ceiling.
2. **Immediate Support Baseline Under Test:**
* **Horizontal Support Floor:** **8,142.7** (red line) — Immediate structural floor currently being put under severe pressure.
3. **Downside Expansion Target (Red Arrow Projection):**
* **Macro Structural Demand Floor:** **7,415.4** — Primary downside expansion target if the **8,142.7** support breaks down.
---
### 🛡️ Strategic Operational Scenarios:
* **Scenario A — Bearish Breakdown Below 8,142 (Red Arrow Projection):** A decisive daily candle close beneath **8,142.7** confirms a continuation of the macro downtrend, unlocking downside momentum targeting the **7,415.4** structural floor.
* **Scenario B — Tactical Relief Rally / Invalidation:** Any intraday relief bounce will encounter heavy dynamic resistance at the **8,366.8 (17-EMA)** level and the **8,533.6 (200-EMA)** institutional node. Only a daily close back above **8,721.6** invalidates the current bearish structure.
### 📊 Tactical Parameters Summary:
* **Current Bias:** Bearish Continuation / Resistance Rejection
* **Immediate Support Floor:** 8,142.7
* **Downside Target (Red Arrow):** 7,415.4
* **Dynamic Resistance Ceilings (17-EMA / 200-EMA):** 8,366.8 / 8,533.6
* **Major Horizontal Ceiling:** 8,721.6
---
📊 **ChartPro Data**
*Asian Equities Architecture, Dynamic Moving Averages & Systematic Risk Management.*
⚠️ **Disclaimer:** For educational and informational purposes only. This active market study represents a personal trading framework and does not constitute financial or investment advice.  Short
Short
 Short
Short
Long 
Signs of a potential reversal?UK100 has rejected the pivot, which has been identified as an overlap resistance that aligns with the 38.2% Fibonacci retracement and could potentially drop towards the 1st support, which is also an overlap support.
Pivot: 10,700.87
1st Support: 10,590.35
1st Resistance: 10,788.32
Disclaimer:
The opinions given above constitute general market commentary and do not constitute the opinion or advice of IC Markets or any form of personal or investment advice.
Any opinions, news, research, analyses, prices, other information, or links to third-party sites contained on this website are provided on an "as-is" basis, are intended to be informative only, and are not advice, a recommendation, research, a record of our trading prices, an offer of, or solicitation for, a transaction in any financial instrument and thus should not be treated as such. The information provided does not involve any specific investment objectives, financial situation, or needs of any specific person who may receive it. Please be aware that past performance is not a reliable indicator of future performance and/or results. Past performance or forward-looking scenarios based upon the reasonable beliefs of the third-party provider are not a guarantee of future performance. Actual results may differ materially from those anticipated in forward-looking or past performance statements. IC Markets makes no representation or warranty and assumes no liability as to the accuracy or completeness of the information provided, nor any loss arising from any investment based on a recommendation, forecast, or any information supplied by any third party.  Short
Short
Long 

NAS100 – Resistance Rejection & Liquidity Sweep🔹 NAS100 price action shows a broader sideways-to-bearish structure beneath the descending resistance trendline formed from the swing high near 30,200. Price recently retested the resistance area around 29,700–29,800 and appears to have faced rejection, with renewed downside pressure visible. The market remains below this key resistance, while consolidation around 29,300–29,600 reflects uncertainty. The highlighted liquidity area near 28,300–28,400 remains an important downside reference if bearish pressure persists.
🔸 NAS100 could continue toward the lower liquidity area if price remains rejected beneath the descending resistance and fails to reclaim the 29,700–29,800 region. Alternatively, a confirmed breakout above the descending structure could support a shift toward a more bullish market structure. Traders may wait for clear price confirmation before considering any trade, while failure of the lower structure could expose additional downside liquidity.
Educational Note: This analysis is for educational purposes only and does not constitute financial or investment advice. Always conduct your own research before making trading decisions. Short 
NIFTY SENTIMENT ANALYSIS FOR 15/09/2026🚨 **NIFTY 15 SEP 2026 — DARR KIS BAAT KA?**
Today’s sentiment is **bullish — but not clean bullish.**
The engines are pointing toward direction, but the structure carries **conflict, trap potential and explosive behaviour**.
### 📊 SENTIMENT ENGINE
🟢 **Hybrid:** Bullish | Trap / Conflict
🟡 **Unified:** Mild Bullish
⚡ **Behaviour:** Explosive
The key message:
**Bullish bias does not mean a straight-line move.**
PE dominance suggests opposing pressure, so price reaction around key levels becomes more important than the directional label.
### 🎯 PRICE BATTLEFIELD
**23,591.25** — Opening reference
**23,535** — Resistance
**23,480** — Key level
**23,425** — Support
**23,368** — Major support
Price opened at **23,591.25** and moved toward **23,453**.
23,535 rejected.
23,480 rejected.
Now **23,425** becomes the immediate battlefield.
**Hold → reaction.**
**Break → next level.**
### ⏰ THE TIME FACTOR
Today is **expiry day**.
My key **13:40 anchor** becomes important.
With the model showing **Explosive behaviour + Trap/Conflict**, the period after the anchor could potentially bring a stronger expansion or decisive reaction.
The direction still needs to be confirmed by price.
**Time creates the opportunity.
Price decides the direction.**
### 👀 SECTORS TO WATCH
🔥 **Pharma +5** — strongest signal
🏦 **Banking +3** — second strongest
📈 **Leadership +2** — supporting signal
Pharma is the first sector I would keep an eye on.
If **Pharma + Banking** confirm together, bullish strength becomes more credible.
If leadership fails to participate, watch for rotation and trap behaviour.
### 🧠 TODAY'S THESIS
This is not about predicting every candle.
It is about knowing **where, when and what to watch.**
📍 Price gives the level.
⏰ Time gives the trigger.
⚡ Reaction gives the truth.
**Darr nahi. Data dekho.** 🎯
This analysis is a market-context/research framework, not a buy/sell recommendation.
#NIFTY #NIFTY50 #MarketSentiment #MarketAnalysis #PriceAction #Expiry #MarketTiming #TradingView #NSE #IndianStockMarket #IntradayTrading #TechnicalAnalysis #TradingPsychology #Pharma #Banking