Short
Short
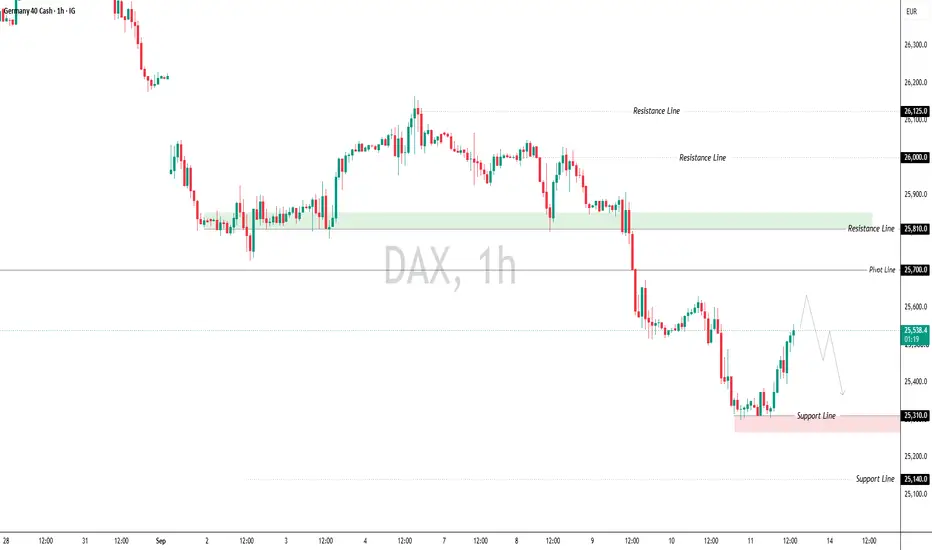
DAX: sell limit in the daily order block, set and forgetCONTEXT
Both the daily and the H1 structure are bearish on the DAX. The index rolled over from the 26,600 area at the end of August and broke down through 25,800 between Sep 8 and Sep 10, leaving a daily order block and an unfilled daily fair value gap above. The current bounce off 25,270 is a retracement inside that broken structure, not a reversal of it.
THE ZONE
Supply zone 25,784 - 26,012 (grade A): the daily order block of Sep 8 overlaps the daily fair value gap and an H1 fair value gap plus an H1 order block. Four elements across two timeframes in the same place, and the zone sits with the higher-timeframe bias.
THE PLAN
Sell limit at 25,898 (middle of the zone).
Stop loss at 26,048, above the top of the zone plus a volatility buffer (0.15 ADR).
Target at 25,597, the previous day high and first liquidity pool below the zone. Risk/reward 2.0.
RULES
No killzone chasing and no intraday re-analysis: the zone is mapped in advance, the order is placed as a limit, SL and TP are fixed, then it is left alone. If price never comes back to the zone, there is no trade. Nothing is placed within 60 minutes of a high-impact release.
Not financial advice. Structural analysis for educational purposes only, trade your own plan and risk.  Short
Short
 Short
Short
 Short
Short
Short 
 Long
Long
 Long
Long
 Long
Long
Long 
KSE-100: Third Test of 16-Month Channel SupportKSE-100 has pulled back into the lower boundary of the rising channel that has guided the index since the May 2025 low of 101,599. Today's low of 166,141 is the third touch of that line, 491 days (335 sessions) after the first. How price reacts here likely decides the next big leg.
WHAT THE CHART SHOWS
1. Rising parallel channel
Lower line touches: May 2025 (101.6k), March 2026 (144.6k), and now (~166k).
Upper line touches: September 2025 and January 2026 (191,251 all-time high).
Three touches on one line make it a meaningful trend boundary.
2. Support confluence
Channel support near 166k lines up with horizontal support at 168,414. Price is testing this 166k to 168.4k zone right now.
3. Contracting structure inside the channel
Highs are getting lower (191.2k in January, about 188.1k in July) while lows are getting higher (144.6k in March, 166.1k now). The descending resistance line now sits near 186k to 187k, close to the channel midline. Price is coiling, and a range like this usually resolves with a strong move.
4. Caution: 200-day SMA
Price has slipped below the 200 SMA (172,082). Reclaiming it is the confirmation the bulls need.
TRADE PLAN (bias: bullish while the channel holds)
Trigger: a daily close back above 168.4k, then a reclaim of the 200 SMA
T1: 172,082 (200 SMA)
T2: 186k to 188k (descending trendline and channel midline)
T3: 191,251 (all-time high)
Extension: a breakout above the trendline and ATH opens the 219,986 level, near the upper channel line.
Invalidation: a daily close below the channel line (below ~164k). That would open the way back toward the key 144,629 March 2026 low.
Risk/reward from ~168.2k with a stop under 164k: about 4.5R to T2 and 5.5R to T3.
Today's candle is still open. A daily or weekly close holding the channel matters more than intraday wicks.
This is my technical view, not financial advice. Please do your own research and manage your risk. Shanghai Composite : Liquidity First, Direction SecondThe recent break of structure has shifted short-term momentum, but the broader trend hasn't been invalidated. Right now, I'm focused on the liquidity resting just below current price. That's the area where I expect the market to reveal its next intention.
I see two possible paths :
Path 1 :
Price sweeps the liquidity zone, finds demand, and quickly resumes the primary trend toward the overhead supply between 5,150-5,365.
Path 2 :
The first liquidity sweep fails to hold, leading to a deeper correction toward the 3,760 support before buyers regain control and the broader uptrend resumes.
Different paths. Same objective.
The next move isn't about predicting direction; it's about watching how price behaves once liquidity has been collected.
Until then, patience remains the highest-probability position.
The map is drawn. Now we wait.
Follow, Boost, Join, Thank You!
Financial Disclaimer: This post is not financial advice. I am not your financial advisor, your life coach, or your legally responsible adult. Always do your own research and never trade based solely on internet comedy. Inditex strengthens inventories while price supports 200day EMAInditex strengthens inventories while the stock price seeks support at the 200-day moving average
Ion Jauregui – Analyst at ActivTrades
Inditex faces a more demanding operating environment with a still-solid financial position, but also with a supply chain facing increasing pressure from the conflict in the Middle East. The group closed the first half of its fiscal year with €3.789 billion in inventories, 16.6% more than at the end of the previous financial year and 9.3% above the same period in 2025.
The increase in inventories comes at a particularly sensitive time for international transportation. Tensions in the Middle East, risks to maritime routes and higher insurance and transportation costs have increased uncertainty over supply times and costs. Inditex does not directly attribute the increase in inventory to the conflict, but rather to its strong operating performance, although it acknowledges that the geopolitical situation may affect energy prices, supply chains and financial and foreign exchange markets.
The strategy has a defensive reading. Maintaining more products available makes it possible to reduce the risk of disruptions and preserve the ability to supply stores and the online channel even amid changes in logistics routes. Geographic diversification and the flexibility of the supply chain are, in this context, one of the group's main operating assets.
However, this protection comes at a cost. Gross margin stood at 58.7% in the first half, four tenths of a percentage point above the previous year, but slightly below market expectations. At the same time, net profit reached a record €2.980 billion, up 6.8% year-on-year, while net financial position rose to €10.398 billion.
The stock loses momentum
The market reaction reflects precisely this tension between growth and profitability. The stock suffered a sharp adjustment following the publication of the results and, since then, its short-term technical structure has weakened.
At the opening of this September 11 session, Inditex continues to trade below the 50-day moving average, following the bearish gap recorded at Wednesday's opening. The moving averages are currently expanding, confirming an increase in the distance between them and a structure showing greater pressure on the price.
The most relevant technical reference at this point is the 200-day moving average, which is acting as support for the current price. The stock's ability to remain above this moving average will be particularly important in determining whether the current move represents a correction within a still-defensible long-term structure or, on the contrary, opens the door to a deeper bearish phase.
Momentum is also not currently favoring an immediate recovery. The RSI stands at around 37%, approaching oversold territory, while the MACD remains in negative territory, with the histogram continuing to expand further into negative territory. Both indicators show that selling pressure remains present, although the RSI is beginning to approach a zone where a technical reaction may emerge.
Two volume areas
The volume profile adds two particularly relevant references. The current volume distribution shows its Point of Control (POC) around €47.37, the level concentrating the highest traded volume within the structure currently being analyzed.
Above it, the previous formation maintains another POC around €55.99, making this an important reference zone for any potential recovery. The shift between both levels reflects the change in equilibrium experienced by the stock following the decline.
Therefore, while €47.37 represents the volume reference for the current structure, €55.99 constitutes a much more demanding recovery zone. The price would need to progressively recover the intermediate areas and, especially, return above the 50-day moving average to begin rebuilding a more favorable technical structure.
In the short term, the combination of price below the 50-day moving average, expanding moving averages, RSI approaching oversold territory and a negative MACD keeps the technical bias under pressure. However, the fact that the price is finding support at the 200-day moving average, together with the RSI's proximity to oversold levels, leaves the possibility of a technical reaction open if sufficient demand emerges.
The fundamental scenario continues to show two speeds. Inditex maintains growth, record profits and a financial position capable of absorbing part of the increase in logistics costs. But the market now requires the company to demonstrate to what extent it can preserve its margins in an environment of higher transportation costs, geopolitical tensions and greater investment in inventory.
The evolution of the stock price will therefore depend on whether the 200-day moving average manages to hold the price and generate a reaction capable of recovering momentum, or whether selling pressure ultimately prevails and forces the market to seek a new equilibrium below this support.
*******************************************************************************************
The information provided does not constitute investment research. The material has not been prepared in accordance with the legal requirements designed to promote the independence of investment research and such should be considered a marketing communication.
All information has been prepared by ActivTrades ("AT"). The information does not contain a record of AT's prices, or an offer of or solicitation for a transaction in any financial instrument. No representation or warranty is given as to the accuracy or completeness of this information.
Any material provided does not have regard to the specific investment objective and financial situation of any person who may receive it. Past performance and forecasting are not a synonym of a reliable indicator of future performance. AT provides an execution-only service. Consequently, any person acting on the information provided does so at their own risk. Political risk is unpredictable. Central bank actions can vary. Platform tools do not guarantee success.
S&P 500 ($SPX) 4H: Price Action Retests Crucial 7,576S&P 500 ( SPCFD:SPX ) 4H: Price Action Retests Crucial 7,576 Support Baseline at Make-or-Break Wedge Confluence
### 🇺🇸 S&P 500 Index ( SPCFD:SPX / SPCFD) 4-Hour (4H) Technical Matrix (Ref: SPX_2026-09-11_08-41-26.png)
We are issuing an intraday 4-Hour (4H) technical update for the S&P 500 Index ( SPCFD:SPX / SPCFD). Following a corrective move off the recent macro high, price action has pulled back to test a key structural decision node, compressing directly along the lower boundary of its local consolidation wedge and horizontal polarity support.
The index is trading down **-0.10% (-7.71 pts)** at **7,591.69**, holding just above critical baseline support with volume recorded at **1.41B**.
---
### 🔍 Technical Architecture & Level Roadmap:
Our quantitative 4H framework isolates the core static thresholds, dynamic moving average guides, and trendlines governing this pivotal test:
1. **Immediate Decision Support Node Under Test:**
* **Key Horizontal Polarity Support:** **7,576.21** (red line) — Major structural pivot floor currently being actively tested.
* **Consolidation Wedge Lower Boundary:** Sloping trendline guide creating immediate confluence at the **7,576** node.
2. **Overhead Resistance Ceilings:**
* **17-Period Dynamic Resistance (17-EMA):** **7,664.09** (red line) — Trailing dynamic ceiling to reclaim to resume bullish intraday momentum.
* **Local Descending Trendline (LTD):** Upper diagonal barrier currently capping recent swing highs around the **7,720.00** area.
* **Macro High Resistance Target:** **7,806.20** — Primary horizontal range ceiling.
3. **Lower Institutional Demand Floor:**
* **200-Period Exponential Moving Average (200-EMA):** **7,457.62** (purple line) — Core institutional macro trend anchor and primary downside target if support fails.
---
### 🛡️ Strategic Operational Scenarios:
* **Scenario A — Bullish Bounce & Recovery (Blue Arrow Projection):** Buyers successfully defending the **7,576.21** horizontal floor and reclaiming **7,664.09 (17-EMA)** will confirm a bullish defense, driving momentum back toward the upper wedge boundary and the **7,806.20** peak.
* **Scenario B — Bearish Breakdown Below 7,576 (Red Arrow Projection):** A decisive 4H candle close below **7,576.21** invalidates local demand, unlocking acceleration down toward the **7,457.62 (200-EMA)** dynamic institutional floor.
### 📊 Tactical Parameters Summary:
* **Current Bias:** Neutral / Testing Key Support Node
* **Primary Decision Floor:** 7,576.21
* **Dynamic Resistance Ceiling (17-EMA):** 7,664.09
* **Macro Range High Target:** 7,806.20
* **Institutional Dynamic Floor (200-EMA):** 7,457.62
---
📊 **ChartPro Data**
*US Equities Architecture, Intraday Moving Averages & Systematic Risk Management.*
⚠️ **Disclaimer:** For educational and informational purposes only. This active market study represents a personal trading framework and does not constitute financial or investment advice. Short 
Trade Idea: US30 Short (15M Bearish Trend Continuation)Market: US30 / Dow Jones
Timeframe: 15M
Bias: Bearish
Market Structure:
On the 15-minute timeframe, the market is in a clear bearish structure, consistently forming Lower Highs (LH) and Lower Lows (LL). Due to this strong downward momentum, the overall trend is treated as bearish.
Following a recent downside impulse, the price has retraced to create a pullback within the 15M structure. The plan is to capitalize on this retracement as a short-selling opportunity rather than chasing the market downwards.
Trade Plan:
Entry: 52,398.7
Stop Loss (SL): 52,660.8 (Placed above the recent Lower High / invalidation zone)
Take Profit 1 (TP1): 52,140.6 (Approximately 1R)
Take Profit 2 (TP2): 51,875.7 (Approximately 2R)
Invalidation:
If the price breaks and sustains above 52,660.8, the bearish setup is invalidated, and the current LH → LL structure will be compromised.
Core Summary:
15M Bearish Trend → LH/LL Structure → Pullback → Sell Limit/Market → Target Previous Lows.
Note: This is a trend-following short setup, not a counter-trend reversal trade. Short 
 Short
Short
Episode 06 — When the Wave Principle Reached the World🎬 Mr. Nobody’s Chronicle
Season I — The History of Elliott Wave Principle
Episode 06 — When the Wave Principle Reached the World
“A discovery, while it remains only in one person’s mind, still has a long journey before it can reach the world...”
In the previous episode, we came closer to one of the deeper ideas behind the Wave Principle.
A movement could be composed of smaller movements...
while that same movement could also be part of a larger structure.
A pattern within the pattern.
But observing a structure was only the beginning.
For Ralph Nelson Elliott, another question now emerged:
How could these observations be explained?
How could something he had studied for years through charts, movements, and market structures be transformed into a framework that others could understand?
Elliott needed to find a language for his discoveries.
A language that could explain why market movement could not simply be viewed as a collection of separate fluctuations.
He needed to show how large and small movements were connected...
how one structure could exist within another...
and how something that appeared complete at one scale could be only part of a much larger picture at another.
These ideas eventually began to take a clearer form in his writings.
In 1938, Elliott published The Wave Principle.
But the story did not end there.
The following year, in 1939, another important step took place.
Financial World published a series of articles presenting Elliott’s Wave Principle and his market studies.
This was no longer simply the private research of a man who had spent countless hours studying charts.
His ideas were now reaching the pages of a financial publication.
Across a series of twelve articles titled:
The Wave Principle
Elliott attempted to explain what he had spent years studying.
Market movement...
Its rhythm...
The recurrence of structures...
And the relationship between smaller and larger movements.
But most importantly, he was exploring a fundamental question:
Could market movement truly be understood through an observable and studyable principle?
This was an important moment in the story of the Wave Principle.
Because an observation was now becoming something that others could examine...
Challenge...
Study...
And test for themselves on the charts.
The Wave Principle was no longer simply a discovery hidden among Ralph Nelson Elliott’s papers and charts.
It had begun its journey into the world of financial analysis.
But introducing an idea is not the same as proving it—or fully understanding it.
A larger question now stood before its readers:
If the market truly followed this principle...
What exactly did that structure look like?
Elliott had an answer for that question as well.
An answer that would eventually become one of the most recognizable concepts in the history of technical analysis:
Five waves in the direction of the main movement...
followed by...
three corrective waves.
But behind this seemingly simple count was a much deeper world of structures, degrees, rules, and guidelines.
And now...
we are ready to enter the heart of the Wave Principle’s language.
Five and Three.
To be continued...
Narrated by Mr. Nobody 🎧📊
Research & Market Studies
Mehdi & Rana Education 

Long