NAS100: Sell-Side Liquidity Sweep Signals Bullish ReversalNASDAQ 100 is approaching a critical inflection point after sweeping Sell-Side Liquidity below the major lows and reacting strongly from a Fair Value Gap (FVG) demand zone. The aggressive bearish move appears to have been a liquidity grab rather than the beginning of a new downtrend, with buyers stepping in immediately after the sweep. This type of price action often signals institutional accumulation before a potential bullish expansion.
The highlighted Fair Value Gap around 28,400–28,500 has acted as a key support area where price has found buying interest. The liquidity sweep beneath this zone removed weak long positions before price quickly recovered back above support, increasing the probability that the market is preparing for a reversal. As long as this demand area continues to hold, the bullish outlook remains valid.
Earlier in the trend, the market printed several Market Structure Shifts (MSS), confirming repeated changes in momentum as buyers and sellers competed for control. The recent reaction from the liquidity zone suggests that another bullish structure shift could develop if buyers continue to defend current levels and push price above the nearest resistance.
The first upside target is the Support Turned Resistance area around 29,500–29,600. A successful breakout above this level would expose the Strong Resistance & Order Block near 29,800–29,950, where sellers previously entered the market aggressively. If bullish momentum remains strong and this resistance is broken, NASDAQ could continue its recovery toward the major Resistance around 30,050, followed by the higher-timeframe Strong Order Block Zone near 30,250–30,350.
From a Smart Money Concepts perspective, the sequence of sell-side liquidity sweep, Fair Value Gap mitigation, and strong bullish rejection provides a high-probability reversal scenario. However, traders should wait for confirmation through bullish market structure and sustained buying momentum before expecting continuation. A decisive breakdown below the Fair Value Gap and the sell-side liquidity zone would invalidate the bullish setup and increase the likelihood of further downside.
Overall, the current chart suggests that NASDAQ is attempting to transition from a bearish correction into a new bullish phase. The combination of Sell-Side Liquidity, Fair Value Gap support, Market Structure Shift potential, and higher-timeframe Order Block targets makes this a strong recovery setup that traders should monitor closely over the coming sessions.
Market indices
BankNifty levels - Jul 21, 2026Utilizing the support and resistance levels of BankNifty, along with the 5-minute timeframe candlesticks and VWAP, can enhance the precision of trade entries and exits on or near these levels. It is crucial to recognize that these levels are not static, and they undergo alterations as market dynamics evolve.
The dashed lines on the chart indicate the reaction levels, serving as additional points of significance. Furthermore, take note of the response at the levels of the High, Low, and Close values from the day prior.
We trust that this information proves valuable to you.
* If you found the idea appealing, kindly tap the Boost icon located below the chart. We encourage you to share your thoughts and comments regarding it.
Wishing you successful trading endeavors!
KOSPI , IdeaThe rally left a textbook trail: higher highs, breaks of structure, momentum riding comfortably above the long-term average. Then came the change of character, followed by a break of structure to the downside, and now price trades near the 7,000 KRW area, below the level that used to hold it up. The weak high near 9,800 KRW is exactly that: weak, and unclaimed.
The map from here:
Scenario 1: price dips first into the zone of interest around 5,700 KRW, gathers demand, and rotates up into the supply area near 8,500 KRW. The weak high territory would be the natural magnet, but supply gets the first word.
Scenario 2: the mirror image. Price rallies into the 8,500 KRW supply first, gets rejected, and rotates back down to the 5,700 KRW zone. Same destinations, opposite order.
The sweep: below the zone of interest sits the strong low, wrapped in liquidity around the 4,800 to 5,000 KRW region. A dip into that pool followed by a sharp reclaim would be the classic institutional move, take the stops, then reverse.
The breakdown: if the strong low fails, the structural story changes completely. A much deeper liquidity pool waits near 2,300 KRW, and the path to it is long, fast, and unfriendly. Low probability until proven otherwise, but it stays on the map because ignoring tail scenarios is how accounts disappear.
Change of character is a warning, not a verdict. We let the zones vote first.
Hidden in plain sight. EQC.
Follow, Boost, Join, Thank You!
Financial Disclaimer: This post is not financial advice. I am not your financial advisor, your life coach, or your legally responsible adult. Always do your own research and never trade based solely on internet comedy.
DXY H1 | Buying Pressure at 50% Fib SupportThe price is falling to our buy entry level at 100.85, which is a pullback support that aligns with the 50% Fibonacci retracement.
Our stop loss is set at 100.67, which is a pullback support.
Our take-profit is set at 101.15, which is a pullback resistance.
High Risk Investment Warning
Stratos Markets Limited fxcm.com Stratos Europe Ltd, fxcm.com CFDs are complex instruments and come with a high risk of losing money rapidly due to leverage. 69% of retail investor accounts lose money when trading CFDs with this provider. You should consider whether you understand how CFDs work and whether you can afford to take the high risk of losing your money.
Stratos Global LLC fxcm.com Losses can exceed deposits.
Please be advised that the information presented on TradingView is provided to FXCM (‘Company’, ‘we’) by a third-party provider (‘TFA Global Pte Ltd’). Please be reminded that you are solely responsible for the trading decisions on your account. Any information and/or content is intended entirely for research, educational and informational purposes only and does not constitute investment or consultation advice or investment strategy. The information is not tailored to the investment needs of any specific person and therefore does not involve a consideration of any of the investment objectives, financial situation or needs of any viewer that may receive it. Past performance is not a reliable indicator of future results. Actual results may differ materially from those anticipated in forward-looking or past performance statements. We assume no liability as to the accuracy or completeness of any of the information and/or content provided herein and the Company cannot be held responsible for any omission, mistake nor for any loss or damage including without limitation to any loss of profit which may arise from reliance on any information supplied by TFA Global Pte Ltd.
Stratos Trading Pty. Limited fxcm.com Trading FX/CFDs carries significant risks. FXCM AU (AFSL 309763), please read the Financial Services Guide, Product Disclosure Statement, Target Market Determination and Terms of Business at fxcm.com
Kospi short squeezeA little lower, and I think we'll get a bounce for a few days. This means likely we will have a bounce on the indexes as well although maybe not as strong. I would especially watch for SOXX and QQQ to outperform to the upside if the Kospi gets a strong bounce.
This is a volatile and risky trade but I think the setup is there.
Could we see a drop from here?Dow Jones (US30) is rising towards the pivot, which is a pullback resistance and could reverse toward the 1st support.
Pivot: 52,274.90
1st Support: 51,128.90
1st Resistance: 53,332.40
Disclaimer:
The opinions given above constitute general market commentary and do not constitute the opinion or advice of IC Markets or any form of personal or investment advice.
Any opinions, news, research, analyses, prices, other information, or links to third-party sites contained on this website are provided on an "as-is" basis, are intended to be informative only, and are not advice, a recommendation, research, a record of our trading prices, an offer of, or solicitation for, a transaction in any financial instrument and thus should not be treated as such. The information provided does not involve any specific investment objectives, financial situation, or needs of any specific person who may receive it. Please be aware that past performance is not a reliable indicator of future performance and/or results. Past performance or forward-looking scenarios based upon the reasonable beliefs of the third-party provider are not a guarantee of future performance. Actual results may differ materially from those anticipated in forward-looking or past performance statements. IC Markets makes no representation or warranty and assumes no liability as to the accuracy or completeness of the information provided, nor any loss arising from any investment based on a recommendation, forecast, or any information supplied by any third party.
NIFTY SENTIMENT ANALYSIS FOR 20/07/2026📊 NIFTY Daily Sentiment Analysis | 20 July 2026 | Time & Price Outlook
Every trading session begins with a question:
Who is in control—buyers or sellers?
Instead of waiting for indicators to react, I prefer identifying the market's Opening Character and then validating whether Time and Price continue to support that narrative.
Today's Opening Character
🟢 Bullish
⚡ Behaviour: Explosive
📈 CE Dominance at the Open
This combination suggests that buyers entered the session with strength, but the day is likely to witness sharp intraday swings before revealing its true direction.
Key Price Levels
Opening Anchor
📍 24,194.80
Resistance
R1️⃣ 24,250.80
R2️⃣ 24,306.80
R3️⃣ 24,362.80
Support
S1️⃣ 24,138.80
Market Signature
• CE Open: 120
• PE Open: 106
Sector Leadership
🥇 Infrastructure & Metals
🥈 Energy
🥉 FMCG
Important Time Window
⏰ 2:20 PM
This is the final anchor time I'm watching today.
If buyers continue defending the Opening Anchor (24,194.80) into this window, the probability of a late-session expansion increases.
Roadmap
24,138.80
⬇️
24,194.80
⬇️
24,250.80
⬇️
24,306.80
⬇️
24,362.80
The market doesn't move because we think it should.
It moves when Time and Price agree.
This analysis is shared before the outcome—not after it.
Let's revisit it after the closing bell.
Educational analysis only. Not investment advice.
#NIFTY #TradingView #TimeAndPrice #PriceAction #TechnicalAnalysis #Nifty50 #MarketSentiment #IntradayTrading #StockMarket #Trading
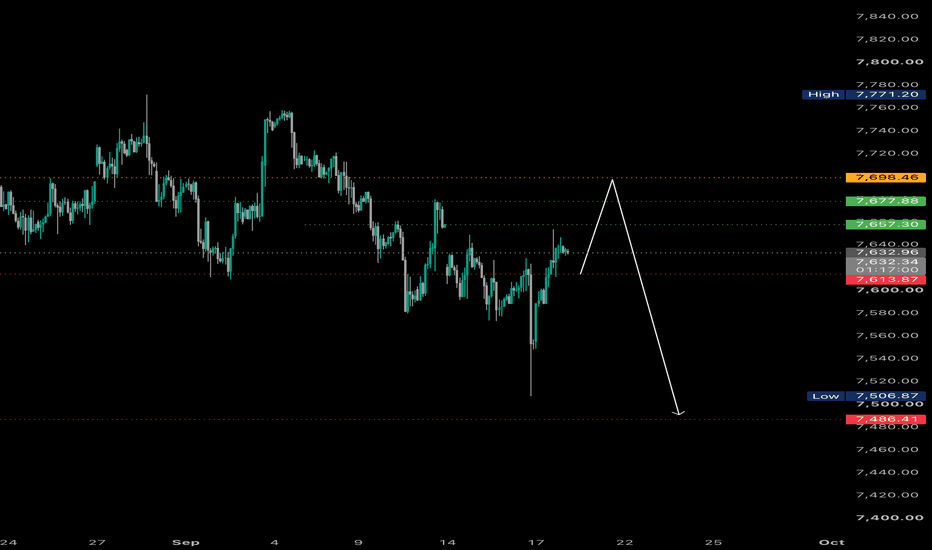
Monday's possible trapA move down in futures may occur, but bears need to be cautious if they get down to 7400 by the open on Monday. The RSI is very low already on mid time frames and shorter time frames are setting up for bullish divergences. My target of 7600+ never got hit, and it often is the case that the target gets hit after it seems that the market missed it.
have a good weekend and see you Monday
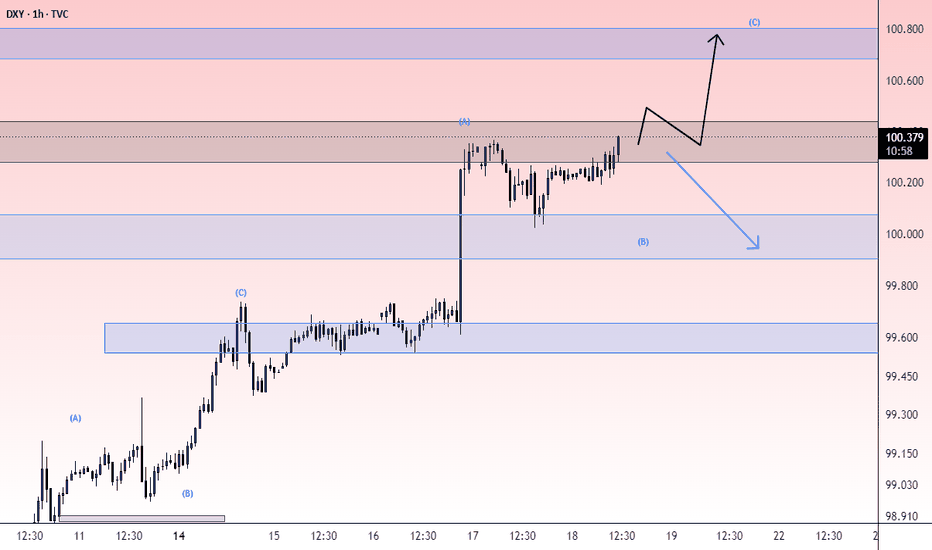
Bullish bounce at 38.2% Fib support?US Dollar Index (DXY) is falling toward the pivot, which is a pullback support that aligns with the 38.2% Fibonacci retracement and could bounce toward the 1st resistance.
Pivot: 100.28
1st Support: 99.51
1st Resistance: 101.80
Disclaimer:
The opinions given above constitute general market commentary and do not constitute the opinion or advice of IC Markets or any form of personal or investment advice.
Any opinions, news, research, analyses, prices, other information, or links to third-party sites contained on this website are provided on an "as-is" basis, are intended to be informative only, and are not advice, a recommendation, research, a record of our trading prices, an offer of, or solicitation for, a transaction in any financial instrument and thus should not be treated as such. The information provided does not involve any specific investment objectives, financial situation, or needs of any specific person who may receive it. Please be aware that past performance is not a reliable indicator of future performance and/or results. Past performance or forward-looking scenarios based upon the reasonable beliefs of the third-party provider are not a guarantee of future performance. Actual results may differ materially from those anticipated in forward-looking or past performance statements. IC Markets makes no representation or warranty and assumes no liability as to the accuracy or completeness of the information provided, nor any loss arising from any investment based on a recommendation, forecast, or any information supplied by any third party.
US30: Parabolic SAR flips. A/D divergence. Fib levels set. Short📊 Trade Plan:
🔻 Entry: 52930
🛑 Stop Loss: 53550
🎯 Take Profit 1: 52420 (above 0.236 Fib)
🎯 Take Profit 2: 51860 (above 0.382 Fib)
📉 Technical Picture (H4 & Daily):
Parabolic SAR: Dots have flipped above price. Trend signal turned bearish.
Accumulation/Distribution: Divergence — price making higher highs, A/D making lower highs. Smart money distributing, not accumulating.
Fibonacci: Grid drawn from swing low to swing high. TP1 sits just above the 0.236 level, TP2 just above 0.382.
🗞️ Fundamental Note:
Dow futures are climbing after weak NFP data tempered September rate hike expectations — now at 45%, down from 48.3% a week ago. The Dow rallied nearly 2% last week to fresh records, driven by defensive sectors. But FOMC Minutes Wednesday could shift the narrative.
❌ Invalidation:
A daily close above 53550 invalidates the Parabolic SAR flip and voids the short setup.
NASDAQ100 /TEC100 LET BUY LONGTeam, today I actually went long couple of position during European session at 28650 range and got out before the US market opening.
However, it is time for us to enter
LONG/BUY NAS at 28720-28705
STOP LOSS at 28620
Target 1 at 28765-28786
Target 2 at 28805-28867
LETS GO
NIFTY Levels for july 21, 2026Bank Nifty Technical Outlook for July 21, 2026:
Support Levels:
- Immediate Support: 24,135 (Monday’s intraday low); critical for bulls to hold to prevent further unwinding.
- Psychological Floor: 24,000; supported by significant Put open interest, acting as a key safety net.
- Positional Floor: 23,830; aligned with the 50-day moving average cluster.
Resistance Levels:
- Immediate Hurdle: 24,266 (Monday’s high); a decisive breakout above this level is likely to trigger short-covering.
- Major Ceiling: 24,367 (Friday’s swing high); a clean move above this level is required to restore the bullish trend
[US500] Testing the EMA Cluster: Watching the 200-period FloorCurrent Status:
Unlike JP225, US500 is still trading above the EMA 200 (Red). While the EMA 20/50 Death Cross suggests a bearish tide shift, the EMA 200 remains a critical support level for now. A definitive break below this line will significantly increase the edge for shorts.
Strategy:
Price is currently testing the intersection of EMA 20 and 50 (Yellow circle). I am initiating a Probe Short at this resistance zone to observe if the market has enough momentum to break the EMA 200.
Action Plan:
Maintaining the probe position with the Invalidation Level at 7,588.40. If the price breaks below the EMA 200, I will prepare for a potential move toward the Key Support at 7,226.20.
Summary:
Even in a strong index, we do not ignore the "Tide" shown by the EMAs. Stick to the facts at the levels and manage risk with discipline.
#US500 #SPX500 #TechnicalAnalysis #PropFirm #AestheticsOfSubtraction
SPX Macro Outlook: Liquidity, Equity Supply & ReloadExecutive Summary
The S&P 500 continues to trade within a powerful secular bull market, supported by resilient earnings, persistent AI-driven capital expenditure and improving macroeconomic conditions. While I remain constructive on the longer-term trend, I believe the market is entering a phase where risk-reward has become increasingly asymmetric.
Rather than calling for the end of the bull market, my base case is for a healthy corrective phase that allows the market to absorb increasing equity supply, rebalance positioning and establish a stronger foundation for the next expansion higher.
The area between 6,650–6,750 represents the primary region I’ll be monitoring for evidence of institutional demand.
⸻
Technical Structure
The current advance has been characterised by aggressive momentum and limited price acceptance.
Since breaking above previous resistance, the index has moved rapidly into price discovery, leaving behind a large low-volume inefficiency where very little trading occurred.
Markets rarely move in straight lines indefinitely.
When price advances too quickly without establishing fair value, those areas frequently become magnets during future corrections as buyers and sellers seek equilibrium.
The highlighted 6,650–6,750 zone is significant because it represents multiple layers of technical confluence:
• Previous resistance that may now become support.
• Origin of the impulsive breakout.
• A low-volume imbalance where price failed to establish meaningful acceptance.
• An institutional demand zone where longer-term buyers may look to re-enter.
A retracement into this region would represent approximately a 10% correction, a move that has historically been common during secular bull markets and would not, on its own, alter the long-term trend.
⸻
Momentum & Positioning
From a positioning perspective, the market appears increasingly stretched.
Current observations include:
• Extended momentum.
• Elevated investor optimism.
• Compressed volatility.
• Limited evidence of meaningful profit-taking.
• Overbought conditions across multiple momentum measures, including my proprietary RSI framework.
These conditions do not signal an immediate reversal.
However, they reduce the margin of safety for initiating new long exposure and increase the probability that a catalyst could trigger a healthy repricing.
⸻
The Liquidity Thesis
The core of this thesis is not valuation.
It is liquidity.
Over the next 12–18 months, public markets may be required to absorb one of the largest increases in tradable equity supply in recent history.
Potential contributors include:
• Mega-cap IPOs.
• Lock-up expirations.
• Employee share sales.
• Venture capital distributions.
• Founder diversification.
• Secondary offerings.
• Private equity exits.
• Increasing free float across recently listed companies.
While additional supply does not automatically result in lower prices, markets ultimately operate through supply and demand.
Periods where tradable equity expands meaningfully have historically coincided with increased volatility, portfolio rebalancing and temporary valuation compression as institutions absorb additional supply.
⸻
Why SpaceX Matters
SpaceX serves as an example of this broader dynamic.
The IPO itself is not the thesis.
The key consideration is the gradual increase in tradable float following lock-up expirations.
As employees, early investors, venture funds and founders progressively monetize portions of their holdings, institutions must absorb that additional supply.
Now extend that dynamic across multiple large private companies expected to reach public markets over the coming years.
Rather than focusing on any individual company, I’m focused on the aggregate expansion in tradable equity available to the market.
⸻
Q1–Q2 2027
One period I’ll be monitoring particularly closely is Q1–Q2 2027.
This window has the potential to combine several liquidity events simultaneously:
• IPO lock-up expirations.
• Employee monetisation.
• Venture capital distributions.
• Institutional portfolio rebalancing.
• Profit-taking following a historically strong bull market.
• Additional secondary offerings.
None of these individually imply a correction.
Together, however, they create conditions where liquidity could temporarily tighten while equity supply expands.
⸻
Watch The 200 EMA
One technical level deserves particular attention.
The 200-day Exponential Moving Average has historically acted as an important trend filter during secular bull markets.
Rather than reacting to the first test, I’ll be watching how price behaves around it.
A decisive loss of the 200 EMA, particularly if accompanied by weakening breadth, expanding downside volume and deteriorating momentum, would increase the probability that institutional de-risking is underway.
Conversely, a successful defence or reclaim of the 200 EMA would reinforce the view that any correction remains cyclical rather than structural.
⸻
My Roadmap
Phase 1 — Price Discovery (Current)
Level: 7,300–7,500
Characteristics:
• Momentum remains elevated.
• Retail participation expands.
• AI optimism continues.
• Volatility remains compressed.
• Market becomes increasingly overextended.
⸻
Phase 2 — Distribution
Level: 7,200–7,450
Watch for:
• Momentum divergence.
• Distribution volume.
• Weakening breadth.
• Institutions reducing exposure.
• Increasing volatility.
⸻
Phase 3 — Liquidity Repricing
Level: 7,000 → 6,750
Potential catalysts:
• Equity supply expansion.
• IPO lock-up expirations.
• Profit-taking.
• Portfolio rebalancing.
• Systematic selling.
• 200 EMA under pressure.
⸻
Phase 4 — Institutional Reload
Primary Zone: 6,650–6,750
This becomes the area where I’ll be looking for:
• Higher lows.
• Strong buying volume.
• Failed breakdowns.
• Improving breadth.
• Momentum stabilisation.
• Institutional accumulation.
⸻
Phase 5 — Expansion
If buyers successfully absorb supply within the reload zone:
• Market rebuilds value.
• Liquidity normalises.
• Trend resumes.
• New all-time highs become the next objective.
⸻
What Invalidates This View?
This thesis becomes less compelling if:
• Breadth continues improving.
• Liquidity conditions remain exceptionally supportive.
• Equity supply is absorbed without meaningful volatility.
• Price continues accepting above recent highs while momentum remains healthy.
Markets are adaptive.
This is a framework, not a prediction.
⸻
Conclusion
I remain structurally bullish on U.S. equities over the long term.
However, after an exceptional advance, I believe the market is approaching a period where capital preservation becomes just as important as capital appreciation.
Rather than chasing momentum into price discovery, I’m focused on identifying where institutions are most likely to absorb expanding equity supply and rebuild long exposure.
For me, that area remains 6,650–6,750.
If price retraces into that region while liquidity tightens and market internals begin stabilising, I believe it has the potential to become the foundation for the next leg of the secular bull market.
By Zachary Watters
SPX500 | Bearish Pressure as AI Selloff DeepensSPX500 | Bearish Pressure as AI Selloff Deepens
U.S. stock futures moved lower as the global AI-related selloff extended, with investors taking profits after the sector's strong rally. Meanwhile, renewed U.S.-Iran strikes kept oil prices elevated, adding to inflation concerns and weighing on overall market sentiment.
Technically
The price remains under bearish pressure while trading below 7503.
As long as price remains below this level, bearish momentum is expected to continue toward 7442, and a break below this support would expose 7383, followed by 7260.
However, a breakout and stability above 7503 would invalidate the immediate bearish outlook and support a recovery toward 7526 and 7572, especially if geopolitical tensions begin to ease.
Support: 7442 – 7383 – 7260
Resistance: 7503 – 7526 – 7572
Buy at US30 buy-side liquidity zoneWe have a possible buy on the US30 once it breaks above the liquidity zone of last Friday's low, with a good daily structure since the masses are following a bearish trend — most likely the institution will look to buy at the liquidity zone. And if we do good backtesting, every time the US30 breaks below a low during New York session hours in the past 3 or 4 weeks, it generates a bullish reversal. Therefore I'll look to measure this day's buy using a Fibonacci to enter at the 1.61 level.
- Liquidity zone
- MACD divergence
- Daily Structure
- 1.61 Fibbo
Japan 225 ($JP225) Daily: Pullback to Major AscendingJapan 225 ( FOREXCOM:JP225 ) Daily: Pullback to Major Ascending Support Confluence Offers High-Asymmetry Long Setup
### 🇯🇵 Japan 225 CFD Daily Technical Matrix (Ref: JP225_2026-07-20_09-09-25.png)
We are releasing a high-probability tactical long study on the Japan 225 Index ( FOREXCOM:JP225 ) on the Daily (1D) interval. Following a healthy multi-week corrective phase from its July peaks near 73,000+, the benchmark index has plummeted into a major institutional demand matrix, unlocking an asymmetric buy-the-dip configuration.
The index is showing early signs of buy-side absorption today, trading up at **65,116 (+0.29%)**.
---
### 🔍 Technical Architecture & Support Confluence:
Our technical framework isolates a powerful confluence zone where multiple dynamic and structural layers intersect:
1. **The Macro Ascending Support Line (LTA):** The primary red diagonal trendline originating from the March/April structural lows remains fully intact. Price action is currently kissing this key behavioral line.
2. **The 72-period SMA Dynamic Cushion:** The index is embedding directly into the **72-period SMA cluster (tracked between 64,719 and 65,195)**. This moving average ribbon acts as a reliable trend-continuation filter during bull market pullbacks.
3. **Institutional Trend Health:** The long-term institutional trend remains strongly bullish, as price action continues to trade safely above the ascending **200-period EMA (purple line at 57,759)**.
---
### 🎯 Systematic Trade Execution Blueprint:
Given the precise structural defense displayed at this baseline, the asymmetry heavily favors a counter-attack from buyers:
* **Tactical Entry Zone:** Around the **65,383** structural retest corridor.
* **Protective Stop Loss:** Placed strictly below the dynamic support invalidation threshold at **62,645**. This invalidation anchor sits underneath the lowest ribbon of the 72-SMA complex.
* **Primary Target (Range Expansion):** The upside target is set at **70,860**, aiming to capture the swing-high continuation toward the upper boundary of the macro bullish structure.
### 📊 Tactical Parameters Summary:
* **Trend Bias:** Bullish Pullback (Buy the Dip)
* **Execution Trigger:** Long position entry near current support structure (~65,383)
* **Invalidation Anchor (Stop Loss):** 62,645
* **Primary Profit Target:** 70,860
---
📊 **ChartPro Data**
*Index Structural Architecture, Role-Reversal Sourcing & Systematic Risk Frameworks.*
⚠️ **Disclaimer:** For educational and informational purposes only. This active market study represents a personal trading framework and does not constitute financial or investment advice.
GER40 Trade RecapThis trade was beautiful this morning, thought I'd do a quick recap on my logic behind this move.
Interim HTF bullish, so was looking for longs this morning. Price swept below the Asian lows / Equal lows, saw a bit of bullish momentum start on the 5m chart, and then simply targeted towards the Asian highs.
Forecast was simple as that :)
- Aman
DXY | Q3 2026 | Day ChartIts good to keep an eye on DXY
A 4hr / daily timeframe accumulation trend created 27 Jan in Q1 & confirmed the first week of May with 5 days using the trend as its support friend. Enough investors in Long pants were able to get some price action above the monthly support at $99.42 resistance and use it as support to keep their accumulation trend going.
price action today is under a daily Frontside candle which is often used as a target so those investors waiting there are R.A.T.S using the support candle as resistance and calling a "Rejection As target" to exit their scalps, abandon the long pant party and put on some shorts.
it all depends if the the Long Pant investors can destroy the R.A.T's or not. If so, they march victoriously to $104 - $105.
If not, then investors in short's take it down to trend and the 4hr BackSide range will be the last hope at $99.791 to support the accumulation trend.
When trends break, price action targets the base of the trend, called the "vertex".
The Vertex of any trend is protected by the BackSide or FrontSide of the range - Support range or Resistance range.
When a BackSide candle or BackSide of the range is tested, price action is expected to show a strong reaction - i.e long wicks to or away from level. big body "engulfing" candles, leaving F.V.G's and creating another vertex for a high angle trend.
The FrontSide of the range shows a more subtle reaction, a low angle trend that ladders slowing in the direction of the trend.
4 candles:
BackSide = Supports high angle trends
FrontSide = Supports low angle trends.
(Inv.BS) Inverse BackSide = Resistance, supports high angle distribution trends. the inverse of the BackSide support Candle
Inv.FS) Inverse FrontSide = Resistance, supports low angle distribution trends. The inverse of the FrontSide support candle.
A Range is 2 or more consecutive candles of the same color. The BackSide candle or Inv.Backside is always the first candle of that range.
The FrontSide or Inverse FS is always the last candle of that range.
4 candles, 4 levels illustrating the structure of the market with a methodical, data driven approach.
If the expectations are not met, then price action is targeting a different range than the one you chose to look at. Opportunities to exit usually present themselves by the same science. Strength favors the higher timeframes.
-----------------------------------
Multiple Time-Frame Analysis; Color Code | Strength favors the higher timeframe.
Yearly timeframe = black
Monthly timeframe = pink
weekly = grey
daily = red
4hr = orange
1hr = yellow
15min = blue
5min = green if they are shown. (Level visibility on intervals is set to timeframe the level was found on and below to keep chart view organized.)
** Candle Science explained **
A Range = two or more consecutive color candles.
There are two types of ranges - accumulation and distribution.
DISTRIBUTION RANGES DEFINED:
When price is above a distribution range, these candles/levels act as support.
(BS) BACKSIDE Candle - First distribution candle in a distribution range. Expectation = strong reaction to price. long wicks reaching to or away from level.
(FS) FrontSide Candle - Last distribution candle in a distribution range. Expectation = reversal, create a trend in the opposite direction. Distribution candles are used as support.
ACCUMULATION RANGES DEFINED: When price is below an accumulation range, these candles/levels act as resistance.
INVERSE BACKSIDE (Inv.BS) - First Accumulation candle in an accumulation range. Expectation. = strong reaction to price. long wicks reaching to or away from level.
INVERSE FRONTSIDE (Inv.FS) - Last accumulation candle in an accumulation range. Expectation = reversal, create a trend in the opposite direction. Accumulation candles are used as resistance.