VIX 4H: 15.72 Body Break Is the GateVIX 4H — Current Structure
This week opened with a hold near 15.72 and a bounce. Before FOMC, VIX broke the recent swing high at 18.17 and printed 18.94. The FOMC itself was hawkish, but VIX reversed lower right after the Warsh press conference while US500 bounced. The decline continued on Sep 18. 14.77 held as support and the session closed at 14.80. I treat 18.94 as an event high that has been digested, not as a new structural high.
Monday scenario
Sunday crude is around $97 (WTI ~$96 / Brent ~$99). Middle East and Europe geopolitical risk remains, but I will not use that alone as a spike thesis. The first level that matters is VIX resistance at 15.72. A confirmed 4H body break opens 16.30, then 16.82. Only if crude holds above $100 do I allow a geopolitics-driven spike case, and in that case 18.94 comes back into view. If crude fails to hold $100 and VIX cannot print a 4H body through 15.72, 18.94 stays classified as noise.
Levels
Support: 14.77 (next 14.13 / 13.80)
Resistance: 15.72 (next 16.30 / 16.82)
Crude alert line: $100
Plan
VIX 4H structure alone is not enough to call risk-off or risk-on for US500. I read 18.94 as FOMC noise. Existing US500 shorts stay on. No new adds on Monday. Structure confirmation is a 4H body break of 15.72. Crude at $100 is a secondary filter, not a standalone reason. A 4H closing body through 14.77 is a warning. A break of 14.13, then 13.80, shifts the stance to stand aside.
#VIX #US500 #SP500  Short
Short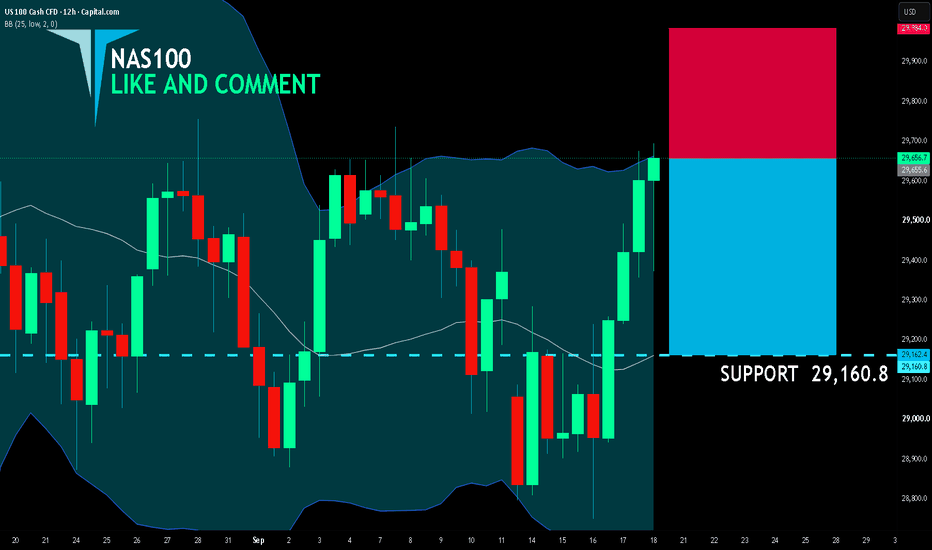
 Long
Long
NASDAQ Pre-Market Range Sweep Indicator: Weekly Review Sep 14–18How the NASDAQ Pre-Market Range Sweep indicator performed this week
This week, I want to look at how the NASDAQ Pre-Market Range Sweep indicator worked in real market conditions — what signals it gave, how I used them, which trades worked, which ones didn’t, and what we can learn from each setup.
The point of this weekly review is not to show only perfect trades. I want to use the actual signals from the indicator to explain how I work with risk-to-reward, targets, signal timing, the statistics table, trade management, and the range levels themselves.
The indicator builds the pre-market range from 8:00 a.m. to 9:00 a.m. New York time and then looks for qualified sweeps and returns back into the range.
The signal itself is only the beginning.
We still need to look at the available risk-to-reward, the distance to the next logical target, the statistics, the time since the range was formed, and what price is actually doing around the range.
Let’s go through the week day by day.
Monday — September 14
Monday gave us a beautiful example of how I use the indicator when the first target is only the beginning of the move.
After the sweep below the pre-market range, the indicator gave us a BUY signal.
Entry → 28844
Stop Loss → 28804
First target → 28879
Next major range level → 29185
The first target gave approximately 0.88R.
At this point, one way to manage the trade is to take partial profit, protect the remaining position at breakeven, and let the market show us whether it wants to continue.
And this is important.
I am not going to put the target at the very top of the move afterwards and pretend that we knew exactly where price was going to stop.
We didn’t.
A lot of traders were waiting for the gap to be completely filled. But the gap was not completely filled.
For me, there was already a logical level on the chart — the upper boundary of the previous day’s range at 29185.
Price reached that level.
From the original entry, that move was approximately 8.5R.
What can we learn from this setup?
The first indicator target can be used to take partial profit and protect the trade. If price continues, I prefer to work with the next logical levels already visible on the chart rather than inventing a perfect target afterwards.
If we are trading a system, we should understand the levels that system gives us and use them consistently.
It doesn’t matter what happened afterwards.
We trade the levels we can actually see at the time.
Tuesday — September 15
Tuesday was very different, and that makes it just as useful for understanding the indicator.
The first BUY reached the indicator target, but the risk-to-reward was not particularly attractive.
Entry → 29112
Stop Loss → 29065
The pre-market range was narrow, and the available distance to the target was less than 1R.
What can we learn from this setup?
A signal does not automatically mean that I have to enter a trade.
Before entering, I look at the distance between the entry, the stop and the available target.
If the indicator gives me a valid setup but the available reward is too small compared with the risk, I can simply skip it.
If I have additional confirmation from the market — for example, from volume — and still decide to enter, I can manage the trade toward 1:1 instead.
The indicator target was reached here, but that does not automatically make it a good trade for me.
There was also another BUY signal later:
Entry → 28987
Stop Loss → 28924
Target → 29091
The full move to the target was approximately 1.65R.
But there is an important detail.
For this weekly review, I extended the Signal Window to 360 minutes so we can see what happened later in the session.
In actual trading, I normally use 120 minutes.
Why?
Look at the statistics table.
The current average time to reach the opposite boundary of the range is approximately 110 minutes.
That statistic is useful.
If the moves that successfully reach the opposite side take around 110 minutes on average, I don’t see much reason to sit in front of the chart all day waiting for another signal.
With a 360-minute window, we can see this second BUY and study what happened.
With my normal 120-minute setting, I would not have taken it.
And the target itself was reached only later, on the following day.
This is exactly why the statistics table is there.
It is not just something to display in the corner of the chart. I use it to decide how I configure and trade the indicator.
Wednesday — September 16
Wednesday was much more interesting.
There were several opportunities around the range.
The first SELL was stopped out.
Entry → 29163
Stop Loss → 29217
Result → -1R
Nothing to hide here.
It was a valid setup, the stop was tight, and price took it.
A stop loss is part of the system.
Then we had another SELL:
Entry → 29228
Stop Loss → 29295
Target → 29098
This one worked beautifully.
Price returned through the range and reached the opposite side.
The move from the entry to the target was approximately 1.94R.
This is also a good example of why the position of the stop matters.
Even with the expected FOMC volatility, the high above this setup was not taken before price moved down.
Later, during the FOMC move, there was another beautiful opportunity when price started returning into the range.
If you decide to trade FOMC volatility, this was another setup that could be managed using the same range logic.
Personally, I don’t like trading FOMC, so I am not adding this opportunity to my normal trading result.
But for an educational review, it is absolutely worth looking at.
And now look at where the FOMC move eventually went.
It came back to the old Monday range.
Price broke through the upper boundary of Monday’s range, moved through it, reached the lower boundary of that same range — and that is where the move stopped and reversed.
This is why I keep old range levels on the chart.
A range does not necessarily become useless when the trading day ends.
Monday’s range was still giving us meaningful reference levels two days later, during one of the most volatile events of the week.
These levels are there for a reason.
Thursday — September 17
Thursday gave us a completely fair stop loss.
Entry → 29491
Stop Loss → 29508
Result → -1R
Again, it was a very short stop, but price took it.
After that, the indicator did not give us another signal.
Later, price moved back into the range and there was a beautiful opportunity that was quite easy to see with our own eyes.
But the indicator did not give that signal.
So I am not going to count it as an indicator trade.
What can we learn from Thursday?
The indicator follows strict conditions.
It is not designed to put a BUY or SELL label on every move that looks good afterwards.
And I don’t want it to.
The indicator gives the setup.
The chart gives the context.
And we still have our eyes.
Sometimes we will see an opportunity that the strict indicator logic does not give us.
That is completely normal.
Friday — September 18
Friday finished the week with two good BUY signals.
The first BUY:
Entry → 29537
Stop Loss → 29500
Target → 29588
The move to the indicator target was approximately 1.38R.
This is the type of setup where I still look at the available risk-to-reward before entering.
If market conditions support the setup, I want at least around 1:1 rather than taking a trade simply because a BUY label appeared.
This one gave us more than 1R.
Then came the second BUY:
Entry → 29467
Stop Loss → 29407
Opposite range boundary → 29596
This is a very good example of how I like to manage a successful return into the range.
Price returned inside, reached the first partial target and then continued toward the opposite side.
At the first target, we could take partial profit and move the remaining position to breakeven.
Breakeven was never touched.
The remaining position could stay open all the way to the opposite boundary.
From entry to that level, the full move was approximately 2.15R.
What can we learn from this setup?
The first target does not necessarily have to end the trade.
First target → consider taking partial profit.
Then → protect the remaining position.
After that → give the trade an opportunity to reach the next logical range level.
We never know beforehand whether the market will give us 1R, 2R or much more.
That is why trade management is just as important as the signal itself.
So how did the indicator perform this week?
With my normal trading approach and the 120-minute signal window, there were seven main indicator setups to evaluate during the week.
Four produced moves of at least 1R or more:
→ Monday — approximately 8.5R to the next major range level
→ Wednesday — approximately 1.94R
→ Friday first BUY — approximately 1.38R
→ Friday second BUY — approximately 2.15R
Tuesday’s first setup reached the indicator target, but the available reward was below 1R.
Two setups were stopped out:
→ Wednesday
→ Thursday
Tuesday also produced another profitable BUY when I extended the Signal Window to 360 minutes, but I do not include that in my normal trading result because my actual setting is 120 minutes.
Wednesday also gave another beautiful opportunity during FOMC, but I personally prefer not to trade FOMC, so I am not adding that one to the normal result either.
And this is exactly why I like reviewing the entire week instead of choosing only the best screenshots.
We can see what worked.
We can see what didn’t.
And, more importantly, we can understand why.
How I use the NASDAQ Pre-Market Range Sweep indicator
1. I let the pre-market range form from 8:00 a.m. to 9:00 a.m. New York time.
2. I wait for a qualified sweep and a valid return setup.
3. Before entering, I compare the stop with the available target. A valid signal with poor risk-to-reward can still be a trade I skip.
4. I use the statistics table. My normal Signal Window is 120 minutes, and the current average time to reach the opposite range boundary is around 110 minutes.
5. At the first logical target, I can take partial profit and protect the remaining position.
6. If price continues, I look at the next logical range level rather than inventing a perfect target afterwards.
7. I keep previous range levels on the chart because, as Wednesday showed us, an old range can still become important several days later.
8. And I still use my eyes. The indicator gives me a repeatable structure, but it does not replace the trader.
Final thoughts
Monday showed us how a small first target can develop into a much larger move when we manage the remaining position.
Tuesday showed us why a valid signal is not enough if the risk-to-reward is poor — and why the statistics table can help us choose a sensible trading window.
Wednesday showed us both sides of trading: a stop loss, a beautiful full range return, another opportunity during FOMC, and an old Monday range that was still relevant two days later.
Thursday reminded us that not every good-looking move will produce an indicator signal.
And Friday gave us two clean examples of managing BUY setups back into the range.
That is the purpose of these weekly reviews.
Not to find perfect trades afterwards, but to understand how the indicator behaves in different market conditions and how we can use the information it gives us.
The indicator gives the structure.
The statistics give the context.
But the trader still has to decide where the stop makes sense, where to take partial profit, and when the trade is no longer worth holding.
Curious which level will become important for price on Monday? 🙂
Very simple indicator. Very simple strategy.
Please use it, enjoy it, and be profitable next week. Education 
Long 
Nifty September 4th Week Analysis ( Detailed Analysis )Nifty’s weekly close at 23,346 is not very optimistic for the bulls. It is the 7th consecutive red bar on the Nifty weekly chart, which is not very common. Global uncertainties are making the bull case weak. If we get any positive news flow in the upcoming week, we can expect a possible rebound from the 23,300–23,000 zone.
The important level for bears is last week’s low at 23,117. If bears are able to grip this level, we can expect further retracement up to 22,928–22,840.
If Nifty bulls activate and manage to cross and sustain above the base level of 23,400–23,460, we can expect positive momentum.
All levels are marked in the chart posted.
Banknifty September 4th Week Analysis.Bank Nifty is looking neutral for the upcoming week. Currently, bears have a better grip over the bulls, but in the past two weeks, they could not hold the 55,950–55,724 zone. This indicates that if bulls manage to claim the 56,535–56,700 zone, the uptrend can continue further up to 57,394+. If bears succeed in gripping the 55,950–55,724 zone, further retracement is possible.
All levels are marked in the chart posted.
#BankNifty - 4000 points move expected?Date: 20-09-2026
#Bank Nifty Current Price: ₹ 56,358.70
Pivot Point: ₹ 56,347.90
Support: ₹ 55,420.95
Resistance: ₹ 57,281.33
Upside Levels:
L1: ₹ 58,111.52
L2: ₹ 58,941.70
L3: ₹ 59,914.38
L4: ₹ 60,887.05
Downside Levels:
L1: ₹ 54,587.53
L2: ₹ 53,754.10
L3: ₹ 52,781.43
L4: ₹ 51,808.75
#Nifty #BankNifty #Tradingview  Short
Short
NDQ: Bullish Breakout Awaiting ConfirmationThe Nasdaq 100 maintains a constructive broader structure, while the H1 and H4 timeframes show improving bullish momentum. Price is now approaching an important resistance area, where confirmation is required before the next directional move.
The index is currently testing the immediate resistance near 29,648.66. Although the recovery remains constructive, a sustained breakout has not yet been confirmed.
RSI analysis:
RSI is improving across the observed timeframes and supports the bullish recovery scenario. However, momentum alone is not sufficient to confirm continuation, particularly while price remains close to resistance and the upper boundary of the short-term structure.
Bullish scenario:
A sustained H1/H4 close above 29,648.66 would indicate strengthening buying pressure.
The principal bullish confirmation requires a confirmed breakout and successful retest above 29,727.73. If buyers establish control above this level, the next upside targets would be:
29,962.34 — First upside target
30,135.74 — Second upside target
30,278.81 — Third upside target
If bullish momentum remains strong above these levels, the broader extended target would be located near 30,726.91.
Bearish scenario:
The immediate bullish structure remains protected while price holds above 29,365.62.
A confirmed break below 29,255.97 would weaken the short-term recovery. Sustained trading below 29,013.71 would confirm increasing bearish pressure and expose 28,920.50 as the first downside target.
Below that level, 28,500.40 would become the next major support and deeper downside target.
Key levels:
Immediate resistance: 29,648.66
Bullish breakout confirmation: 29,727.73
First upside target: 29,962.34
Second upside target: 30,135.74
Third upside target: 30,278.81
Extended bullish target: 30,726.91
Immediate support / bullish hold level: 29,365.62
Key short-term support: 29,255.97
Bearish pressure confirmation: 29,013.71
First downside target: 28,920.50
Major support / deeper downside target: 28,500.40
Macro outlook:
The upcoming U.S. economic calendar and Federal Reserve commentary may generate increased volatility in technology stocks. Moderately supportive economic data and expectations of easier monetary policy could help the bullish scenario. However, unexpectedly strong inflationary signals or significantly weaker growth data could trigger a corrective move.
Conclusion:
The broader structure remains constructive, but price is still positioned directly below the key breakout level at 29,727.73.
The preferred approach is to wait for a confirmed candle close and successful retest above this level rather than anticipate the breakout. Failure to hold 29,365.62 would weaken the immediate bullish scenario, while a break below 29,013.71 would shift short-term pressure toward the bearish side.
This analysis is for educational purposes only and does not constitute financial advice.
SPX H1: Bullish Recovery Awaiting Confirmation Above 7,684.47The S&P 500 remains constructive on the broader D1 timeframe, while H1 and H4 show improving short-term bullish momentum after the recent recovery from support.
Price is currently testing an important decision area. The recovery remains valid while the index holds above 7,649.82, but a confirmed bullish continuation still requires price to overcome the resistance zone between 7,673.01 and 7,684.47.
RSI analysis:
Momentum has improved across the observed timeframes. H1 RSI is above 60, H4 RSI is above 50, and D1 RSI has recovered toward the neutral 50 area. This supports the recovery scenario, although RSI alone is not sufficient to confirm a breakout.
Bullish scenario:
A sustained H1/H4 close above 7,673.01 would indicate strengthening bullish pressure. A confirmed breakout and successful retest above 7,684.47 could open the way toward 7,750.63.
If buyers maintain control above 7,750.63, the broader bullish target would be located near 7,821.56.
Bearish scenario:
The immediate bullish structure remains protected while price holds above 7,649.82. A confirmed break below 7,625.32 would weaken the recovery and expose 7,603.09.
A sustained breakdown below 7,603.09 could extend the decline toward 7,578.88. Below that level, 7,515.41 would become the next major support and deeper downside target.
Key levels:
Immediate support / bullish hold level: 7,649.82
Key short-term support: 7,625.32
Bearish pressure confirmation: 7,603.09
First downside target: 7,578.88
Major support / deeper downside target: 7,515.41
Immediate resistance: 7,673.01
Bullish breakout confirmation: 7,684.47
First upside target: 7,750.63
Major bullish target: 7,821.56
Macro outlook:
The upcoming U.S. economic calendar may produce additional volatility. Business-activity data, labor-market indicators, durable-goods orders, consumer sentiment and Federal Reserve commentary could influence expectations for economic growth and future monetary policy.
Moderately weaker data could support equities through expectations of easier monetary policy. However, significantly weak figures could renew concerns about economic growth and corporate earnings.
Conclusion:
The broader structure remains constructive, and short-term momentum is improving. However, price is still below the key breakout zone at 7,673.01–7,684.47.
The preferred approach is to wait for a confirmed candle close and successful retest above 7,684.47 rather than anticipate the breakout. Failure to hold 7,649.82 would weaken the immediate bullish scenario.
This analysis is for educational purposes only and does not constitute financial advice.
Short 
DJI H1: Bearish Structure Awaiting Confirmation Below 51,556.80The Dow Jones Industrial Average remains under short-term bearish pressure, while the broader D1 structure is approaching an important technical decision point.
On H1 and H4, price continues to form lower highs and lower lows. The recent recovery from the 51,556.80 support area currently appears corrective rather than a confirmed bullish reversal. Momentum has improved slightly, but price remains below a broad cascade of resistance levels.
RSI analysis:
On H1, RSI has recovered toward the neutral 50 area, but this alone does not confirm a trend reversal. On H4, RSI also remains below 50, while the D1 reading is still close to the lower part of its range. These conditions suggest weakening bearish momentum, but not yet sufficient bullish strength.
Bearish scenario:
A confirmed H1/H4 close below 51,556.80, followed by an unsuccessful recovery above this level, would confirm renewed bearish pressure and expose 51,077.90 as the first downside target.
A sustained breakdown below 51,077.90 could indicate that the broader D1 correction is developing into a more significant bearish structure.
Bullish scenario:
A sustained recovery above 51,767.60 would represent the first sign of short-term stabilization. However, price would still need to reclaim 51,994.00 before the corrective recovery could gain credibility.
The main bullish challenge is the resistance zone between 52,235.70 and 52,381.40. A confirmed breakout and successful retest above this zone could open the way toward 52,699.80, 52,851.50 and 53,171.70.
A broader bullish reversal would require confirmation above 53,738.20.
Key levels:
Immediate resistance: 51,767.60
First upside target: 51,994.00
Major resistance zone: 52,235.70–52,381.40
Additional upside targets: 52,699.80, 52,851.50, 53,171.70
Major bullish breakout confirmation: 53,738.20
Key support and bearish breakdown confirmation: 51,556.80
First downside target: 51,077.90
Macro outlook:
The upcoming U.S. economic calendar presents mixed-to-negative risks for equity markets. Business activity data, labor-market indicators, durable goods orders and consumer sentiment may influence expectations for economic growth and future Federal Reserve policy.
Weaker data could initially support expectations for easier monetary policy, but it could also intensify concerns about slowing growth and corporate earnings. Multiple Federal Reserve speeches may generate additional volatility and temporary price reversals.
Conclusion:
The short-term structure remains bearish, while the current recovery appears corrective. No directional entry is confirmed while price remains between 51,556.80 and 51,767.60.
The preferred approach is to wait for a confirmed candle close and retest beyond either boundary rather than anticipate the next move.
This analysis is for educational purposes only and does not constitute financial advice.
S&P 500 Daily Chart Analysis For Week of Sep 18, 2026Technical Analysis and Outlook:
In last week's trading session, the Spooz dropped and rebounded sharply with an eye on the vital Mean Resistance at 7,670, with strong potential to hit the next Mean Resistance identified as 7,722.
Nevertheless, the current trading price action demonstrates a high probability that the S&P 500 index will see steady-to-lower moves in the upcoming session. This would hint at a drop to the Mean Support at 7,610 before rebounding toward the targets stated above.
However, the fulfillment of Mean Resistance at 7,670 and the potential Mean Resistance at 7,722 will trigger an In-Force Retracement, with the index showing the possibility of dropping lower and focusing on Mean Support at 7,610 and 7,552, and a retest of the completed Inner Index Dip at 7,508. DXY H1: Directional Confirmation Between 100.044 and 100.331The U.S. Dollar Index is currently trading inside a key decision range between 100.044 support and 100.331 resistance.
The broader D1 structure remains bearish-to-neutral, while H4 still retains a short-term bullish structure. However, momentum has weakened after rejection from the 100.496–100.573 resistance area. On H1, price has returned below 100.331, leaving the immediate direction unconfirmed.
Bullish scenario:
A sustained H1/H4 close above 100.331 would support a recovery toward 100.496. A confirmed breakout above 100.573 would strengthen the bullish structure and could open the way toward the higher-timeframe resistance levels at 101.277 and 101.599.
Bearish scenario:
A confirmed H1/H4 close below 100.044, followed by a failed recovery above this level, would expose 99.774. Below that level, the major support zone at 99.582–99.682 becomes the next focus. A deeper breakdown could extend toward 99.360 and potentially 98.759.
Key levels:
Resistance: 100.331, 100.496, 100.573
Higher-timeframe resistance: 101.277, 101.599
Support: 100.044, 99.774
Major support zone: 99.582–99.682
Deeper bearish targets: 99.360, 98.759
Macro outlook:
Next week’s U.S. economic calendar presents mixed risks for the dollar. Softer business activity, labor-market or consumer data could pressure DXY, while hawkish Federal Reserve communication or stronger inflation expectations could support a temporary recovery.
Conclusion:
No direction is confirmed while price remains between 100.044 and 100.331. The preferred approach is to wait for a confirmed breakout, candle close and retest rather than anticipate the move.
This analysis is for educational purposes only and does not constitute financial advice.
 Long
Long


