Market indices
HS50: All 4 profit targets hit ,the MACD said it before reversalThis video includes a full update on my Hang Seng 50 trading idea that I posted on 9 July 2026, the same day the index succumbed to the pressure exerted by the 50% US copper tariffs, China deflation numbers and geopolitical tension emanating from the Strait of Hormuz. The MACD histogram predicted the reversal before price did, and all targets have been met in just one week. The primary target of 24,355 was achieved on July 10. The secondary target of 24,533 was achieved on July 15. The operative target of 24,874 as well as the EMA 200 extension target of 25,113 were breached on July 16, even though there was a disappointing China GDP number that did not meet its own floor target. This video explains to you the reason behind the acceleration of the trade in response to the disappointing GDP number, where the trailing stop currently stands, and the reason behind the importance of the late-July Politburo meeting as a next key catalyst for this index.
DXY (US Dollar Index) – 6H Chart Analysis
Title: DXY Testing Descending Trendline Resistance – Bearish Continuation Still Favored
The US Dollar Index remains under medium-term bearish pressure after failing to reclaim the previous swing high. Price is respecting a well-defined descending trendline that has capped every meaningful rally since late June, keeping sellers firmly in control of market structure.
The recent decline into the 100.10–100.20 region shows bearish momentum remains intact, although the market is approaching a decision point. A short-term relief rally into the 100.75–100.95 resistance zone is possible, where the descending trendline converges with a prior supply area. This confluence creates a high-probability reaction zone that institutional participants may use to re-enter short positions.
As long as price remains below both the descending trendline and the highlighted supply zone, the broader outlook continues to favor downside continuation.
<=>Key Technical Observations
**Market Structure: Bearish (lower highs continue to form).
**Trendline: Strong dynamic resistance has rejected multiple bullish attempts.
**Supply Zone: 100.75–100.95 remains the key rejection area.
**Momentum: Sellers maintain control despite the possibility of a corrective bounce.
**Support: 99.08 is the next major downside objective. A break below this level could accelerate bearish momentum.
<=>Bullish Scenario
A sustained close above the descending trendline and supply zone would invalidate the current bearish structure and shift momentum toward a broader recovery.
<=>Bearish Scenario
If price rallies into the highlighted resistance and prints bearish rejection (such as a bearish engulfing candle, pin bar, or lower-high formation), it would strengthen the probability of another impulsive leg lower toward 99.08, with further downside possible if support fails.
Trading Plan
Bias: Bearish
Preferred Strategy: Sell rallies into resistance rather than chase breakdowns.
Invalidation: A confirmed breakout and close above the trendline and supply zone.
Target: 99.08 initially, with potential extension if bearish momentum increases.
Conclusion:
The technical picture continues to favor sellers. Unless buyers can reclaim the descending trendline and invalidate the lower-high structure, rallies are likely to be corrective rather than the beginning of a sustained reversal. The confluence of dynamic trendline resistance and overhead supply keeps the path of least resistance to the downside.
DAX 40: Stuck at 25,000 for a Third Straight DayDAX has spent three sessions circling the same handful of points, and this morning's pre-open action is no different — price is sitting almost exactly on the 25,000 line it lost, reclaimed, and got rejected from twice already this week.
THREE DAYS, SAME LINE
FIRST TEST 25,000 — lost overnight Monday into Tuesday, reclaimed after-hours, rejected again at Tuesday's open, and now pinned right on it a third straight session.
MAKE-OR-BREAK 24,840 — held on a closing basis twice already this week (July 8 and July 14). Hasn't even been tested yet today.
RECLAIM 25,200 — the July 2 breakout shelf. Still untouched since it broke down; this is the level that kills the bearish case outright.
THE OVERNIGHT BACKDROP
US forces hit more than 80 Iranian military targets overnight, including over 60 IRGC boats in the Strait of Hormuz, continuing the pattern of strikes that's kept WTI climbing toward $86 for a fourth straight day. None of it has been enough to actually break DAX out of this range — the index keeps absorbing the headlines instead of trending on them.
THE TRADE, IF IT COMES
Short: 1H close back below 25,000 → entry, stop above 25,200, target 24,840 first then 24,636.
No trade: 24,840–25,000. This pocket has faked out two bounces already this week — there's no edge inside it.
Bull invalidation: 1H close above 25,200 → the top-out call is dead, third time's the charm, stand aside.
NO SHAME IN STANDING ASIDE
Three days of chop at the same level isn't a setup, it's a warning that the range hasn't resolved yet. If 25,000 keeps absorbing sellers without cracking, that's information too — just not tradeable information until it actually breaks one way.
This is the same structure my daily DAX map () has been tracking since the July 8 crash low. I will update this idea as the levels get tested.
DXY - Bullish Trend Retests Key ConfluenceThe U.S. Dollar Index (DXY) has remained overall bullish, trading within the rising channel marked in red. After the latest impulsive rally, price is now entering a healthy correction phase. 📈
Price is currently approaching a high-confluence support area formed by the intersection of:
• The lower bound of the rising channel marked in red.
• The demand zone marked in blue.
📌 As DXY approaches this confluence, we will be looking for trend-following long setups, anticipating a continuation of the broader bullish trend.
As always, rather than buying blindly into support, we will wait for bullish confirmation before considering any long positions.
Will buyers defend this confluence and resume the uptrend? 🤔
⚠️ Disclaimer: This is not financial advice. Always do your own research and manage risk properly.
📚 Stick to your trading plan regarding entries, risk, and management.
Good luck! 🍀
All Strategies Are Good; If Managed Properly!
~Richard Nasr
Hellena | SPX500 (4H): LONG to the 7700 resistance area.It has been a while since my last S&P 500 update. The structure remained unclear for some time, but the bullish scenario is becoming much easier to read now.
After the medium-degree wave "4" was completed around 7228.7, the price started developing wave "5". Inside it, the smaller waves "1" and "2" have already been formed, and the market now appears to be moving within the smaller wave "3".
If the current medium-degree wave "5" develops normally, it should move above the wave "3" high at 7621.5. A truncated wave "5" is possible, but I do not see it as the main scenario for now.
The 100% Fibonacci extension is located around 7660.2. The nearest round level above it is 7700, so this is the target area I am watching.
Before the next move higher, the price may correct toward the 7500 support area. After that, I would expect the bullish move to resume. The second option is a direct continuation from the current levels without a noticeable pullback.
Softer U.S. inflation data and a strong start to the corporate earnings season are currently supporting equities. Treasury yields have eased, while expectations of an imminent Fed rate hike have declined. This gives buyers some additional support, although local corrections are still possible along the way.
Manage your capital properly and wisely! Enter trades only based on reliable patterns!
Hang Seng Rally Moderately, with Potential for UpsideThe Hang Seng Index (HSI) soared +1.3%, or a 305-point increase, approaching the psychological barrier of 25,000 (precisely at 24,995), extending its record-breaking rally to a fifth consecutive session of gains.
Institutional smart money mechanically ignored the release of China's second-quarter GDP data, which slowed by 4.3%, to engage in massive buying following the surprise decline in the US Producer Price Index (PPI) in June.
The easing of US upstream inflation legally confirmed the easing of monetary pressures, triggering a massive foreign capital inflow that again hit Hong Kong's internet platform, consumer retail, and financial services stocks.
The HSI anchor issuers all led the way this afternoon:
- 🔸Pop Mart International ($9992) Soars +4.4%: Leading the lifestyle consumer cluster, it surged after responding to high export sales volumes and the resilient purchasing power of the younger East Asian segment.
- 🔸Xiaomi Corp. Soars +3.7% & Meituan Rises +2.9%: Xiaomi was flooded with foreign capital after being accelerated by the recovery in global hardware sentiment, while Meituan led the turnaround in the on-demand platform ecosystem.
- 🔸Tencent Holdings ($0700) Soars +2.0% & AIA Group +1.1%: The internet technology giant and the major life insurance institution moved linearly, locking the HSI index position at the upper limit of the monthly high.
NIFTY SENTiMENT ANALYSIS FOR 16/07/2026
# NIFTY 50 | Time & Price Analysis | 17 July 2026
## Can Nifty Reach 24,250 Today?
Today's market is shaping up as a classic **Time & Price** session.
The broader structure remains mildly bullish, but the path higher is unlikely to be smooth.
Instead, expect sharp swings, emotional moves, and trap formations before the market reveals its true direction.
━━━━━━━━━━━━━━━━━━
## 📊 Market Character
🟢 Direction: Mild Bullish
⚡ Behaviour: Explosive
⚠️ Character: Bullish with Trap / Conflict
This combination generally rewards patience over prediction.
━━━━━━━━━━━━━━━━━━
## 📍 Key Time & Price Levels
🛡️ Support of the Day: **24,085**
📌 Opening Anchor: **24,144**
✅ Bullish Confirmation: **24,200**
🎯 Intraday Objective: **24,250**
🚧 Major Resistance: **24,259**
As long as Nifty holds above **24,085**, the bullish structure remains intact.
Acceptance above **24,200** strengthens the probability of testing **24,250–24,259**.
━━━━━━━━━━━━━━━━━━
## ⏰ Anchor Time Windows
🕘 **9:35 AM** – First Decision Window
The market registered its intraday low almost exactly around this predefined time, reinforcing the importance of Time alongside Price.
🕑 **2:10 PM** – Final Expansion Window
If price is trading above **24,200** into this window, the probability of an intraday expansion increases.
━━━━━━━━━━━━━━━━━━
## 🏆 Sector Leadership
🥇 Auto / Consumer
🥈 PSU
🥉 FMCG
Leadership from these sectors will be important if Nifty is to sustain higher levels.
━━━━━━━━━━━━━━━━━━
## Trading Plan
✔️ Hold above **24,085**
⬇️
✔️ Sustain above **24,144**
⬇️
✔️ Reclaim **24,200**
⬇️
🎯 Watch for a move towards **24,250–24,259**
The objective is not to predict every candle.
The objective is to observe how the market reacts when predefined Time and Price converge.
Trade the reaction, not the expectation.
━━━━━━━━━━━━━━━━━━
**Disclaimer:** This analysis is based on my proprietary **Time & Price Framework** and is shared solely for educational and research purposes. It should not be considered investment or trading advice. Always perform your own analysis and manage risk appropriately.
#NIFTY #NIFTY50 #BANKNIFTY #Trading #PriceAction #TechnicalAnalysis #TimeAndPrice #MarketAnalysis #OptionsTrading #Intraday
Nifty strategy for todaynifty may open on gap up note as per sgx nifty around at 24120 levels in today morning session. coming to yesterday nifty opened around at 24085 levels from these level it spiked upto 24220 levels where nifty has been facing resistance since last week at these level bears entered and dragged it upto 24010 levels and finally closed at 24070 with marginal 24 points gain and formed classic doju on daily charts which indicated consolidated phase in the nifty. I am expecting one more consolidated session that is today session so investors trade at support and resistance levels with strict stop losses.
Nifty trading levels :
sell price : 24150-24180
stop loss : 24220-24250
1st target : 24050
2nd target : 23980
stock of the day : Kaynes technology for this stock good news delivered after market hours in yesterday which is cabinet approved 1 lk crores budget for semi conductors industry so I am expecting some bounce back in this stock. so investors can add this stock to their portfolios at support levels and maintain keep stop loss.
Buy price : 3287
stop loss : 3205
target : 3404
Disclaimer : I am not a SEBI Research Analyst please take advise from your financial advisor before take position based on my recommendation.
Thanking for your support if liked my content please suggest to your friends to follow my channel
Please drop a comment on whether my recommendation is useful and correct my mistakes
Buy price :
Going over todays price action and new positions!I hope everyone is doing great and I'm back with another video for you folks! In this video we go over todays price action and what to make of it and we also talk about a new potential pattern that I spotted on my chart and I share with you folks. Also we talk about some new positions that i took on for us to study! I hope you enjoy, If you find these videos helpful I would appreciate if you follow, boost and comment.
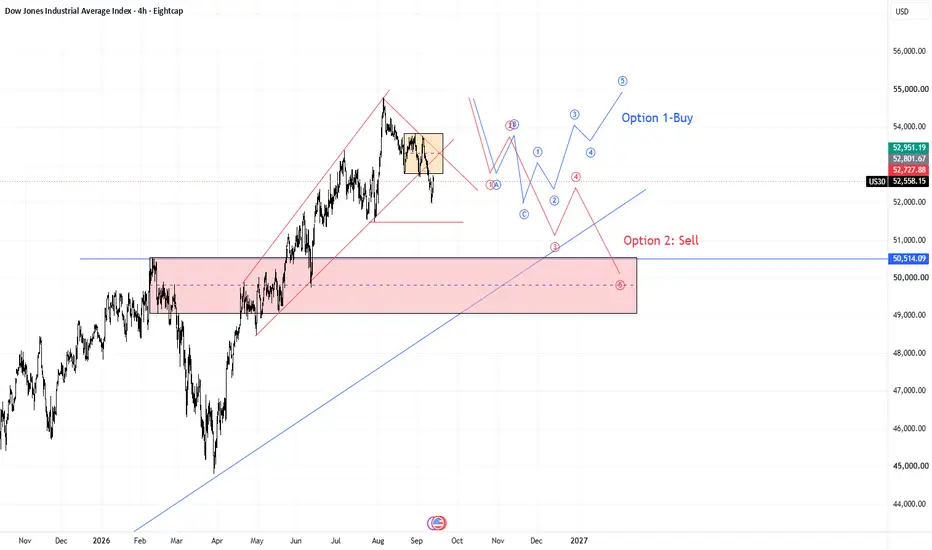
Dow Jones Wave Analysis – 15 July 2026- Dow Jones reversed from support zone
- Likely to rise to resistance level 53500.00
Dow Jones Industrial Average index recently reversed up once again from the support zone between the key support level 52250.00 (former resistance from June), 20-day moving average and the 38.2% Fibonacci correction of the upward impulse from June.
The upward reversal from this support zone created the daily Japanese candlesticks reversal pattern Hammer, which stopped earlier wave iv.
Given the clear daily uptrend, Dow Jones Industrial Average index can be expected to rise to the next resistance level 53500.00 (top of the previous impulse wave iii).
DXY Bearish Breakout! Sell!
Hello, Traders!
DXY a confirmed breakout below the demand area shifts market structure bearish. Smart Money favors continuation lower after any weak pullback, targeting the next demand zone. Time Frame 4H.
Sell!
Comment and subscribe to help us grow!
Check out other forecasts below too!
Market Update 7-15Another move up to over 7600 wouldn't surprise me, but I think this general area is a short. SPY/QQQ may break above resistance which means tech may sell more than SPY in the coming weeks. SOXX still needs to take out 540 support first for that to happen. I cover the other markets as well.
Bank Nifty Index Intraday Technical Analysis for 16 July, 26NSE:BANKNIFTY
Nifty Bank Index (NSE) | Intraday Structure | July 16, 2026
Bank Nifty is trading around 57,719.10, hovering tightly right under the 57,758 Zero Line. The index is grinding through a localized consolidation block after experiencing massive intra-day volatility over the preceding sessions, catching support from its structural demand bases near 57,545 while facing supply-side cap pressure.
Price action enters today's session heavily compressed inside the primary pivot cluster. Institutional market participants are matching order flows within a narrow range, waiting for a definitive high-volume candle breakout to define the broader trend. Let the market establish clean structural acceptance away from this zone before allocating risk.
Bullish Triggers
Long Entry: Above 57,918 (strongly validated while price holds structural footing above the 57,847 Add Long Pos. band).
Targets: 58,131 - 58,361
Risk Control: Structure weakens below 57,847. Hard exit below 57,977.
Bearish Triggers
Short Entry: Below 57,776 (especially if liquidity pushes fail to break the 57,758 Zero Line, turning it into a strict distribution ceiling).
Targets: 57,385 - 57,154
Risk Control: Cover immediately above 57,683. Day Bias remains structurally protected above 57,545.
No-Trade Chop Zone: 57,776 - 57,918
Expect highly choppy, rotational price action within this block as option writers seek to decay premium. Avoid chasing early morning whipsaws inside this decision band; let a clean 15-minute structural candle close confirm true institutional intent.
Execution Rule: Structure first, confirmation next. Zero anticipation.
Hit Boost and drop your view in the comments if you're tracking these levels today.
#BankNifty
Cybersecurity: Balancing Tactical Pullbacks with Secular Growth
The long term fundamental story for cybersecurity is incredibly strong. Mandatory enterprise spending, AI driven threats, and platform consolidation provide a massive multi-year demand floor.
However, the daily chart suggests patience is key right now. Price is backing off while RSI and squeeze momentum show clear bearish divergences.
The short term trend (white dotted line) is the key pivot here. If that line breaks, we are likely looking at a healthy consolidation down to the blue moving average or a deeper retest of the structural support area around 4k.
Letting this momentum divergence play out allows tactical risk to reset before scaling into a highly resilient secular sector.
NASDAQ:BUG $CIBER AMEX:HACK NASDAQ:NQCYBR
Nifty 50 Index Intraday Technical Analysis for 16th July, 2026NSE:NIFTY
Nifty 50 Index (NSE) | Intraday Structure | July 16, 2026
Nifty is trading around 24,073.45, compressing closely right underneath the 24,079 Zero Line. The index is holding inside a volatile, corrective consolidation structure after experiencing an intense distribution block during the previous session that rejected the higher 24,200 values.
Price action enters today's session locked within a tight inflection zone. Institutional participants are actively matching orders near this benchmark level, waiting for a definitive high-volume expansion breakout to establish the broader intraday direction. Let a clean 15-minute structural candle close away from this boundary confirm real intent before allocating risk.
Bullish Triggers
Long Entry: Above 24,140 (strongly validated if price secures persistent structural footing above the 24,115 Add Long band).
Targets: 24,208 - 24,288
Risk Control: Structure weakens below 24,115. Hard exit below 24,070.
Bearish Triggers
Short Entry: Below 24,091 (validated if the 24,079 Zero Line persistently acts as a rigid distribution ceiling).
Targets: 23,949 - 23,869
Risk Control: Cover immediately above 24,161. Bias structurally protected below 24,220.
No-Trade Chop Zone: 24,070 - 24,140
Expect highly rotational, choppy price action within this structure block as option sellers look to grind out premium. Avoid chasing early morning spikes within this cluster; let a clean structural candle breakout provide execution validation.
Execution Rule: Structure first, confirmation next. Zero anticipation.
Hit Boost and drop your view in the comments if you're tracking these levels today.
#Nifty50
S&P500: Trapped within Support and Resistance. How to trade.S&P500 marginally turned bullish on its 1D technical outlook (RSI = 57.957, MACD = 31.350, ADX = 21.540) as it's been on a strong rise since yesterday that hit today the top of the R1 Zone. This is the region where all corrections of the past 30 days were initiated. Since however we are on Higher Lows since June 26th, we may be potentially witnessing the emergence of a Channel Up but it is confirmed only if the R1 Zone and R2 break. Above the R2, buy and TP = 7,700. Below the bottom of the Channel Up, target the S1 Zone (TP = 7,430). Observe the LH on the 4H RSI, similar to the June peak.
## If you like our free content follow our profile to get more daily ideas. ##
## Comments and likes are greatly appreciated. ##