AICFDPRO Identifying & Eliminating Flaws in Copy Trading AnalisCopy trading is becoming an increasingly technology-driven area of financial markets, where the decisions of one participant can be automatically or semi-automatically replicated across other users’ accounts. This model increases the importance of not only execution speed but also the quality of the analytics used to evaluate a trading strategy. It is not enough to see a high return or a large number of profitable trades — investors also need to understand how the result was achieved, what level of risk accompanied it, and whether the underlying metrics were calculated correctly.
At AICFDPRO, copy trading analytics is viewed as a multilayered system for verifying data, trading results, and risk factors. Errors in source data, incomplete transaction histories, incorrect interpretation of returns, or failure to account for fees can create a distorted perception of a strategy’s effectiveness. Identifying analytical flaws should therefore precede the use of statistical indicators when making investment decisions.
Regulatory practice also highlights the complexity of copy trading. The FCA states that, depending on the structure of the service, automatically executing another person’s trades may constitute portfolio management, while ESMA highlights areas such as information requirements, suitability assessment, costs and fees, product governance, and the qualifications of traders whose transactions are being copied. (fca.org.uk)
For AICFDPRO, this approach means that high-quality analytics should not simply display performance figures but should also help identify potential weaknesses in a trading model. The more parameters that are considered simultaneously, the greater the potential for developing a more objective understanding of how a strategy behaves under different market conditions.
Data Quality as the Starting Point
The first stage in evaluating analytics is assessing the quality of the underlying data. Every copy trading metric depends on how completely and accurately the system records trade history, execution prices, position sizes, fees, opening and closing times, and other relevant parameters. If some information is missing or processed incorrectly, the resulting indicators may look significantly better or worse than the actual performance.
Synchronization between the strategy provider’s trading account and the user’s account is particularly important. Even a small delay between opening a position on the provider’s account and replicating it on another account can result in a different execution price. During periods of high volatility, this difference can become significant and gradually increase the gap between the reported and actual performance of the strategy.
At AICFDPRO, checking timestamps and the sequence of operations is considered an important part of analytical control. It is necessary to understand exactly when a trading signal was generated, when it was transmitted to the system, and when the corresponding transaction was actually executed. This sequence makes it possible to distinguish the quality of the strategy itself from results caused by execution conditions.
Another potential source of distortion is incomplete historical data. If an analytical system shows only a successful period or excludes previously closed positions, users receive an incomplete picture. A comprehensive assessment should therefore incorporate the full available transaction history and clearly define the period over which the relevant metrics are calculated.
Checking Returns and Statistical Metrics
One of the most common analytical weaknesses is excessive focus on returns. A high percentage gain alone does not indicate the level of risk required to achieve it. Two strategies may generate similar overall returns while having very different maximum drawdowns, volatility, and concentration of positions.
At AICFDPRO, analyzing returns alongside risk indicators is considered essential. When evaluating a copied strategy, relevant metrics may include maximum drawdown, the frequency of losing periods, the size of individual losses, the duration of positions, and the extent to which overall performance depends on a small number of large trades. This comprehensive approach helps prevent attractive returns from concealing excessive risk.
The methodology used to calculate percentage returns also deserves particular attention. Results can depend on the selected time period, initial capital, reinvestment of profits, and the timing of deposits or withdrawals. Analytical systems should therefore clearly define their calculation methodology and apply consistent rules when comparing different strategies.
Regulators also emphasize the importance of providing investors with understandable information about risks and financial products. For example, FCA requirements for relevant consumer investment products include disclosure of material risks associated not only with volatility but also with credit, operational, derivative, and leverage-related risks. (handbook.fca.org.uk)
Identifying Hidden Risks in Copied Strategies
Even accurate statistics may not reveal the entire risk structure of a strategy. For example, a strategy may generate a large number of small profitable trades while simultaneously carrying a small number of positions capable of producing substantial losses. If analytics focus only on the percentage of winning trades, this characteristic may remain hidden.
Another weakness can arise from high capital concentration. Several trades may formally involve different assets while actually depending on the same underlying market factor. As a result, a portfolio may appear diversified based on the number of instruments it contains while maintaining significant underlying exposure to a single source of risk.
At AICFDPRO, analytics is viewed as needing to account for relationships between positions and trading scenarios. If several trading decisions respond to the same underlying factor, their combined risk may be greater than the simple sum of individual exposures suggests. Analytical systems should therefore examine not only each trade separately but also the structure of the portfolio as a whole.
Leverage is another important consideration. It can increase both potential gains and potential losses, meaning that evaluating a strategy without considering the leverage used may provide a misleading picture. A comprehensive assessment should examine not only the final result but also the mechanism through which that result was achieved.
Correcting Analytical Flaws
Identifying a problem is only the first stage. Once an inaccuracy has been detected, its source must be determined: a data error, an incorrect calculation methodology, an execution delay, incomplete historical information, or an incorrect interpretation of a metric. Only then can the analytical model be properly adjusted.
At AICFDPRO, this process can be viewed as a sequence of checks: first, the underlying data is verified; next, the calculation methodology is reviewed; finally, the resulting metrics are compared with independent sources and actual trading activity. This helps distinguish a technical error from a genuine change in strategy performance.
Regular testing of analytical models is also an important tool. When calculations are used to monitor copy trading, systems should be tested not only during initial deployment but also after changes to algorithms, data sources, or trading infrastructure. The FCA's observations on algorithmic trading emphasize the importance of formalized procedures, algorithm testing, and effective pre- and post-trade controls. (fca.org.uk)
Corrections should also be transparent. If the methodology used to calculate a particular metric is changed, the change should be documented and historical data should remain as comparable as possible. This reduces the risk that an update to the analytical model itself creates a new distorted picture of performance.
The Role of Automation and Human Oversight
Automation can significantly accelerate the analysis of large volumes of trading data. A system can monitor unusual deviations, compare actual results with expected parameters, and flag potential problems. This is particularly important in copy trading, where large numbers of transactions may be processed simultaneously.
However, automated analytics should not completely eliminate human oversight. An algorithm may identify a statistical anomaly, but additional analysis may be required to understand its cause. For example, a sharp change in a metric may result from a data error or from a genuine change in the underlying trading strategy.
At AICFDPRO, the balanced approach combines automated monitoring with expert review. Algorithms can help detect anomalies quickly, while specialists can investigate their underlying causes and assess their potential impact on reported performance.
This balance is particularly important for complex trading systems. ESMA notes that when copy trading services are provided, the specific structure of the service and the applicable investor-protection requirements need to be taken into account. (esma.europa.eu)
How AICFDPRO Develops Analytical Solutions
AICFDPRO views the development of analytical technologies as an ongoing process focused on improving data quality and calculation transparency. Within this approach, particular attention can be given to checking trading statistics, identifying anomalies, comparing metrics, and monitoring the quality of analytical models.
The company focuses on artificial intelligence and analytical technologies, making automated tools useful for organizing and processing large volumes of information. At the same time, algorithmic solutions should be treated as analytical tools rather than guarantees of future performance.
For copy trading, it is particularly important to distinguish historical statistics from forward-looking assumptions. Past performance can be used to analyze how a strategy behaved under previous market conditions, but it does not by itself establish how that strategy will perform in the future. Maintaining this distinction helps prevent excessive confidence in metrics that reflect only historical market environments.
Ultimately, the purpose of an analytical system is not to present a particular strategy exclusively in a positive or negative light, but to make its characteristics as transparent and understandable as possible. Identifying weaknesses, verifying data, and controlling methodology can provide a more objective foundation for evaluating copy trading.
Conclusion
Identifying and eliminating flaws in copy trading analytics is becoming an important component of modern trading-data management. Errors in source information, incorrect return calculations, failure to account for fees and execution delays, insufficient consideration of drawdowns, and hidden risk concentration can significantly change how a strategy is perceived.
AICFDPRO views effective analytics as a combination of high-quality data, transparent methodologies, automated monitoring, and human oversight. Such an approach makes it possible not merely to collect statistics but to systematically verify their quality and identify factors that may distort reported results.
For market participants, this represents a shift from a superficial assessment of individual metrics toward a more comprehensive analysis of copy trading. The more thoroughly data, methodology, and risks are examined, the more informed the evaluation of a trading strategy can become. The Fed raised rates and signaled more tightening.This knocked down the cheap liquidity thesis that supported AI stocks. The double top/rejection near 7,700 shows this.
The September volume indicates distribution. The stock market is finally aligning with the credit market, which was already warning via Oracle's CDS and spreads.
The important support is 7,570. If lost, the 7,100 target becomes plausible.
The day 09/18 is critical: record options expiration ($6.2 trillion) removes the market's buffer, and the Bank of Japan may raise rates, accelerating the unwind of the yen carry trade.
Recession risk: the Fed may be tightening on top of an already slowing economy. Employment and housing data may be revised downward, as in 2008. The market is starting to price in this delay.
The chart suggests that AI euphoria is being replaced by the reality of high rates, and the drop to 7,100 may materialize if the 7,570 support breaks after the 09/18 events.  Short
Short

 Long
Long
 Long
Long
US30 30M — Bearish Continuation ScenarioUS30 remains in a bearish structure, with price currently retracing into the 52,300–52,335 resistance area.
I’m watching this zone for a possible rejection and continuation lower. If sellers defend the area, the 51,915 region becomes the next area of interest
Key levels:
• Resistance: 52,300–52,335
• Invalidation: sustained break above 52,335
• Support/target area: 51,915
The setup depends on confirmation from price action. A clean break above resistance would weaken the bearish scenario.
Technical analysis only; this is a possible scenario, not a guaranteed outcome.
Short 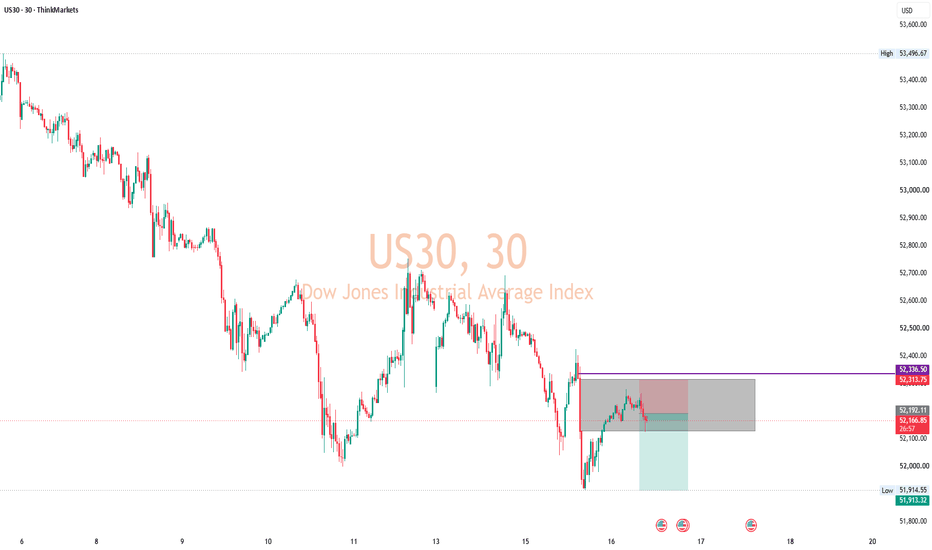

 Long
Long
Nasdaq in a Bullish Consolidation PhaseThe H1 intraday structure reveals movement within a consolidation or wide range-bound pattern, situated between the floor of the Major Demand Zone (near the green line at 28,806.6; lower gray box) and the ceiling of the Major Supply Zone (near the green line at 29,483.5; upper gray box). PEPPERSTONE:NAS100
-------------------------------------------------------------------------------------------------------------------
✅ Current Price Action:
At the 29,288.3 price level, the latest H1 candle is dominated by an impulsive bullish move—a steady climb following a liquidity sweep (a sharp downward wick) that reached the 28,757.0 level.
This upward movement has successfully breached the range midpoint (horizontal line at 29,247.9) and is currently consolidating while pressing against the nearest local Lower High (LH) boundary.
-------------------------------------------------------------------------------------------------------------------
✅ Key Zones:
- ⚡Resistance / Supply Zone: Near the green line at 29,288.3 (nearest local resistance area) and near the green line at 29,483.5 (upper gray box / Major Supply Zone).
- ⚡Support / Demand Zone: Near the horizontal line at 29,247.9 (nearest Support-Turned-Resistance/SBR area) and near the green line at 28,806.6 (lowest gray box / Major Demand Zone).
-------------------------------------------------------------------------------------------------------------------
✅ Orderflow / Volume Profile (VPVR) Analysis
The Volume Profile histogram on the right side of the chart provides a highly precise map of institutional liquidity:
⚡High Volume Node (HVN) / Lower Main Point of Control:
The heaviest volume accumulation is visible in the 29,100.0 – 29,200.0 range (indicated by the longest histogram protrusion in the lower-middle section). The fact that buyers successfully pushed the NASDAQ above this dense HVN area confirms the absorption of institutional buy orders (buying limit absorption).
⚡Upper Low Volume Node (LVN) / Volume Vacuum Area:
Above the 29,300.0 level and leading up to the green line at 29,483.5, the volume histogram shows a significant contraction or thinning (a "volume vacuum"). If buyers can trigger a solid H1 candle close above 29,300.0, the movement is projected to accelerate rapidly across this zone of low volume efficiency, targeting 29,483.5.
-------------------------------------------------------------------------------------------------------------------
✅ Elliott Wave Analysis
Mapping the wave cycle movements on the H1 timeframe:
⚡Wave Structure:
The impulsive rally from the 28,806.6 low to the 29,483.5 high is calculated as Wave 1 (or a macro Wave A). The sharp V-shaped reversal decline that swept below the 28,757.0 low is identified as the formation of a corrective Wave 2 structure (or an expanded flat Wave B).
⚡Current Status:
The impulsive green surge from the 28,757.0 low—which has now broken through 29,288.3—confirms the start of an upward impulsive Wave 3 (or Wave C) expansion.
⚡Projection:
Price action is projected to complete this impulsive Wave 3 push across the LVN zone, targeting a test and breakout of the Major Supply Zone ceiling near the 29,483.5 green line, with the potential for the rally to extend toward the record high of 29,734.7. Long 
S&P500 hit its 1D MA100 after 5 months. Massive buy or sell-off?The S&P500 index (SPX) hit yesterday its 1D MA100 (green trend-line) for the first time in more than 5 months (since April 13 2026) and is initially rebounding. This of course comes just hours after the Fed Rate Hike yesterday, which the market's initially sold but recovered entirely just now!
Technically this is almost a Higher Low on the 5-month Channel Up. Now the momentum is facing the 1D MA50 (blue trend-line) as a Resistance. If it breaks, expect a continuation of the bullish pattern.
If it holds however, the selling pressure could accumulate and there are higher probabilities to see a test of the lower Support. The next one is the 1D MA200 (orange trend-line) but the last major testing of the 1D MA100 as Support during February 2026, resulted in the strong correction of March (U.S. - Iran war) that bottomed on the 1W MA70 (red trend-line) after exactly a -10% total decline. Notice also how similar the RSI sequences among the two fractals are, both Channel Downs, currently sitting on the 37.50 Symmetrical Support.
As a result, as long as the market is under Lower Highs and breaks below the 1D MA100, account for a potential -10% sell-off towards the 1W MA70, targeting 7050. Could be an ideal long-term buy opportunity after the U.S. Mid-term elections.
---
** Please LIKE 👍, FOLLOW ✅, SHARE 🙌 and COMMENT ✍ if you enjoy this idea! Also share your ideas and charts in the comments section below! This is best way to keep it relevant, support us, keep the content here free and allow the idea to reach as many people as possible. **
---
💸💸💸💸💸💸
👇 👇 👇 👇 👇 👇 Mark the invalidation before you buy the pullbackThe Fed raised rates a quarter point on Wednesday, to 3.75% to 4.00%, the first hike since July 2023. The dollar index went back through 100 on it.
The part that matters for anyone buying pullbacks is the projections. In June the Fed's median had rates coming down to 3.6% by the end of 2027. In September it's 4.1% and staying there, with 16 of 18 officials pencilling in another hike this year. So every inflation and jobs release between now and the October meeting carries more weight than it did a month ago.
That changes the order you should do things in.
Most people buy a pullback like this. Price comes back towards a moving average in a trend, it looks cheap, they get in, and then they go looking for somewhere to put the stop. Every pullback looks cheap while it's happening. You can't tell a pullback from the start of a reversal until price gets somewhere it shouldn't.
So find that somewhere first.
Pick the side off the trend. On the daily, if the 8 EMA is above the 21 you're only looking at buys. That's the whole first question and it takes two seconds.
Mark the invalidation off the ATR. Take the weekly ATR, the distance the market normally travels in a week, and measure down from where you'd enter. That block is where the idea is wrong. If price gets in there the pullback has turned into something else. The stop goes there, and your size comes from the distance to it rather than from how much you like the chart.
Check how much of the week is already spent. If the week has already travelled most of its ATR, there's less room left for a fresh target, and a good-looking entry with nowhere to go is still a poor trade.
Then look at the target off the same ATR. Now the reward-to-risk is sitting on the chart before you've done anything.
There's one more thing the ATR gives you if you draw the daily and the weekly sets together. You can split one entry into two pieces. One takes the nearer daily target. The other is held for the weekly level, and when the daily target pays, its stop goes to entry. If the week has already used up its normal range by then, that's a good sign the daily piece has had most of what the week was going to give. The first piece pays for the trade, and once it has, the second one is running for free.
One honest thing about all of this. Buying a pullback in a trend isn't an edge on its own. Replay the simple version back through the daily bars on the pairs I've run it on, same stop, same target, and it comes out close to flat. What the order above does is make sure you know where you're wrong and whether the week's got room before you commit, which matters a lot more in a month where any single release could move a rate expectation.
Where is the invalidation on the last pullback you bought, and did you mark it before or after you got in?
Educational content. Not financial advice.  Education
Nasdaq 100: A Breakout Could End the Current RangeThe Nasdaq 100 remains within a broad 4H consolidation following the rejection from above 30,300.
Price has repeatedly interacted with the 29,000–29,300 support region and the 29,600–29,750 resistance area.
With price currently positioned toward the upper half of the range, the 29,600–29,750 region remains the key structural boundary.
A sustained move above this area would bring 30,000–30,200 into focus, while rejection could see price rotate back toward the lower portion of the range.
The market remains range-bound, so there is limited directional confirmation while price remains between the established boundaries. We would like to see a clear break and subsequent price acceptance outside the range before the structure becomes more directional.
Key Levels
Support: 29,000–29,300
Resistance: 29,600–29,750
Major Resistance: 30,000–30,200
This Article is for informational and educational purposes only and does not constitute investment advice. It does not consider the financial situation, needs, or objectives of any specific individual. Any reference to past performance is not a reliable indicator of future results.
Risk Warning: 68% of retail investor accounts lose money when trading CFDs with this provider. You should consider whether you can afford to take the high risk of losing your money. Please refer to our full risk disclaimer on our website. GER40 (DAX 40): Structural Pullback & Key Target Roadmap━━━━━━━━━━━━━━━━
🇩🇪💼 GER40 | GERMANY 40 INDEX CFD 💼🇩🇪
🏴☠️ THE GREAT FRANKFURT VAULT RAID — BULLISH BLUEPRINT 🏴☠️
📈 Day Trade / Swing Trade Opportunity Guide 🎯⏳
━━━━━━━━━━━━━━━━
Dear Ladies & Gentleman (Thief OG's) 👋🧠💰
Welcome to the Thief Trader war room — Frankfurt edition.
The GER40 vault is cracked open and the blueprint is live.
We're locking in a bullish operation on one of the most-watched
indices on the planet. Gear up. The heist is on. 🚀🔐
━━━━━━━━━━━━━━━━
📊 LIVE MARKET SNAPSHOT — GER40 / DE40 "GERMANY 40" INDEX CFD
━━━━━━━━━━━━━━━━
🕐 Data Verified: Thursday, 17 September 2026 — London Time (BST)
📍 Asset: GER40 / DE40 — Germany 40 Index CFD (Frankfurt Stock Exchange / Xetra)
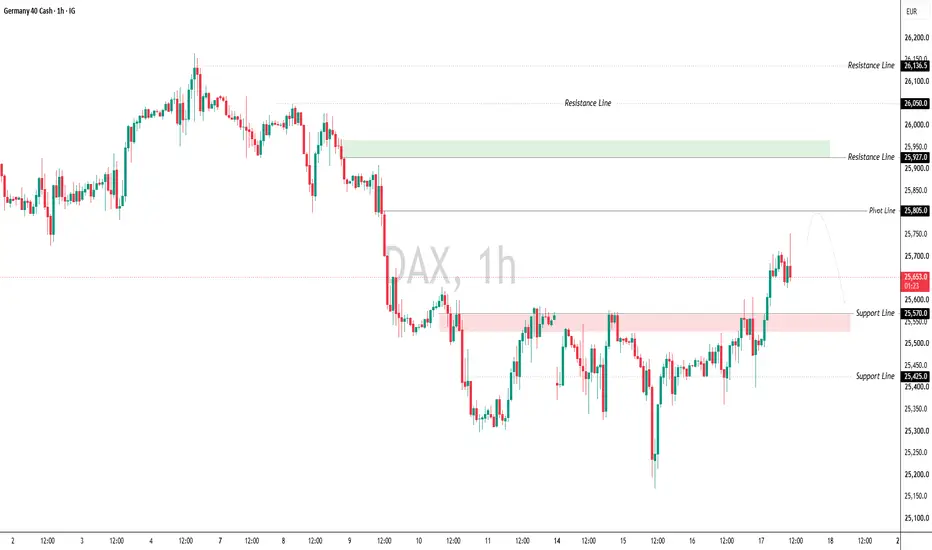
💹 Current Price: ~25,450 – 25,560 (CFD prices vary by provider — verify with your broker)
📈 Today's Session Range: 25,361 – 25,612
🔺 All-Time High: 26,618.74 (recorded 28 August 2026)
📉 52-Week Low: 21,863.81
🧭 Trend Direction (Daily): Bullish pullback — reloading at moving average confluence
📊 Direction Bias (Thief Trader): BULLISH 🟢
━━━━━━━━━━━━━━━━
🎯 MY MARKET BIAS
━━━━━━━━━━━━━━━━
My market bias on GER40 is BULLISH for this setup.
The bias is supported by a Daily timeframe confirmation where price
is printing a moving average pullback — one of the cleanest
reversal signals in technical analysis when combined with the
broader structural trend.
The structural case remains bullish as long as GER40 holds above
the key channel support zone. A confirmed bounce with body closes
above the day's moving average region confirms long-side momentum.
Entry is most favourable during the pullback, not the chase.
This is not a blind long — it is a disciplined, confirmation-based
bullish play aligned with the dominant trend of the index.
━━━━━━━━━━━━━━━━
📐 POSSIBLE SCENARIO — THE FRANKFURT HEIST PLAN 🏴☠️
━━━━━━━━━━━━━━━━
💡 POSSIBLE SCENARIO — BULLISH PULLBACK CONTINUATION:
Price is currently inside a high-probability reaction zone after
pulling back from the August ATH. If daily moving average support
holds, price prints a bullish rejection candle or structure break
on lower timeframes — the setup triggers a continuation leg toward
the 26,000 vault, and beyond that the police force zone at 26,500.
📌 Primary Bullish Path:
→ Price finds support at moving average zone (~25,200–25,400)
→ Lower timeframe (15m / 30m) confirms bullish reversal signal
→ Price pushes through minor resistance at 25,600–25,800
→ First vault raid at 26,000 ✅
→ Momentum extension toward the main vault / final escape point at 26,500 🏆
→ POLICE FORCE zone at 26,500 — strong resistance cluster, overbought
conditions, institutional trap zone and potential reversal area —
THIS IS WHERE THE THIEF ESCAPES WITH THE LOOT 💼💰
📌 Alternative / Invalidation Scenario:
→ Price fails to hold the moving average cluster
→ Break below 24,800–24,600 on a daily close signals caution
→ Deeper pullback toward 23,800–23,400 channel support remains
possible if macro conditions deteriorate sharply
━━━━━━━━━━━━━━━━
🔑 HEIST ENTRY PLAN — LAYERED LOADING STRATEGY 🧱
━━━━━━━━━━━━━━━━
📌 Entry Type: Bullish Layered / Scaled Entry
💡 "The vault is open 24/7 — Thief enters at any time! 🔓💰"
→ Deploy multiple buy limit orders across the moving average
pullback zone on the 15m–30m chart.
→ Load entries at recent swing lows and structure support levels.
→ Each entry at a better price = a lower average and a wider
profit margin — this is the Thief's edge.
→ Set price alerts at the key decision zones and be ready.
→ Be early. Be patient. Be precise.
━━━━━━━━━━━━━━━━
🎯 ESCAPE TARGETS — THE VAULT LOCATIONS 💰
━━━━━━━━━━━━━━━━
🏆 1st Target (First Vault) ————————————— 26,000 🔓
🏆 MAIN / FINAL Target (Police Force Zone) —— 26,500 🚔
⚠️ Why the Police Force guards 26,500:
The 26,500 zone sits just below the all-time high of 26,618. This
level is a convergence of strong historical resistance, overbought
momentum signals, and institutional distribution potential. Smart
money has been known to reverse price sharply at this zone. The
police are waiting. Grab the loot and run! 🏃♂️💨
━━━━━━━━━━━━━━━━
⚠️ TP DISCLAIMER — READ THIS, THIEF OG's ⚠️
━━━━━━━━━━━━━━━━
Dear Ladies & Gentleman (Thief OG's) — I am NOT recommending you
set only my TP levels. These are reference points on the map, not
a mandate. It is YOUR own choice. You can make money, then TAKE
money — at your own risk. Partial exits, trailing stops, booking
at structure — all valid. Manage your trade YOUR way. 💼🔥
━━━━━━━━━━━━━━━━
🛡️ THIEF STOP LOSS — THE ESCAPE HATCH 🚪
━━━━━━━━━━━━━━━━
🔐 Thief SL Reference: @ 22,500
(Positioned beneath the key structural swing low zone — below the
4H channel support base and significant multi-month demand level)
Adjust your SL based on your lot size, number of active entries,
and personal risk tolerance. Protect the crew first. Always.
━━━━━━━━━━━━━━━━
⚠️ SL DISCLAIMER — READ THIS, THIEF OG's ⚠️
━━━━━━━━━━━━━━━━
Dear Ladies & Gentleman (Thief OG's) — I am NOT recommending you
set only my SL. It is YOUR own choice. You can make money, then
TAKE money — at your own risk. Know your exposure. Protect your
account first. The heist only works when the crew comes home safe.
━━━━━━━━━━━━━━━━
👀 AREAS I AM WATCHING
━━━━━━━━━━━━━━━━
🔎 Key Structural Zones on My Radar:
— 25,200 – 25,400 ➤ Daily moving average confluence zone —
critical pullback support. Bull case hinges on this holding.
— 25,600 – 25,800 ➤ Minor intraday resistance cluster. Clean
break above this confirms the bullish reload is complete.
— 26,000 ➤ First vault / Round number resistance / Previous
minor swing area — expect price reaction here. Partial booking zone.
— 26,500 ➤ Police force zone — the final vault. Overbought,
over-extended, institutional supply zone. Exit / escape area.
— 26,618 ➤ All-Time High — the ceiling of the house. Respect it.
— 24,800 – 24,600 ➤ Invalidation level for the bullish scenario.
Daily close below here would signal caution for longs.
— 23,400 – 23,800 ➤ Deeper channel support floor. Not in immediate
play, but a critical watch zone if bearish pressure increases.
I am also watching:
→ US Dollar Index (DXY) — a stronger dollar post-Fed tends to
weigh on risk assets and global equities including GER40
→ EUR/USD — currently near 1.1460 post-Fed hike; EUR weakness can
be a mixed signal for German exporters (cheaper exports, but
reduced purchasing power)
→ Bond yields (German 10-yr Bund: ~3.55% — 17-year high) — rising
yields increase the cost of capital and can pressure equity multiples
→ Crude Oil — Brent above $100/barrel is a macro headwind for
European equities via inflationary cost pressure
━━━━━━━━━━━━━━━━
🌍 CORRELATED PAIRS & MARKETS TO WATCH 🔗
━━━━━━━━━━━━━━━━
These are the markets running alongside our GER40 heist. Watch
them. They tell the story the candles sometimes can't. 📖
— EUR/USD ≈ $1.1460 💶
The euro is under pressure post-Fed hike and after the ECB's
own 25 bps hike to 2.50%. A weaker EUR is a DOUBLE-EDGED signal
for GER40: cheaper German exports benefit major DAX constituents
(Siemens, BASF, Volkswagen) but signals risk-off macro sentiment.
EUR/USD dropping below 1.1400 would be a bearish signal for the
broader European risk environment. If EUR/USD recovers above
1.1550–1.1600, this is a tailwind for GER40 bulls.
— UK100 / FTSE 100 ≈ £10,687 📊
GER40 and UK100 share a strong POSITIVE correlation — they are
both European equity benchmarks responding to similar macro
drivers (ECB, Fed, risk sentiment, oil prices, bond yields).
FTSE strength = GER40 tailwind. FTSE weakness = watch out.
Today's BoE decision is a major catalyst — a hold or dovish tone
supports European equities broadly.
— CAC 40 (France 40) ≈ ~8,111 🇫🇷
Direct European peer. CAC 40 moves closely with GER40 on risk
macro events. A CAC 40 rally confirms regional risk-on momentum.
A CAC 40 sell-off warns that the GER40 bullish play faces
regional headwinds. Watch the pair as a real-time confirmation signal.
— US30 / Dow Jones ≈ $52,407 🇺🇸
GER40 has a POSITIVE correlation with Wall Street — US30 and S&P
500 sentiment bleeds into European morning sessions. A positive
US30 close boosts Frankfurt open sentiment. Post-Fed hike, US
markets held firm (S&P 500 up 0.4%) — a constructive signal for
GER40 bulls going into the European session.
— GBP/USD ≈ $1.3389 💷
Cable reflects global USD strength. A falling GBP/USD signals
broad dollar dominance — this tends to be a BEARISH input for
European equities. GBP/USD has slipped below 1.3400 post-Fed,
adding to the cautious risk backdrop.
— USD/JPY ≈ ~158–160 area 🇯🇵
A rising USD/JPY reflects USD strength and risk-on global
appetite — often mildly POSITIVE for equities including GER40.
However, extreme USD/JPY gains (above 160) can trigger yen
intervention concerns, destabilising global risk markets broadly.
— XAU/USD (Gold) ≈ ~$4,250–$4,360 area 🥇
Gold is inversely correlated to risk equity indices like GER40.
Gold fell after the Fed hike — this is a PRO-RISK signal and
broadly supports the GER40 bullish case. If Gold rallies sharply
from here, monitor for safe-haven rotation OUT of equities.
— Brent Crude Oil ≈ $100+ per barrel 🛢️
Oil above $100 is a persistent macro headwind for GER40 —
it drives input cost inflation, pressures corporate margins,
and keeps ECB and Fed policy hawkish. Watch $105 as the
next critical level — a sustained break above that level
could amplify selling pressure on European equities.
━━━━━━━━━━━━━━━━
🌐 FUNDAMENTAL & ECONOMIC FACTORS — NEUTRAL ANALYSIS 📰
━━━━━━━━━━━━━━━━
⚠️ This section reflects ACTUAL market conditions only —
presented neutrally. Bullish AND bearish drivers included.
The market says what the market says. 📊
- - - - - - - - - - - - - - - - - - - - - - - - - - - - -
🟢 BULLISH DRIVERS / SUPPORTIVE FACTORS
- - - - - - - - - - - - - - - - - - - - - - - - - - - - -
→ 🏗️ Germany's €500B Infrastructure Investment Fund
Approved in early 2026, this is the largest fiscal stimulus
in German post-war history. Capital deployment into defence,
infrastructure, and energy transition is a multi-year structural
tailwind for DAX industrials, defence names, and utilities.
Stocks like Siemens Energy (+69.5% YoY), Infineon (+76.3% YoY)
reflect early beneficiary pricing.
→ 📈 German GDP Growth Recovery Expected at +1.5% for 2026
After two years of recession in 2023–2024 and near-zero growth
in 2025, Germany's KfW research institute projects +1.5% GDP
growth for 2026 — a genuine recovery narrative that supports the
earnings case for DAX constituents.
→ 🏭 Improved German Economic Sentiment
Several German economic research institutes significantly raised
their forecasts in early September 2026, citing stronger-than-
expected exports and a less severe impact from the Iran conflict
than originally anticipated. The ifo Business Climate Index rose
to 88.8 in August (from 86.7 in July) — a constructive data point.
→ 🤖 AI and Tech Sector Momentum
Tech and AI-linked names within the DAX (Siemens, Infineon,
SAP on recovery days) are absorbing institutional capital flows.
Hochtief, Infineon and Siemens Energy were the top DAX gainers
on September 16, rising between 1.7% and 3.2% in a single session.
→ 🏦 GER40 Global Revenue Base = Domestic Weakness Insulation
The majority of large DAX companies earn most of their revenue
outside Germany. This decouples index performance from weak
German domestic fundamentals — a key structural argument for
GER40 bulls even when German retail or manufacturing data is soft.
→ 🌍 Post-ATH Pullback = Value Re-Entry Zone
The index pulled back ~4.5% from the August 28 ATH of 26,618.
Historical data shows that the DAX's 5-month Channel Up structure
(April–September 2026) has produced strong bullish legs off
moving average pullback zones — structurally this is a
high-probability reload area for bulls.
→ 🛡️ European Defence Rearmament Demand
NATO's 2% GDP defence commitment is driving German defence-linked
spending — a genuine multi-year earnings tailwind for Industrials.
- - - - - - - - - - - - - - - - - - - - - - - - - - - - -
🔴 BEARISH DRIVERS / RISK FACTORS
- - - - - - - - - - - - - - - - - - - - - - - - - - - - -
→ 🏦 Fed Hike to 3.75%–4.00% — First Since 2023
The FOMC unanimously raised the Fed Funds rate by 25 bps on
September 16, 2026 — the first US rate hike since July 2023.
Fed Chair Kevin Warsh stated inflation remains elevated and
signalled at least one more hike this year. The September dot
plot projects a median year-end rate of 4.1%, up from 3.8%
in June. A hawkish Fed = stronger USD = tighter global financial
conditions = headwind for equity multiples.
→ 🇩🇪 ECB Deposit Rate Now at 2.50% — Hike Cycle Active
The ECB raised its deposit rate to 2.50% in September 2026 —
second hike this year. Markets are pricing the ECB deposit rate
at ~2.90% by December 2026, with potential for 3.40% by late
2027. Rising borrowing costs squeeze corporate investment and
consumer spending across the Eurozone.
→ 📊 German 10-Year Bund Yield at ~3.55% — Highest Since 2009
Rising Bund yields increase the discount rate applied to equity
cash flows, mechanically compressing valuation multiples.
Financials benefit but growth/tech and high-multiple sectors
face structural headwinds.
→ 💰 German Inflation: HICP at 2.9% (August 2026)
Inflation ticked higher month-on-month, from 2.8% in July to
2.9% in August. Core HICP (ex-food and energy) remains at 2.6%.
Persistently above-target inflation keeps ECB policy hawkish.
Final August HICP figures release on 17 September 2026.
→ 🛢️ Brent Crude Oil Above $100/Barrel
Elevated oil prices — fuelled by the ongoing US-Iran Gulf conflict
— are squeezing corporate margins across energy-intensive German
sectors (autos, chemicals, manufacturing) and driving broader
inflationary pressure across the Eurozone.
→ 🏭 Germany Manufacturing PMI Remains Below 50
Manufacturing PMI has been in contraction territory for much of
2025–2026. Germany's industrial heartland continues to face
structural challenges: high energy costs, excessive bureaucracy,
weak competitiveness, and the EV transition disrupting the
automotive supply chain.
→ 🌍 US-EU Tariff Uncertainty
US tariffs on EU goods are currently set at a 15% baseline rate
with steeper sector-specific levies on steel, aluminium, and
automobiles. This is a direct earnings headwind for Siemens,
automakers, and the broader German industrial supply chain.
→ 🌐 ZEW Eurozone Sentiment: 25.8 vs 39.9 Expected
The ZEW survey of Eurozone investor sentiment fell sharply to
25.8 in September versus a forecast of 39.9 — a significant
miss that signals deteriorating investor confidence in the
near-term Eurozone economic outlook.
→ 🔄 EUR/USD at ~1.1460 — Multi-Week Lows Post-Fed
EUR/USD has broken below its moving averages for the first time
since late July. The pair is now below both the 50-day and 200-day
EMAs, with RSI near 31.9 — reflecting persistent USD dominance
and bearish Euro momentum in the near term.
━━━━━━━━━━━━━━━━
📅 ECONOMIC CALENDAR — UPCOMING HIGH-IMPACT EVENTS 🔔
━━━━━━━━━━━━━━━━
All times in London Time (BST) 🇬🇧
🔴 HIGH IMPACT — TODAY / IMMINENT:
📌 17 Sep 2026 — Germany HICP Final (August) | 09:00 BST
Final confirmation of Germany's August inflation reading
(preliminary: +2.9% YoY, Core: +2.6%). A higher-than-expected
print increases ECB hawkish pressure. A softer print would ease
yields and be mildly supportive for GER40.
📌 17 Sep 2026 — Bank of England (BoE) Rate Decision | 12:00 BST
BoE holds Bank Rate at 3.75%. All eyes on forward guidance.
A hawkish BoE signal supports GBP/USD recovery and broader
European risk sentiment. A dovish hold could weigh on GBP.
📌 17 Sep 2026 — US Initial Jobless Claims | 13:30 BST
First major US data post-Fed hike. A weak labour market reading
(rising claims) could reduce the probability of the next Fed hike
— a potential short-term tailwind for equities. A strong reading
(falling claims) supports further Fed tightening — dollar bullish,
risk-asset cautious.
📌 17 Sep 2026 — US Philly Fed Manufacturing Index | 13:30 BST
Regional manufacturing health check. Below zero = contraction.
Watch as an early indicator of US economic resilience post-hike.
📌 17 Sep 2026 — ECB's Philip Lane Speech | 07:00 BST
ECB Chief Economist Lane speaks after the Eurozone's final
August inflation release. Any hawkish signal on October hike
probability would boost EUR and Bund yield expectations.
🟡 MEDIUM IMPACT — UPCOMING:
📌 Oct 2026 — ECB Rate Decision
Markets pricing ~78% probability of another 25 bps ECB hike
in October (deposit rate to 2.75%). A confirmed hike = tighter
financial conditions, but EUR supportive. A hold = Euro bearish.
📌 Oct–Nov 2026 — Germany Federal Budget Announcement (Q3 2026)
Sets the pace of deployment for the €500B infrastructure fund.
Faster-than-expected spending deployment = GER40 industrials
tailwind. Delayed or reduced deployment = structural headwind.
📌 Nov 2026 — FOMC Meeting (Next Fed Decision)
Dot plot signals at least one more US rate hike possible.
Markets watching for confirmation or reversal of hawkish bias.
━━━━━━━━━━━━━━━━
📚 EDUCATIONAL BREAKDOWN — THIEF TRADER MASTERCLASS 🎓
━━━━━━━━━━━━━━━━
📖 LESSON: HOW TO TRADE THE MOVING AVERAGE PULLBACK ON A DAY CHART
The Moving Average Pullback is one of the cleanest high-probability
setups in technical analysis — and it's exactly what we're targeting
on GER40 today. Here's why it works and how to approach it:
🔷 What Is a Moving Average Pullback?
When an asset is in a clear uptrend (series of higher highs and
higher lows), price will periodically retreat to touch its moving
average (commonly the 20, 50, or 200-period MA) before resuming the
trend direction. This "pullback to the mean" is institutional money
reloading positions at better prices — and retail traders can read
this signal.
🔷 Why Does It Work on GER40?
The DAX 40 is driven by institutions — pension funds, hedge funds,
and sovereign wealth. These players don't chase price. They WAIT for
the dip. The moving average zone is where their orders tend to cluster.
When price touches this zone and reverses, you're trading WITH the
institutional flow — not against it.
🔷 How the Thief Trader Uses It (Day Chart Confirmation):
Step 1 → Identify the major trend on the Daily chart (must be bullish)
Step 2 → Mark the key moving average zone (20 MA / 50 MA / 200 MA)
Step 3 → Wait for price to pull back INTO this zone
Step 4 → Drop to 15m / 30m chart for entry confirmation signal
(bullish engulfing, pin bar, break of structure to upside)
Step 5 → Enter with layered buy limit orders in the MA zone
Step 6 → Set SL below the MA zone / recent structural swing low
Step 7 → Target the next resistance zone (the vault) and escape clean
🔷 What Does "Layered Entry" Mean?
Instead of placing one single entry at one price level, the Thief
places multiple smaller buy limit orders across a price range within
the setup zone. This achieves two things:
1. A lower average entry price = more profit potential
2. If price dips further before reversing, more orders get filled
at even better prices — building a stronger position
🔷 What Are Overbought Conditions and Why Does the Thief Escape?
When price reaches the Police Force zone (our target at 26,500),
oscillators like RSI climb above 70 — signalling "overbought."
This means price has moved too far, too fast. Institutional players
start distributing (selling) their positions, trapping late buyers.
THIS is why the Thief never holds into the Police Force — take the
profit, leave the trap for others.
🔷 Why Does the Thief Use a Risk-to-Reward Framework?
Every heist needs a plan for if things go wrong. The SL is the
exit hatch — a pre-agreed point where the crew accepts a small
controlled loss rather than a catastrophic one. Good traders
treat every trade as a BUSINESS DECISION, not an emotional one.
Set the risk. Define the reward. Execute without fear.
━━━━━━━━━━━━━━━━
💬 THIEF TRADER MOTIVATION — FROM THE WAR ROOM 🔥
━━━━━━━━━━━━━━━━
"The best thieves don't steal from the market.
They WAIT for the market to offer what's already theirs.
Patience is not weakness — it's the sharpest weapon in the vault.
Load the plan. Trust the levels. Execute with precision.
Take the money. Protect the crew. Always live to trade another day."
— Thief Trader 🏴☠️
"The Frankfurt vault doesn't open for the reckless.
It opens for those who studied the blueprint,
watched the guards change shift at the MA zone,
and struck at exactly the right moment.
You are not gambling. You are ENGINEERING the heist."
— The Market Heist Master 💼🧠
━━━━━━━━━━━━━━━━
🤝 HEY THIEF OG's — SHOW THE CREW SOME LOVE! ❤️🔥
━━━━━━━━━━━━━━━━
If this blueprint added value to your trading day — drop a
LIKE 👍, a BOOST 🚀, and a FOLLOW 🔔 on TradingView.
Your support keeps the Thief Trader war room operational
and the blueprints coming thick and fast.
💬 Drop your thoughts in the comments — are you bullish or bearish
on GER40 from here? The crew wants to hear your read. Long 
Short 

Nasdaq range survives another test of supportRight now it looks like a waiting game for Nasdaq traders. The index has put in a string of lower highs since the record high was set in June, but since around the middle of August, price action has been largely rangebound between 29,670 on the topside and 28,875 below.
More recently, the price has spent more time towards the lower end of that range. There have been multiple tests of 28,875, along with a couple of false breaks below it, but none have stuck.
One option is to keep playing the range. If another break below 28,875 fails and the price reverses back above the level, longs could be considered with a tight stop beneath for protection, initially targeting the minor downtrend running from the mid-August high, then 29,670. The 50-day moving average sits in between and has capped the price over recent days, including in early European trade on Thursday.
At the other end, if the price moves back towards 29,670 and again fails to break higher, shorts could be established with a tight stop above for protection, targeting a retracement towards 28,875.
The other option is to wait for a breakout.
A break and close beneath 28,875 would provide the option to establish shorts with a tight stop above the level for protection, initially targeting 28,000, where the price did some work in late July. Beyond that, the 200-day moving average around 27,287 would come into play.
If the upper end of the range were to break with a close above 29,670, longs could be considered with a tight stop beneath for protection, initially targeting downtrend resistance running from the June record high. Above that, 30,245, the swing high set on August 17, would be the next level, followed by the record high at 30,756.
The oscillators had been pointing to building downside pressure, but that has since reversed on the daily timeframe. For now, it looks more like a case of letting the price action dictate the trade rather than forcing a bullish or bearish bias.
Good luck!
DS  Long
Long