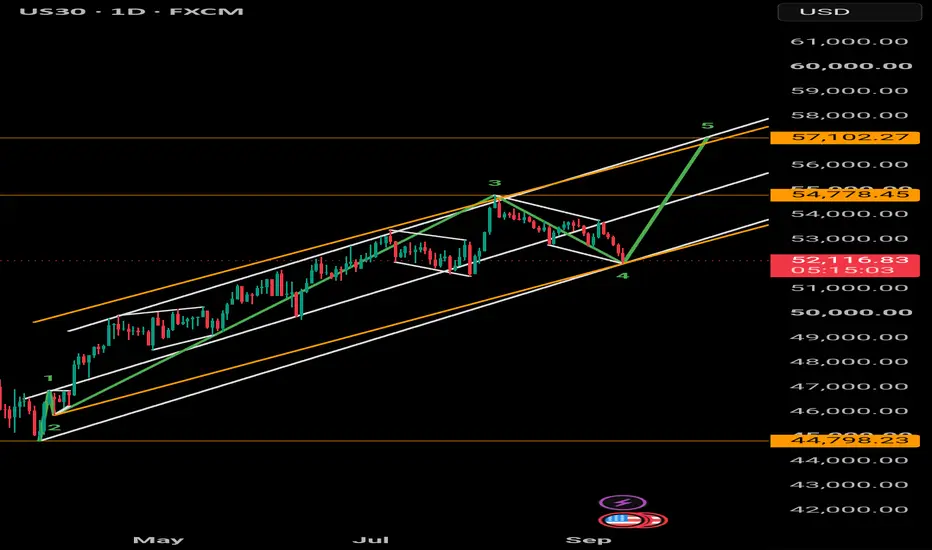
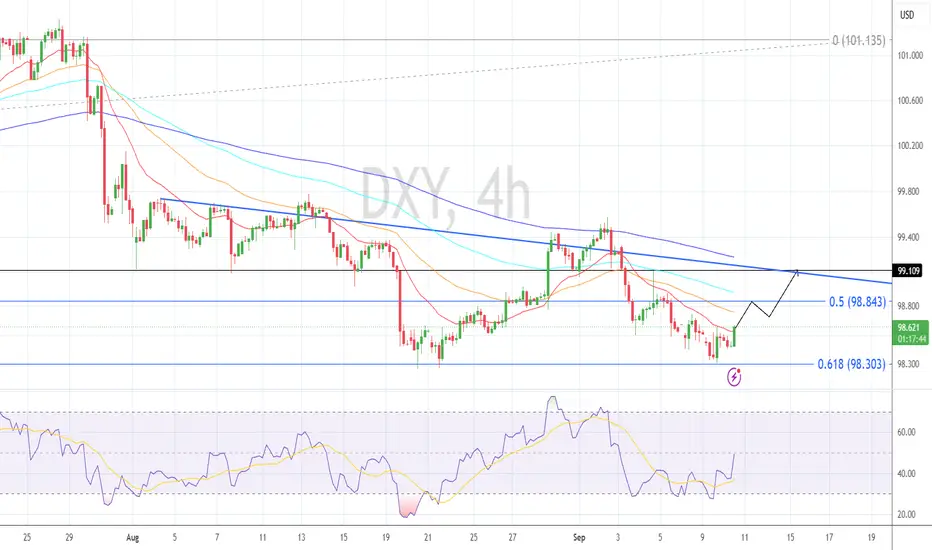
Long
Long
 Long
Long
Short 
SPX500 - Support Test Within the Descending ChannelSPX500 after breaking above the previous all-time high, price formed a new support area, which was later rejected on subsequent tests. Price is now trading inside the red descending channel and approaching its lower boundary, which aligns with the blue support area, creating an important confluence zone to monitor.
⭕As price approaches this zone, we can start looking for buy setups on lower timeframes, anticipating a bullish reaction as a corrective phase within the descending channel.
⭕However, if this support zone fails to hold and sellers manage to push price below it and the lower boundary of the channel, the focus would shift toward the lower support and demand area, where another potential reaction could develop.
The reaction around this confluence zone could determine whether buyers are ready to defend this support area, or if price is preparing for deeper move lower.
⚠️ Disclaimer: This analysis reflects my personal market view and is not financial advice.
Rayan Nasser
#SPX500 #SP500 #S&P500 #TechnicalAnalysis #PriceAction #Trading #StockMarket  Long
Long
Treasury Yields May Have More UpsideTreasury yields are the new big catalyst for traders. Today’s idea studies the key 10-year rate using long-term monthly candles.
First consider the surge from 2021 to September 2023 as the coronavirus pandemic ended. It followed a multi-decade downtrend that started in 1987. That could mean a long-term reversal took place.
Second, TNX made a low of 3.79 in December 2023. A lower low of 3.60 occurred in September 2024, followed by a higher low of 3.96 in February 2026. That rounded basing pattern, immediately after the big surge, may be viewed as consolidation with potential for upside continuation.
Third, TNX has broken a falling trendline along the highs of 2023 and 2025.
Finally, this decade’s peak occurred at 5 percent. Above that, we found a series of levels between 5.24 and 5.53. All of them match the highs of the post-2000 era and the administration of President George W. Bush.
Given recent gains in oil prices and inflation risk, traders may eye those longer-term levels from the first decade of this century as logical stopping points.
TradeStation has, for decades, advanced the trading industry, providing access to stocks, options and futures. If you're born to trade, we could be for you. Learn more here about TradingView’s Broker of the Year!
Past performance, whether actual or indicated by historical tests of strategies, is no guarantee of future performance or success. There is a possibility that you may sustain a loss equal to or greater than your entire investment regardless of which asset class you trade (equities, options or futures); therefore, you should not invest or risk money that you cannot afford to lose. Online trading is not suitable for all investors. View the document titled Characteristics and Risks of Standardized Options at www.TradeStation.com . Before trading any asset class, customers must read the relevant risk disclosure statements on www.TradeStation.com . System access and trade placement and execution may be delayed or fail due to market volatility and volume, quote delays, system and software errors, Internet traffic, outages and other factors.
Securities and futures trading is offered to self-directed customers by TradeStation Securities, Inc., a broker-dealer registered with the Securities and Exchange Commission and a futures commission merchant licensed with the Commodity Futures Trading Commission). TradeStation Securities is a member of the Financial Industry Regulatory Authority, the National Futures Association, and a number of exchanges.
TradeStation Securities, Inc. and TradeStation Technologies, Inc. are each wholly owned subsidiaries of TradeStation Group, Inc., both operating, and providing products and services, under the TradeStation brand and trademark. When applying for, or purchasing, accounts, subscriptions, products and services, it is important that you know which company you will be dealing with. Visit www.TradeStation.com for further important information explaining what this means.
 Long
Long
Long 
 Short
Short
Short 
German 30 — All-Time High Liquidity Sweep | Bearish Reversal German 30 is approaching its all-time high, placing price in a critical area where significant buy-side liquidity is likely resting above the recent highs. 📉⚡
From my analysis, the market may first push higher to sweep the liquidity above the highs, creating the appearance of continued bullish strength and attracting late buyers. Once that liquidity is collected, the focus shifts toward a potential bearish rejection and reversal.
The key idea behind this setup is not to sell blindly at the highs, but to allow the market to complete the liquidity grab and then look for confirmation that sellers are taking control. A rejection from the upper levels, followed by weakening bullish momentum and bearish price action, would strengthen the sell-side scenario.
If the liquidity sweep plays out as anticipated, German 30 could begin a deeper downside move as trapped buyers exit and sellers take control. Patience, confirmation, discipline and execution remain the core of this setup. 🎯🔻
Bias: Sell-Side 🔻 | Setup: Liquidity Sweep → Rejection → Bearish Reversal  Short
Short
 Long
Long
FTSE 100 Mega Channel Up topped and targets 1M MA50.FTSE 100 (UK100) has made a Double Top almost at the top of its 17-year Channel Up, which started at the bottom of the 2008 U.S. Housing Crisis. The first High of that Double Top was in February and delivered March's strong red candle and as you can see, Double Top formations within this 17-year pattern have initiated strong technical Bearish Leg corrections.
The use of the Sine Waves makes the picture even clearer as they point out almost exactly every major Cycle Top since the 2008 Housing Crisis (5 such Cycle including that). And we are on one of them.
At the same time, the index also hit the top of the 6-year Channel Up that started shortly after the COVID crash bottom. Every correction (Bear Cycle/ Bearish Leg) within this pattern hit the 1M MA50 (blue trend-line) and rebounded. With the exception of the COVID flash crash which even broke below its 1M MA200 (orange trend-line), every other Bear Cycle since June 2012, hit the 1M MA100 (green trend-line) and rebounded.
In addition, all corrections reached the 0.382 (blue) Fibonacci retracement level (with the exception of the October 2022 Low).
As a result, we are expecting FTSE to close the year with a strong technical Bearish Leg, hitting at least its 1M MA50 around 9200 (even by Q1 2027), which would be marginally above the 0.382 (blue) Fib and also make contact with the bottom of the COVID Channel Up as well as the 0.5 Fibonacci retracement level of the post 2008 Channel Up.
---
** Please LIKE 👍, FOLLOW ✅, SHARE 🙌 and COMMENT ✍ if you enjoy this idea! Also share your ideas and charts in the comments section below! This is best way to keep it relevant, support us, keep the content here free and allow the idea to reach as many people as possible. **
---
💸💸💸💸💸💸
👇 👇 👇 👇 👇 👇  Short
Short
4 Factors Influencing the S&P 500's Movements!The S&P 500 is trading near 7,646 points, down about 2% from its all-time high of 7,812 points reached in mid-August, while still holding gains of nearly 12% since the beginning of the year. This apparent contradiction, a short-term correction within a strong annual uptrend, is the essence of the current situation, making the coming weeks crucial in determining whether what we are witnessing is merely a technical pause or the start of a deeper correction.
1. The Energy Shock Returns
The most significant factor currently putting pressure on US stocks has not originated within the stock market itself, but rather in the oil market. Brent crude rose by about 3.4% to surpass $101 per barrel, reaching its highest level since May, following renewed escalation in the Middle East. This represents a nearly 25% increase in oil prices in just one month.
The significance of this development extends beyond fuel prices: rising energy costs are squeezing corporate profit margins and threatening to reignite inflation at a time when the Federal Reserve cannot afford to be lenient. This was clearly reflected in sector performance, with the energy sector being the only one to rise on September 9, while all other major sectors declined.
2. Bond Yields Near 5%
The yield on the benchmark 10-year US Treasury note rose to around 4.84%, its highest level in 52 weeks and approaching the psychologically important 5% mark. Higher real yields increase the discount rate used to price future cash flows, putting particular pressure on high-value growth and technology stocks, which have driven the index's rise throughout the year.
3. The Fed and the Possibility of an Interest Rate Hike
The Federal Reserve held interest rates steady at the 3.50%–3.75% range for the fifth consecutive meeting. Notably, market pricing has shifted dramatically: the FedWatch tool now indicates a near 58% probability of a 25-basis-point rate hike at the September 15–16 meeting, up from below 50% just days earlier.
This shift was driven by a more hawkish tone from Federal Reserve Chair Kevin Warsh at Jackson Hole, in contrast with more cautious remarks from Governor Christopher Waller, who indicated a preference for keeping rates unchanged. This division within the committee means that the September decision is now more dependent on upcoming data than ever before.
4. Strong Labor Market and Resilient Inflation
The August nonfarm payrolls report was surprisingly strong: 162,000 jobs were added compared to expectations of only 53,000, with the unemployment rate holding steady at 4.1%. While this is good news for the economy, it reduces the Fed's justification for monetary easing.
On the inflation front, the Consumer Price Index (CPI) rose 3.4% year-over-year in July, with the core reading at 2.5%. Markets are awaiting the August reading, due on Friday, September 11, which represents the most important test just before the Federal Reserve meeting. A higher-than-expected reading, especially considering the impact of oil, could tip the scales in favor of a rate hike and put significant downward pressure on the index, while a moderate reading could quickly restore buying momentum.
DAX 40 Market Structure: Bearish Pressure Builds━━━━━━━━━━━
🇩🇪💼 GER40 | GERMANY 40 INDEX CFD 💼🇩🇪
🏴☠️ THE GREAT FRANKFURT HEIST — BEARISH BLUEPRINT 🏴☠️
📉 Day Trade / Swing Trade Opportunity Guide 🎯⏳
━━━━━━━━━━━
Dear Ladies & Gentleman (Thief OG's) 👋🧠💰
Welcome to the Thief Trader war room. The Frankfurt vault is wide open and the GER40 blueprint is locked, loaded, and ready to execute. We are eyeing a short-side opportunity on Germany's flagship index — the GER40 (DAX 40) — and the heist map is drawn. Let's walk through it together, crew.
━━━━━━━━━━━
📡 LIVE MARKET SNAPSHOT — 10 SEPTEMBER 2026 (London Time)
━━━━━━━━━━━
🔹 GER40 (DAX 40) Last Close ~26,008 pts (Tue 9 Sep 2026)
🔹 GER40 All-Time High 26,620 pts (28 Aug 2026)
🔹 GER40 Weekly Change -0.40%
🔹 GER40 Monthly Change -2.19%
🔹 EUR/USD Rate ~1.1644
🔹 Brent Crude Oil ~$101 / bbl (intraday spike)
🔹 US500 (S&P 500) ~7,629 pts (9 Sep 2026 close)
🔹 ECB Deposit Rate (Current) 2.25%
🔹 ECB Rate Decision 🔴 LIVE TODAY +25 bps hike to 2.50% expected (12:15 GMT)
⚠️ HIGH-IMPACT EVENT ALERT: ECB Interest Rate Decision & Press Conference
📅 Date: TODAY — Thursday, 10 September 2026
🕐 Decision: 12:15 GMT | Press Conference: 12:45 GMT (President Lagarde)
⚡ EXPECT EXTREME VOLATILITY — Trade with caution around announcement windows.
━━━━━━━━━━━
🗺️ MY HEIST PLAN — Entry, Vault Targets & Escape Hatch 💰🔐
━━━━━━━━━━━
🚪 ENTRY — OPEN ENTRY (Flexible)
YOU CAN ENTER THE MARKET AT ANY LEVEL — at market, on a pullback into the Police Force zone, on a breakdown candle, or on a retracement. The Thief Trader does not give fixed entry levels. This is YOUR trade. Pick your spot, read your momentum, and confirm your signal before pulling the trigger. Day traders can scalp entries on the 15M or 1H chart; swing traders can position from the 4H or daily.
🏦 VAULT — PROFIT TARGET ZONES (Thief OG's Escape Route)
At the major support zone below current price — which is acting as a strong demand floor, combined with oversold conditions, trapped long positions, and a high-probability reversal cluster — the Police Force down there is ready to push back hard against the sellers. Do NOT overstay your welcome. When the price hits these vaults, pack your loot and escape.
🎯 PRIMARY TARGET (Day Traders) — 25,300 pts
🎯 MAIN / FINAL TARGET (Swing Traders) — 25,000 pts
⚠️ Dear Ladies & Gentleman (Thief OG's) i'am not recommended to set only my TP. its your own choice you can make money then take money at your own risk.
🚨 ESCAPE HATCH — Stop Loss (Thief SL)
🛑 Thief SL @ 25,900 pts (above the Police Force resistance zone)
⚠️ Dear Ladies & Gentleman (Thief OG's) i'am not recommended to set only my SL. its your own choice you can make money then take money at your own risk.
📌 Position Management Tips for the OG Crew:
- Day Traders: Scale out 50% at 25,300 and trail the rest toward 25,000
- Swing Traders: Hold with patience and exit in full near 25,000 vault zone
- Move stop to breakeven once price moves 200–300 pts in your favour
- Do NOT hold through the ECB press conference without a tight plan — volatility is extreme
━━━━━━━━━━━
📋 POSSIBLE SCENARIO — What Could Happen Next? 🔮
━━━━━━━━━━━
📉 BEARISH SCENARIO (Primary Bias):
Price continues its descent from the 26,620 all-time high. The 25,900 Police Force level holds as resistance on any bounce attempt. Momentum carries price toward 25,300 (Primary Target) and then 25,000 (Final Vault). A confirmed ECB rate hike today combined with hawkish forward guidance could accelerate the selloff. Industrials and banks continue to lead losses as higher rates and elevated oil prices squeeze margins.
📈 BULLISH SCENARIO (Counter-Bias — Watch Out):
If the ECB surprises with a softer tone or signals a pause after today's hike, markets could interpret this as the end of the tightening cycle — triggering a sharp relief rally. A reclaim and close above 26,200–26,300 on the daily chart would invalidate the bearish descending channel and potentially open a retest of 26,620 highs. SAP, RWE, and E.ON — which have been the index's strongest components — could lead a recovery if energy stocks outperform.
➡️ SIDEWAYS SCENARIO (Consolidation):
Price chops between 25,900 (resistance) and 25,300 (support) in a tight holding pattern ahead of or following the ECB decision. This would represent a technical consolidation before the next directional move. Day traders could range-trade this zone; swing traders should wait for confirmation of breakout direction.
━━━━━━━━━━━━━━━━━━━━━━━━━━━━━━━━━━━━━━━━━━━━━━━━━━━━━━
📰 FUNDAMENTAL & ECONOMICS BREAKDOWN — What The Market Says 🌍💹
━━━━━━━━━━━━━━━━━━━━━━━━━━━━━━━━━━━━━━━━━━━━━━━━━━━━━━
This section reflects actual live market conditions — both bullish and bearish drivers — as reported by the market. This is what the data says, independent of trade direction.
─────────────────────────────
🔴 BEARISH FUNDAMENTAL DRIVERS
─────────────────────────────
🛢️ OIL PRICE SURGE — THE BIG THREAT:
Brent Crude has surged to ~$101 per barrel, briefly breaching the $100 mark for the first time since late July 2026. The escalation of US-Iran military clashes in the Gulf — including the US military striking five Iranian crude oil tankers — has dramatically tightened global energy supply expectations. For Germany, a net energy importer with a heavy industrial base (Chemicals, Autos, Manufacturing), this is a direct margin squeeze. Energy-intensive sectors like industrials are already leading DAX losses.
🏦 ECB HAWKISH RATE HIKE — LIVE EVENT TODAY:
The ECB is widely expected to raise its Deposit Facility Rate by 25 basis points to 2.50% at today's decision (12:15 GMT, 10 September 2026). This would mark the second rate hike of 2026, with markets now pricing two ECB rate hikes for the full year and a terminal deposit rate of ~3.1% by late 2027. Higher rates increase the discount rate on future corporate earnings — mechanically reducing equity valuations across the DAX 40 universe. The ECB's own staff projections (to be released today) will be closely scrutinised for updated growth and inflation forecasts.
📉 EUROZONE INFLATION STILL ELEVATED:
Eurozone HICP inflation reached 3.3% in August 2026, with energy inflation surging to 14.3% year-on-year. Germany's CPI reached 2.8% in July after the expiration of the fuel tax rebate, above the ECB's 2% target. Core inflation, which strips out food and energy, climbed to 2.5%, signalling that price pressures are broadening beyond just energy — this keeps the ECB in tightening mode.
📊 GERMAN ECONOMIC GROWTH UNDER PRESSURE:
Germany's GDP growth is forecast at just +0.4% to +0.9% for full-year 2026 — the weakest of any major eurozone economy. Germany's unemployment rose by 71,000 in July 2026, surpassing 3 million unemployed (unemployment rate: 6.4%). The ECB's Survey of Professional Forecasters placed eurozone GDP growth for 2026 at just 0.9%, revised lower due to the energy shock from the US-Iran war. Weak growth combined with high inflation (stagflation-lite) is historically toxic for equity index performance.
📊 BOND YIELDS AT 15-YEAR HIGHS:
German 10-year Bund yields have reached a 15-year high, directly raising the discount rate for German equities and making fixed income more attractive relative to stocks. This is a structural headwind for the DAX 40.
📉 STOCK-SPECIFIC PRESSURE:
Rheinmetall fell 3.16%, Beiersdorf dropped ~2% after Deutsche Bank downgraded to Sell, Deutsche Boerse declined 1.7% after announcing a €600 million convertible bond. These are heavyweight DAX components and their weakness drags the index.
─────────────────────────────
🟢 BULLISH FUNDAMENTAL DRIVERS
─────────────────────────────
💪 GERMAN FISCAL EXPANSION:
Germany's constitutional reform from March 2025 unlocked a major fiscal expansion program. Government spending is a positive growth tailwind for corporate Germany, particularly for infrastructure, defence, and clean energy companies in the DAX.
📈 GERMAN GDP UPGRADE — IFO AUTUMN FORECAST:
The ifo Institute (September 2026 Autumn Forecast) raised Germany's 2026 GDP growth estimate to +1.4% — a significant +0.6 percentage point upgrade from their summer forecast. Germany's recovery forces are gaining momentum, powered by fiscal stimulus and growing international demand.
🌍 EXPORT RESILIENCE:
A weaker Euro (EUR/USD ~1.1644 vs recent highs) actually supports German exporters by making their goods cheaper in global markets. DAX heavyweights like SAP, Siemens, BMW, and Volkswagen benefit from currency weakness — this is a structural bullish offset.
⚡ ENERGY SECTOR UPSIDE:
Higher oil prices hurt industrials but benefit energy producers and utilities within the DAX. RWE (+1.65%) and E.ON (+1.50%) were among the top DAX gainers on 9 September, providing a partial offset to index losses.
🏁 END OF RATE HIKE CYCLE SPECULATION:
Some analysts see today's hike as potentially the last of the current cycle, given that "underlying inflation measures have continued to ease" and "wage pressures remain relatively contained." If Lagarde signals a prolonged hold after today, this could trigger a sharp bullish relief rally for European equities.
━━━━━━━━━━━
👁️ AREAS I AM WATCHING — Correlated Pairs & Markets 🔭📌
━━━━━━━━━━━
The GER40 does not trade in isolation. These correlated markets give us confirmation, divergence signals, and early warning signs. Always cross-reference before sizing your position.
─────────────────────────────────────────────────────────
📊 EUR/USD (Euro / US Dollar) — "The Fiber"
💵 Current Rate: ~1.1644
🔗 Correlation: INVERSE to GER40 (generally)
Key Point: A stronger Euro raises export costs for German blue chips and can drag on DAX performance. A weaker EUR/USD supports export earnings. With the ECB hiking today, EUR/USD may initially spike — which could cap any DAX recovery attempt. If EUR/USD breaks above 1.1700 decisively, expect DAX to face added headwinds from the currency channel. If EUR/USD softens post-ECB, it could temporarily cushion DAX downside.
─────────────────────────────────────────────────────────
📊 UK100 (FTSE 100) — "The British Bulldog"
🔗 Correlation: POSITIVE to GER40
Key Point: Europe's two heavyweight indices — DAX and FTSE — historically track each other under risk-on and risk-off conditions. When the DAX has extended losses over consecutive sessions, the UK100 usually begins to wobble too. If GER40 breaks below 25,600, watch the UK100 for sympathy weakness. A UK100 break below its own support levels would add bearish confluence to the GER40 setup.
─────────────────────────────────────────────────────────
📊 US30 (Dow Jones Industrial Average) — "Wall Street's Big Dog"
🔗 Correlation: POSITIVE to GER40
Key Point: The US30 declined alongside European markets on 9 September 2026, falling ~396 points (-0.36%) as higher Treasury yields and oil prices hit sentiment globally. Rising US bond yields — now at 52-week highs — are being driven by the same energy-inflation dynamic hitting European markets. If the Fed meeting next week delivers a hawkish surprise, US30 downside will spill over into GER40 weakness. Watch for US30 below its key moving average support for confirmation.
─────────────────────────────────────────────────────────
📊 US500 (S&P 500) — "The Big Board"
🔗 Correlation: POSITIVE to GER40
Current Level: ~7,629 (9 Sep 2026 close, -0.58% session)
Key Point: The US500 is also in a shallow pullback after its own recent highs, declining -1.60% over the past month. A continued US500 selloff driven by tech weakness (Alphabet -3.18%, Salesforce -3.01%) reduces risk appetite globally and puts selling pressure on the GER40. These two indices are locked in a risk-sentiment feedback loop — watch them together.
─────────────────────────────────────────────────────────
📊 USOIL / WTI Crude Oil — "The Black Gold Factor"
🔗 Correlation: INVERSE (high oil = bad for DAX industrials)
Current Level: Brent ~$101/bbl; WTI approaching $100
Key Point: The most critical macro input for the GER40 right now. Surging oil prices from US-Iran conflict escalation squeeze German industrial profit margins, fuel inflation, and force the ECB to keep hiking. Every $5/bbl increase in Brent is an additional headwind for energy-intensive DAX sectors. If Brent holds above $100 through October, the GER40 faces a structural ceiling.
─────────────────────────────────────────────────────────
📊 XAU/USD (Gold / US Dollar) — "The Safety Magnet"
🔗 Correlation: INVERSE to risk assets including GER40
Key Point: In a risk-off environment, capital flows FROM equity indices INTO gold. Rising geopolitical tensions (US-Iran war, Strait of Hormuz disruptions), soaring oil prices, and hawkish central banks are all classic gold-buying catalysts. A sustained gold rally above its recent highs would be a strong confirmation that risk-off is dominating — and that the GER40 short setup is gaining macro tailwind. Monitor gold closely as a sentiment indicator.
─────────────────────────────────────────────────────────
━━━━━━━━━━━
🎓 EDUCATIONAL BREAKDOWN — Understanding the GER40 / DAX 40 🏫📚
━━━━━━━━━━━
WHAT EXACTLY IS THE GER40 (DAX 40)?
The GER40 — also known as the DAX 40 or simply the DAX — is Germany's premier stock market index, tracking the 40 largest and most liquid blue-chip companies listed on the Frankfurt Stock Exchange (Deutsche Börse). Think of it as Germany's answer to the Dow Jones or the UK100 — it is the heartbeat of the German and, by extension, the broader European economy.
The index is calculated using a free-float, market-capitalisation-weighted methodology, meaning only publicly tradable shares count toward a company's weighting. Companies must maintain a minimum 10% free float, demonstrate adequate liquidity, and meet strict financial reporting standards to qualify for inclusion. The composition is reviewed quarterly.
The GER40 accounts for roughly 80% of Germany's total market capitalisation — making it far more representative of the economy than most global indices. The index spans sectors including Financials, Industrials, Technology, Healthcare, Chemicals, Autos, and Utilities. Key components include SAP (Germany's tech giant), Siemens, BMW, Volkswagen, Allianz, Deutsche Bank, Rheinmetall, RWE, and E.ON.
WHY DOES THE GER40 MATTER FOR GLOBAL TRADERS?
🔹 It is the most-watched index in continental Europe.
🔹 It serves as a real-time barometer for European economic health.
🔹 It is highly sensitive to energy prices — Germany is one of the largest industrial economies in the world and a net energy importer, making it disproportionately affected by oil and gas price swings.
🔹 The EUR/USD exchange rate directly influences GER40 corporate earnings — a weaker Euro boosts export competitiveness; a stronger Euro compresses margins.
🔹 ECB monetary policy decisions move the GER40 violently — rate hikes raise borrowing costs and reduce the present value of future corporate earnings.
🔹 Geopolitical events in energy-producing regions (Middle East, Russia) create outsized volatility in the GER40 versus other global indices.
HOW IS THE GER40 CFD DIFFERENT FROM THE UNDERLYING INDEX?
When you trade GER40 as a CFD (Contract For Difference), you are not buying the underlying shares of the 40 companies. Instead, you are speculating on the price movement of the index. CFDs allow you to go long (buy) OR short (sell), use leverage, and trade outside of traditional Frankfurt Stock Exchange hours. However, CFD trading amplifies both gains AND losses — this is why disciplined position sizing, a defined stop loss (Thief SL), and clear profit targets (Vault levels) are essential. Never oversize. Never trade without a plan. The Thief Trader way is: Plan the heist first, execute second, escape with the loot third. 🏴☠️
━━━━━━━━━━━
💬 THIEF TRADER MOTIVATION — From The Boss To The OG Crew 🏆🔥
━━━━━━━━━━━
"The market is the most expensive classroom in the world. Every candle is a lesson. Every loss is tuition. Every winning trade is proof that your education is paying off." — Thief Boss 🎓
"A good thief never rushes the vault. A great thief waits until the alarm is off, the guards are distracted, and the timing is perfect. Trade like a great thief." — Thief Boss 🏴☠️
"Risk management isn't the boring part of trading. It IS trading. The trade setup is just the heist plan. Protecting your capital is the escape route. Always know your exit before you enter." — Thief Boss 🚪💨
Stay disciplined, Thief OG's. The market rewards patience. 🙌
━━━━━━━━━━━
🤝 JOIN THE HEIST CREW — Community Call To Action 📣
━━━━━━━━━━━
If this idea gave you value, fuel the crew!
👍 BOOST this idea to keep the Thief Trader signal strong on TradingView!
❤️ LIKE to show your OG crew love!
🔔 FOLLOW @ThiefTrader so you never miss the next heist blueprint!
💬 COMMENT your entry level, your take, your questions — let's build together!
The Thief Trader community is built on SHARING knowledge, not hoarding it.
Every boost, every like, every comment helps more traders find these setups.
Be part of the crew. Power the mission. 🏴☠️💼  Short
Short
KSE-100 Index (PSX)—Daily Chart-Correction in a Larger UptrendMarket Structure
The KSE-100 remains in a well-defined primary uptrend, having rallied from the October 2025 base near 143,886 to a swing high of 187,675 in July 2026 — a move that unfolded cleanly along an ascending trendline off the higher lows. Since tagging that high, the index has been carving out a corrective structure: a sequence of lower highs (192,xxx → 188,xxx → 184,xxx) against a series of higher lows, compressing price into the current consolidation zone.
Critically, this pullback shows no bearish divergence on momentum — the correction is unfolding as a controlled retracement rather than a trend-reversal signal. That distinction matters: absence of divergence at this stage favors continuation once the correction resolves, rather than a structural top.
Fibonacci Confluence
Measuring the impulse leg from the 143,886 low to the 187,675 high:
Level Price Significance
0.236 177,341 First retracement shelf
0.382 170,948 Current reaction zone — price is testing this level now
0.5 165,781 Mid-range equilibrium
0.618 160,614 Confluent with the previous swing-low demand zone
0.786 153,257 Deep retracement / trend-invalidation area
Price is currently sitting almost exactly on the 0.382 retracement (170,948), which also lines up with a prior horizontal support/resistance shelf (the "swing low" box). This is the first line of defense for bulls.
Scenario Mapping
Bullish Case — Hold Above 0.382: A bounce from the current 0.382 zone keeps the broader trend intact and projects continuation toward 213,334, extending the same trendline geometry that drove the October–July advance.
Bullish Case — Deeper Flush to 0.618: Should the 0.382 zone fail to hold, the next meaningful demand sits at the 0.618 retracement (160,614), directly overlapping the previous swing-low congestion (160,000–164,000). A reaction from this deeper zone would still respect the primary uptrend and projects a target near 204,804 — a slightly reduced but still bullish measured move.
Invalidation: A daily close through 160,614 with follow-through would erode the higher-low structure and put the 153,257 (0.786) zone — and the broader uptrend thesis — into question.
Key Levels to Watch
Immediate support: 170,948 (0.382 fib / swing-low shelf) — currently being tested
Secondary support: 160,614 (0.618 fib / previous swing low)
Upside targets: 204,804 → 213,334
Structure invalidation: Sustained break below 160,614
Bottom Line
The KSE-100 is in a healthy, non-divergent correction within a larger uptrend, currently probing the 0.382 retracement. As long as reactions continue to materialize at the 0.382 or 0.618 zones, the path of least resistance remains higher, with 204,800–213,300 as the next major upside objectives. A clean break and close below 160,614 would be the first real warning sign that the corrective phase is turning structural.
This analysis is for educational purposes only and does not constitute financial advice. Always manage risk according to your own trading plan. Long 
JPN225: Triangle broken, Trade in profit what comes next?In this video is the update to the Nikkei 225 trade idea from 3 September 2026, when Japan’s 10-year bond yield surpassed 3% for the first time since 1996 and the index dropped by 2.85% to its lowest levels in four weeks at 64,325. Entry: 63,000-64,274. Descending triangle was the formation and the contracting MACD histogram which was deep into the negative zone was the trigger;the exact setup that called for the best week for the Hang Seng since March 2025. On 4 September Softbank and AI semiconductor stocks jumped 806 points. On 7 September, thanks to Kioxia and SoftBank the index increased by 2.12% to 66,399. Descending triangle has been violated to the upside and the trade is now making money. However, the chart has formed a new symmetrical triangle inside the rebound phase, and in this video I will show you exactly where this triangle is, where the breakout level is, where the trailing stop now stands, and why 66,250 is the next target level. Whether you trade indices or want to learn how patterns develop during the recovery, this video is for you.  Long
Long

 Short
Short