Getting started with Supercharts
Supercharts are the core of TradingView. They allow you to track price changes, compare assets, and access other TradingView products for a full financial analysis experience. You can personalize them by applying and configuring various tools, practice trading, and conduct real trades through our verified brokers.
TABLE OF CONTENTS
The top toolbar
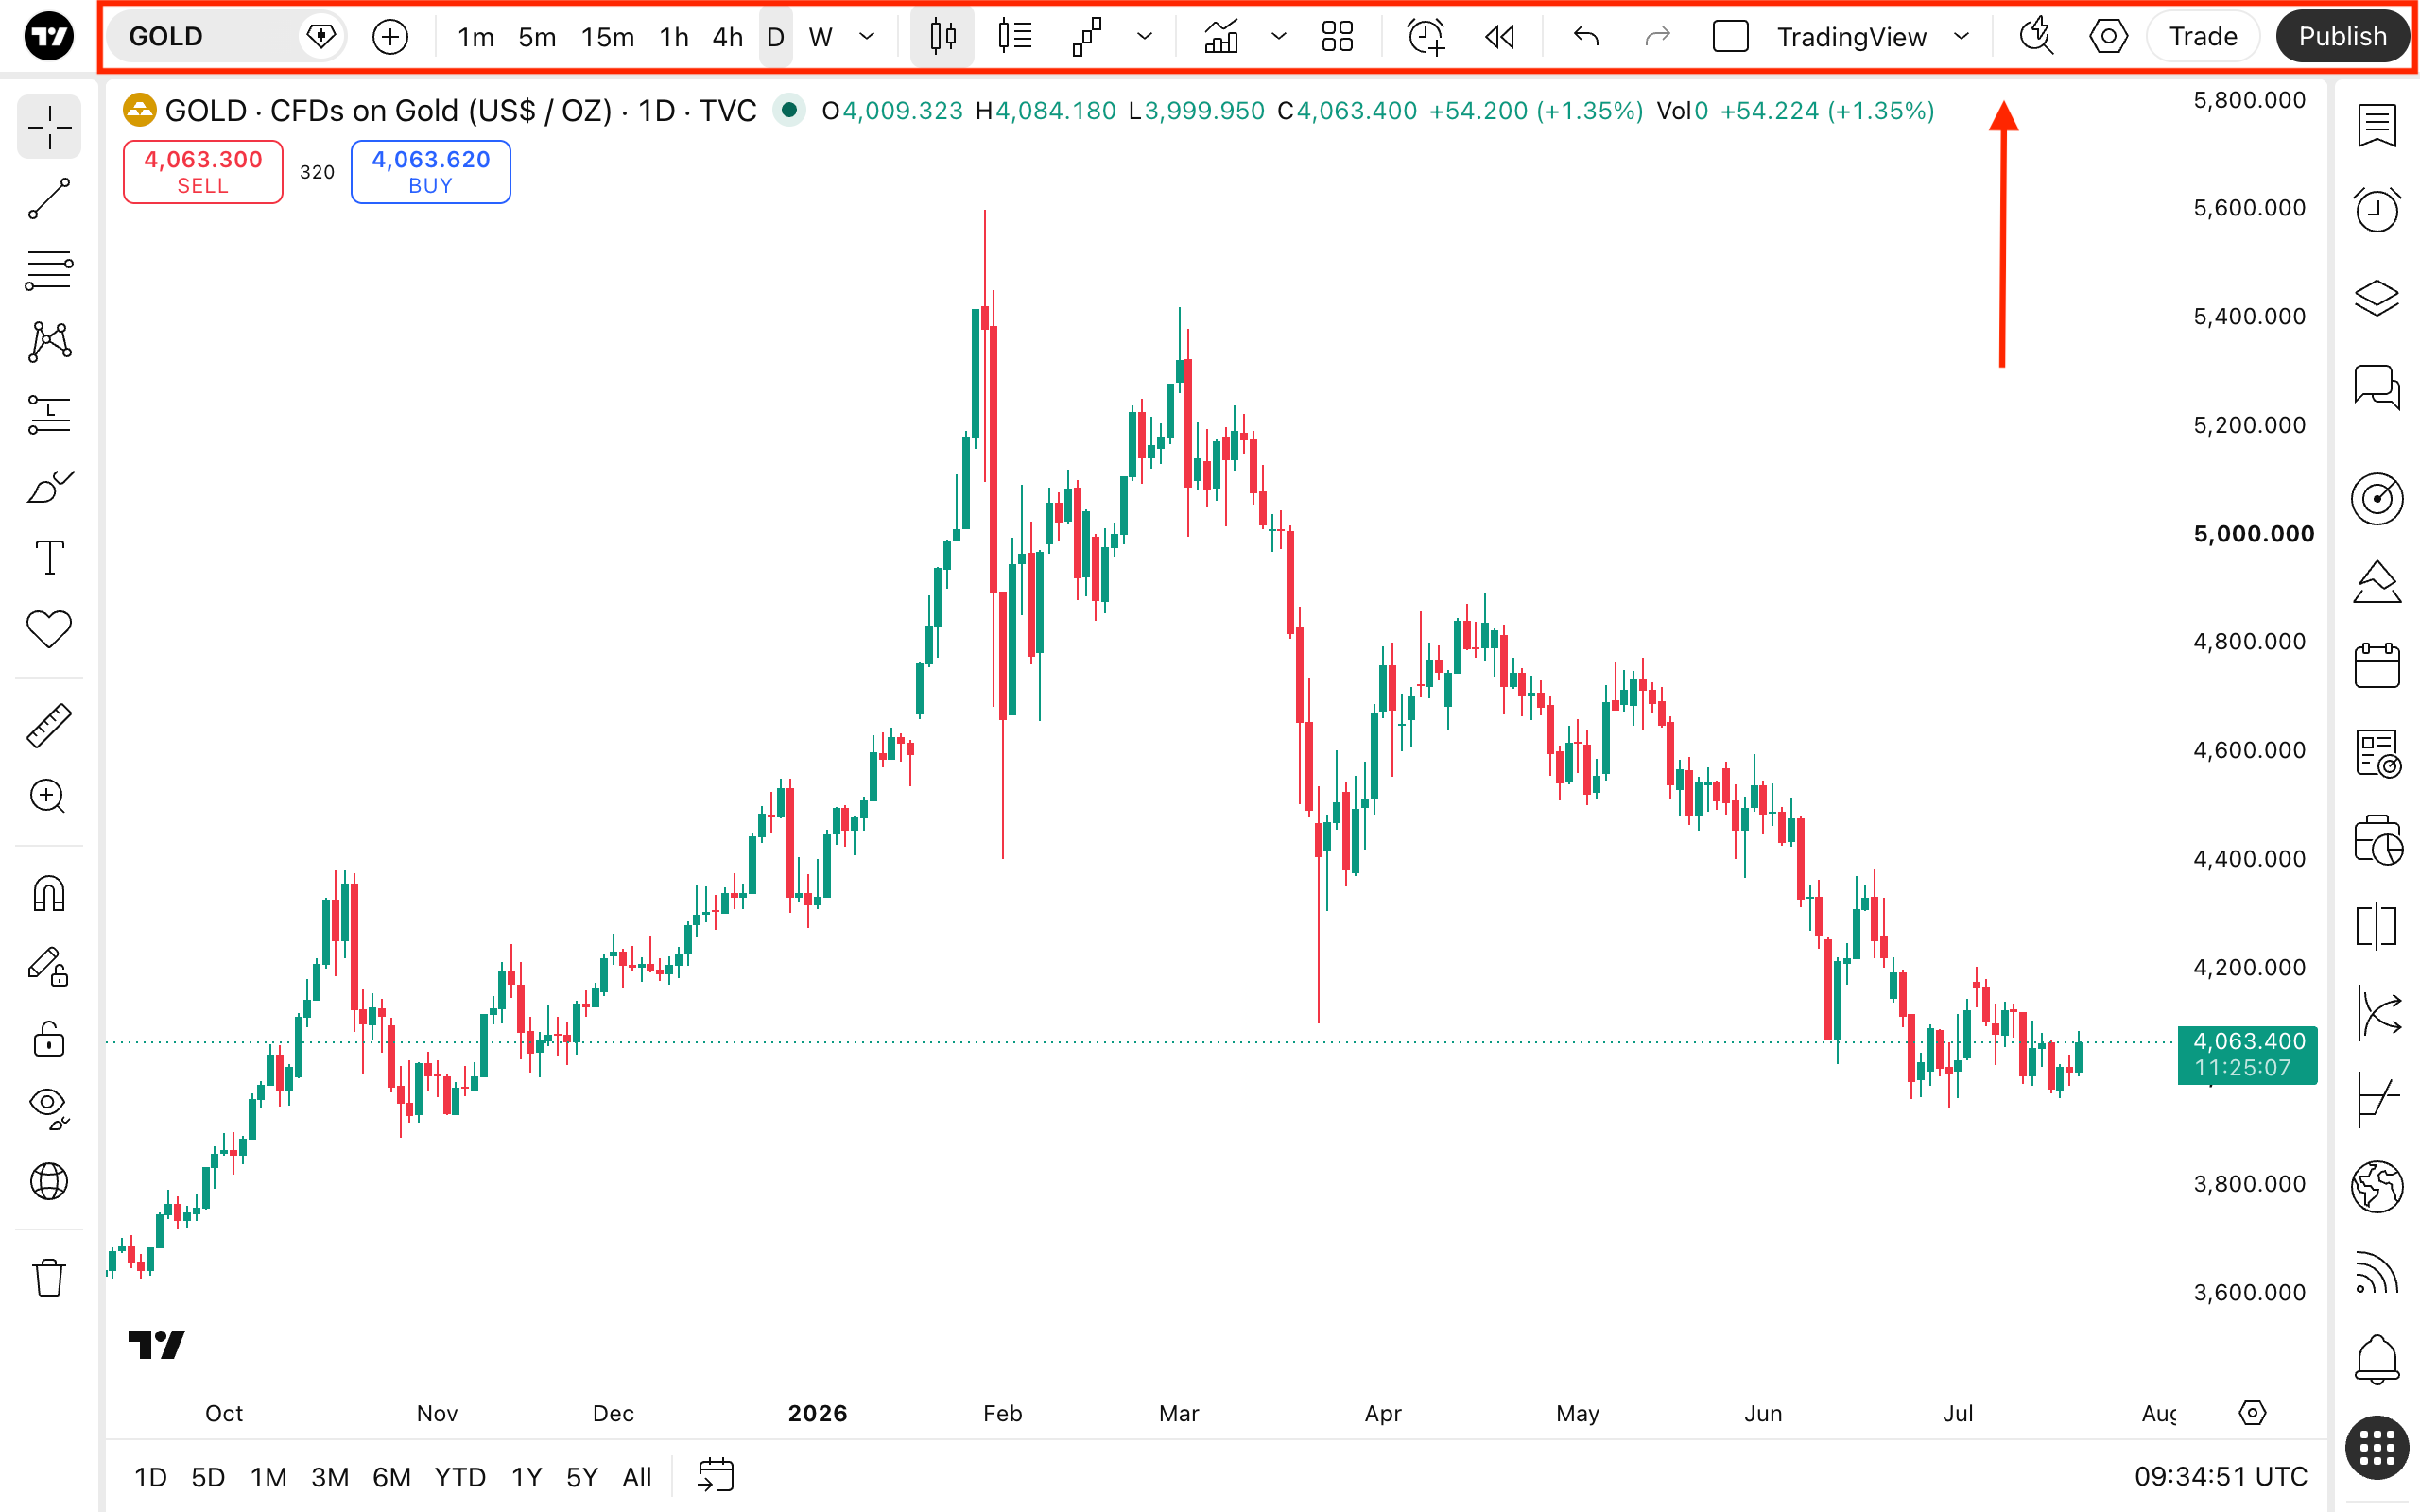
Here, you can choose symbols, chart intervals and types, indicators, layouts, and access other tools.
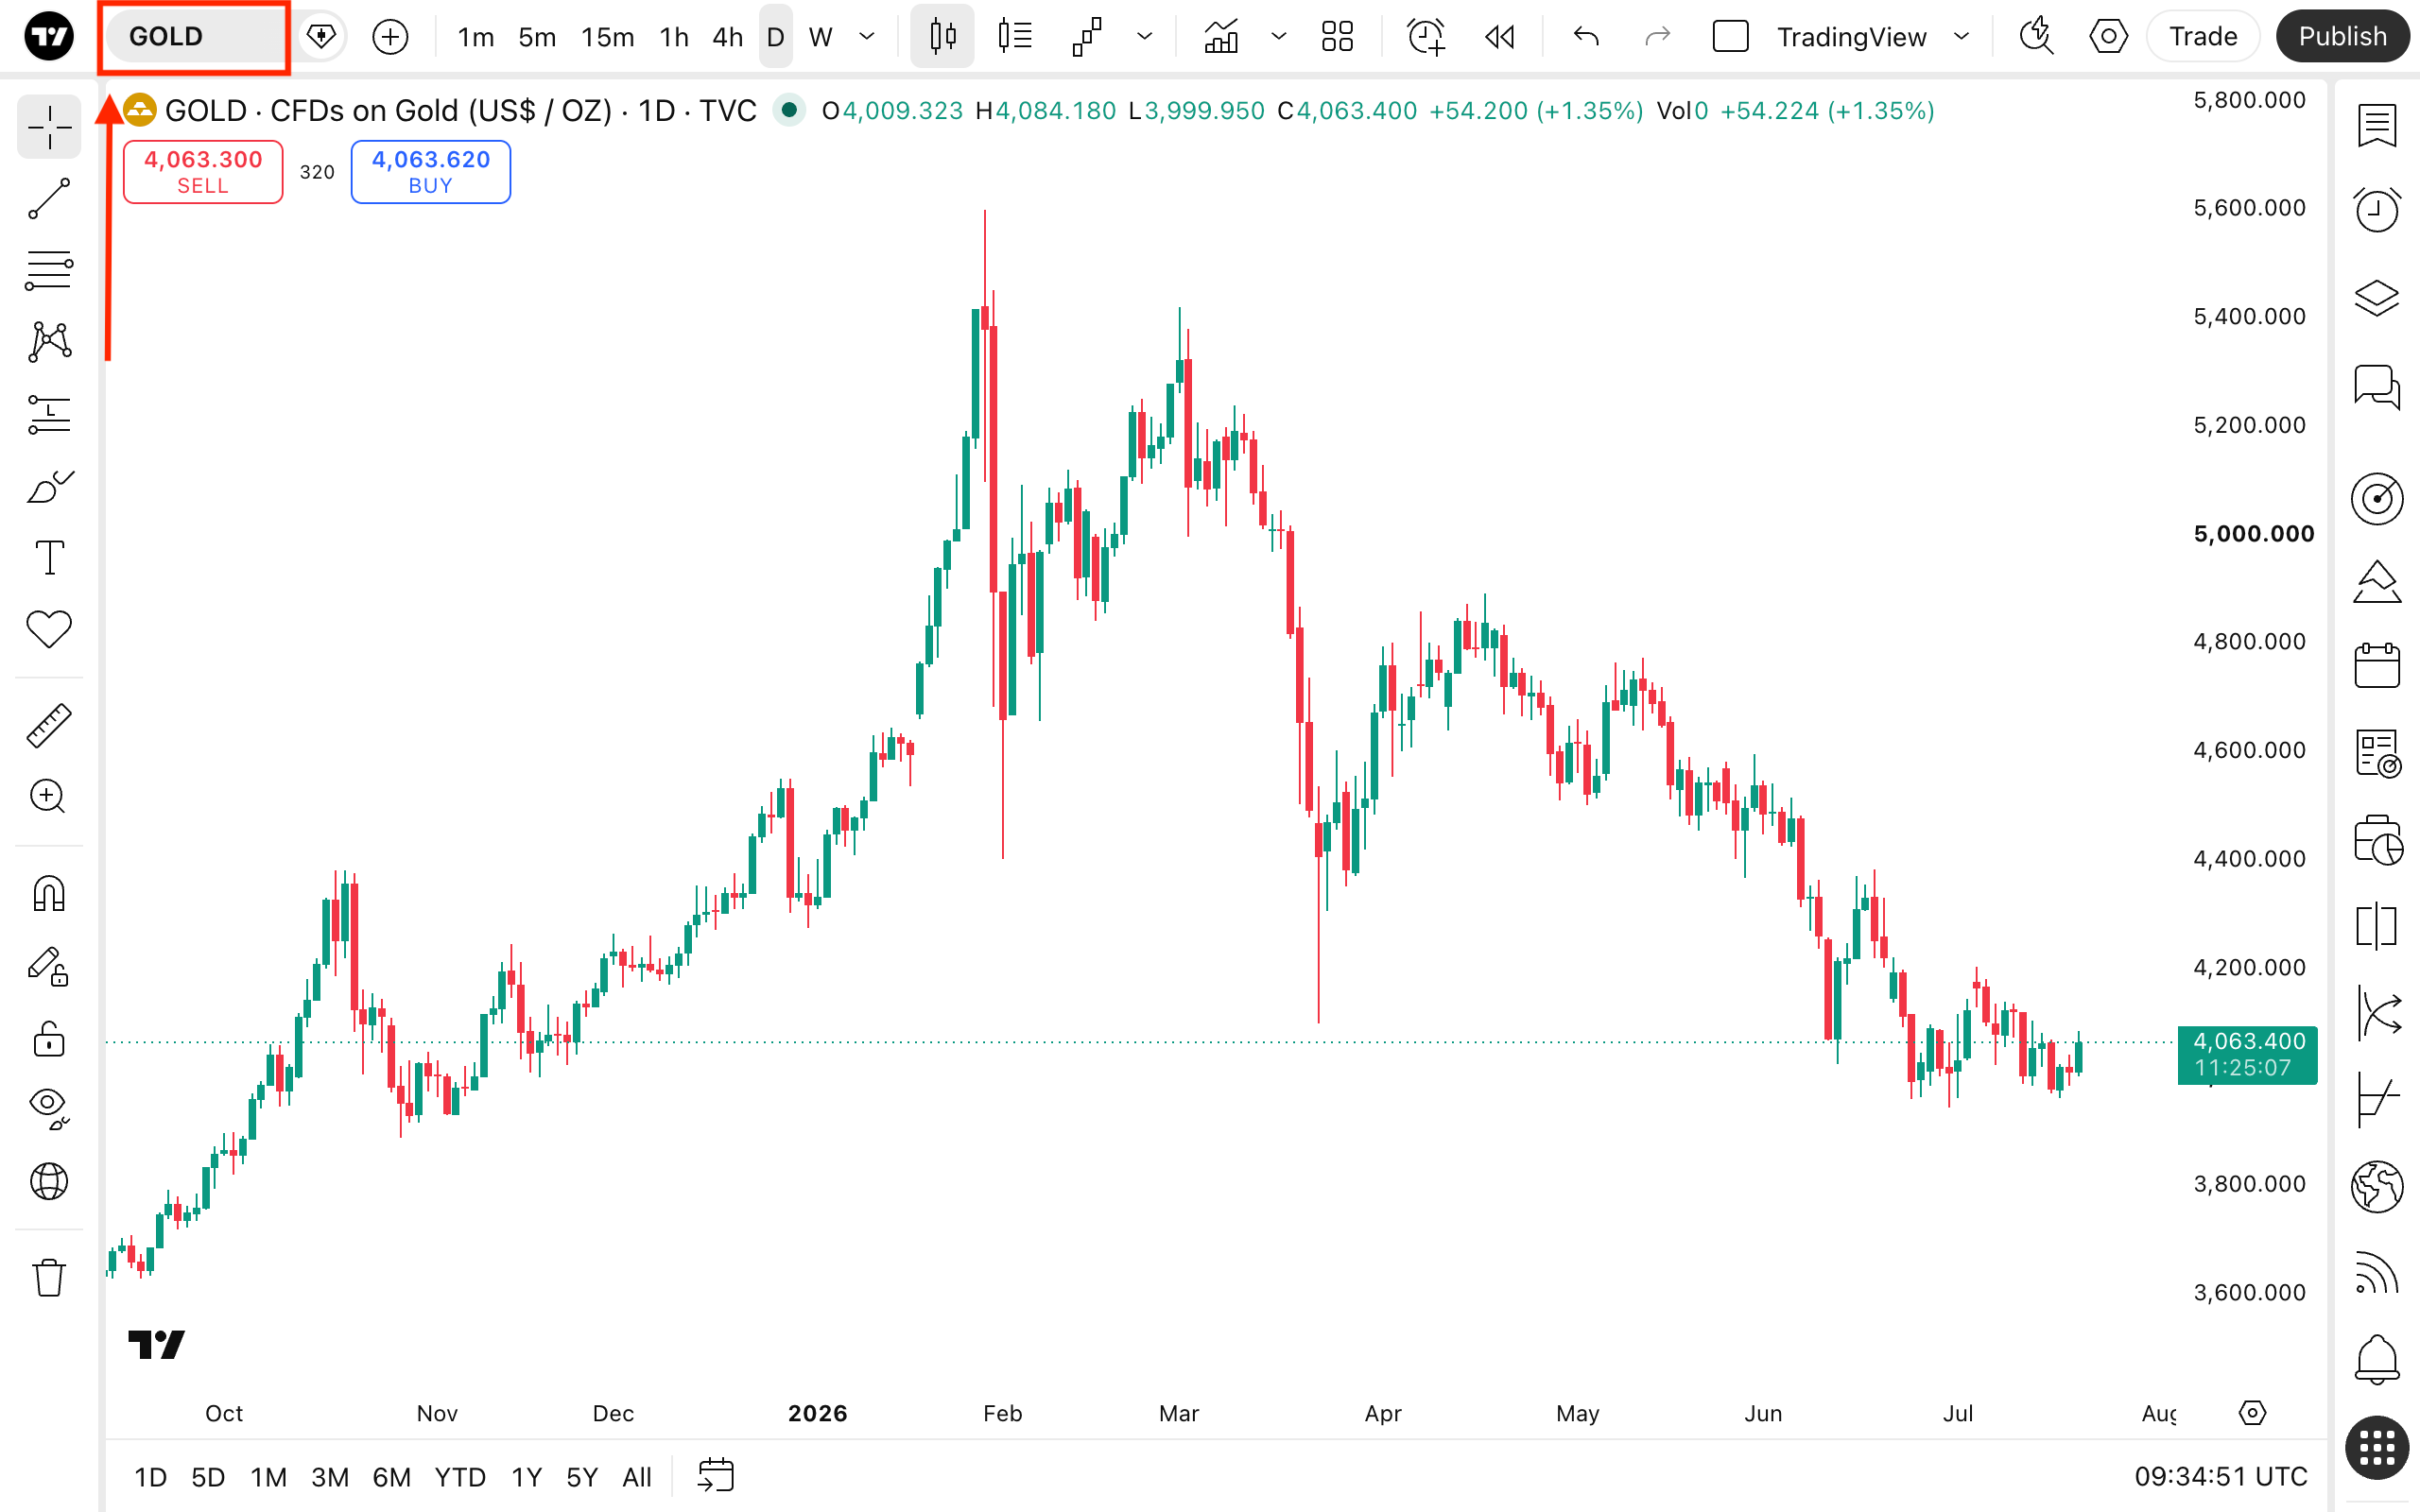
Symbol search
With symbol search you can select symbols to display on the chart. There are two ways to open it:
- Click the symbol name
- Start typing the symbol. For example, to open Apple's stock chart, just type "AAPL"
Data type switcher
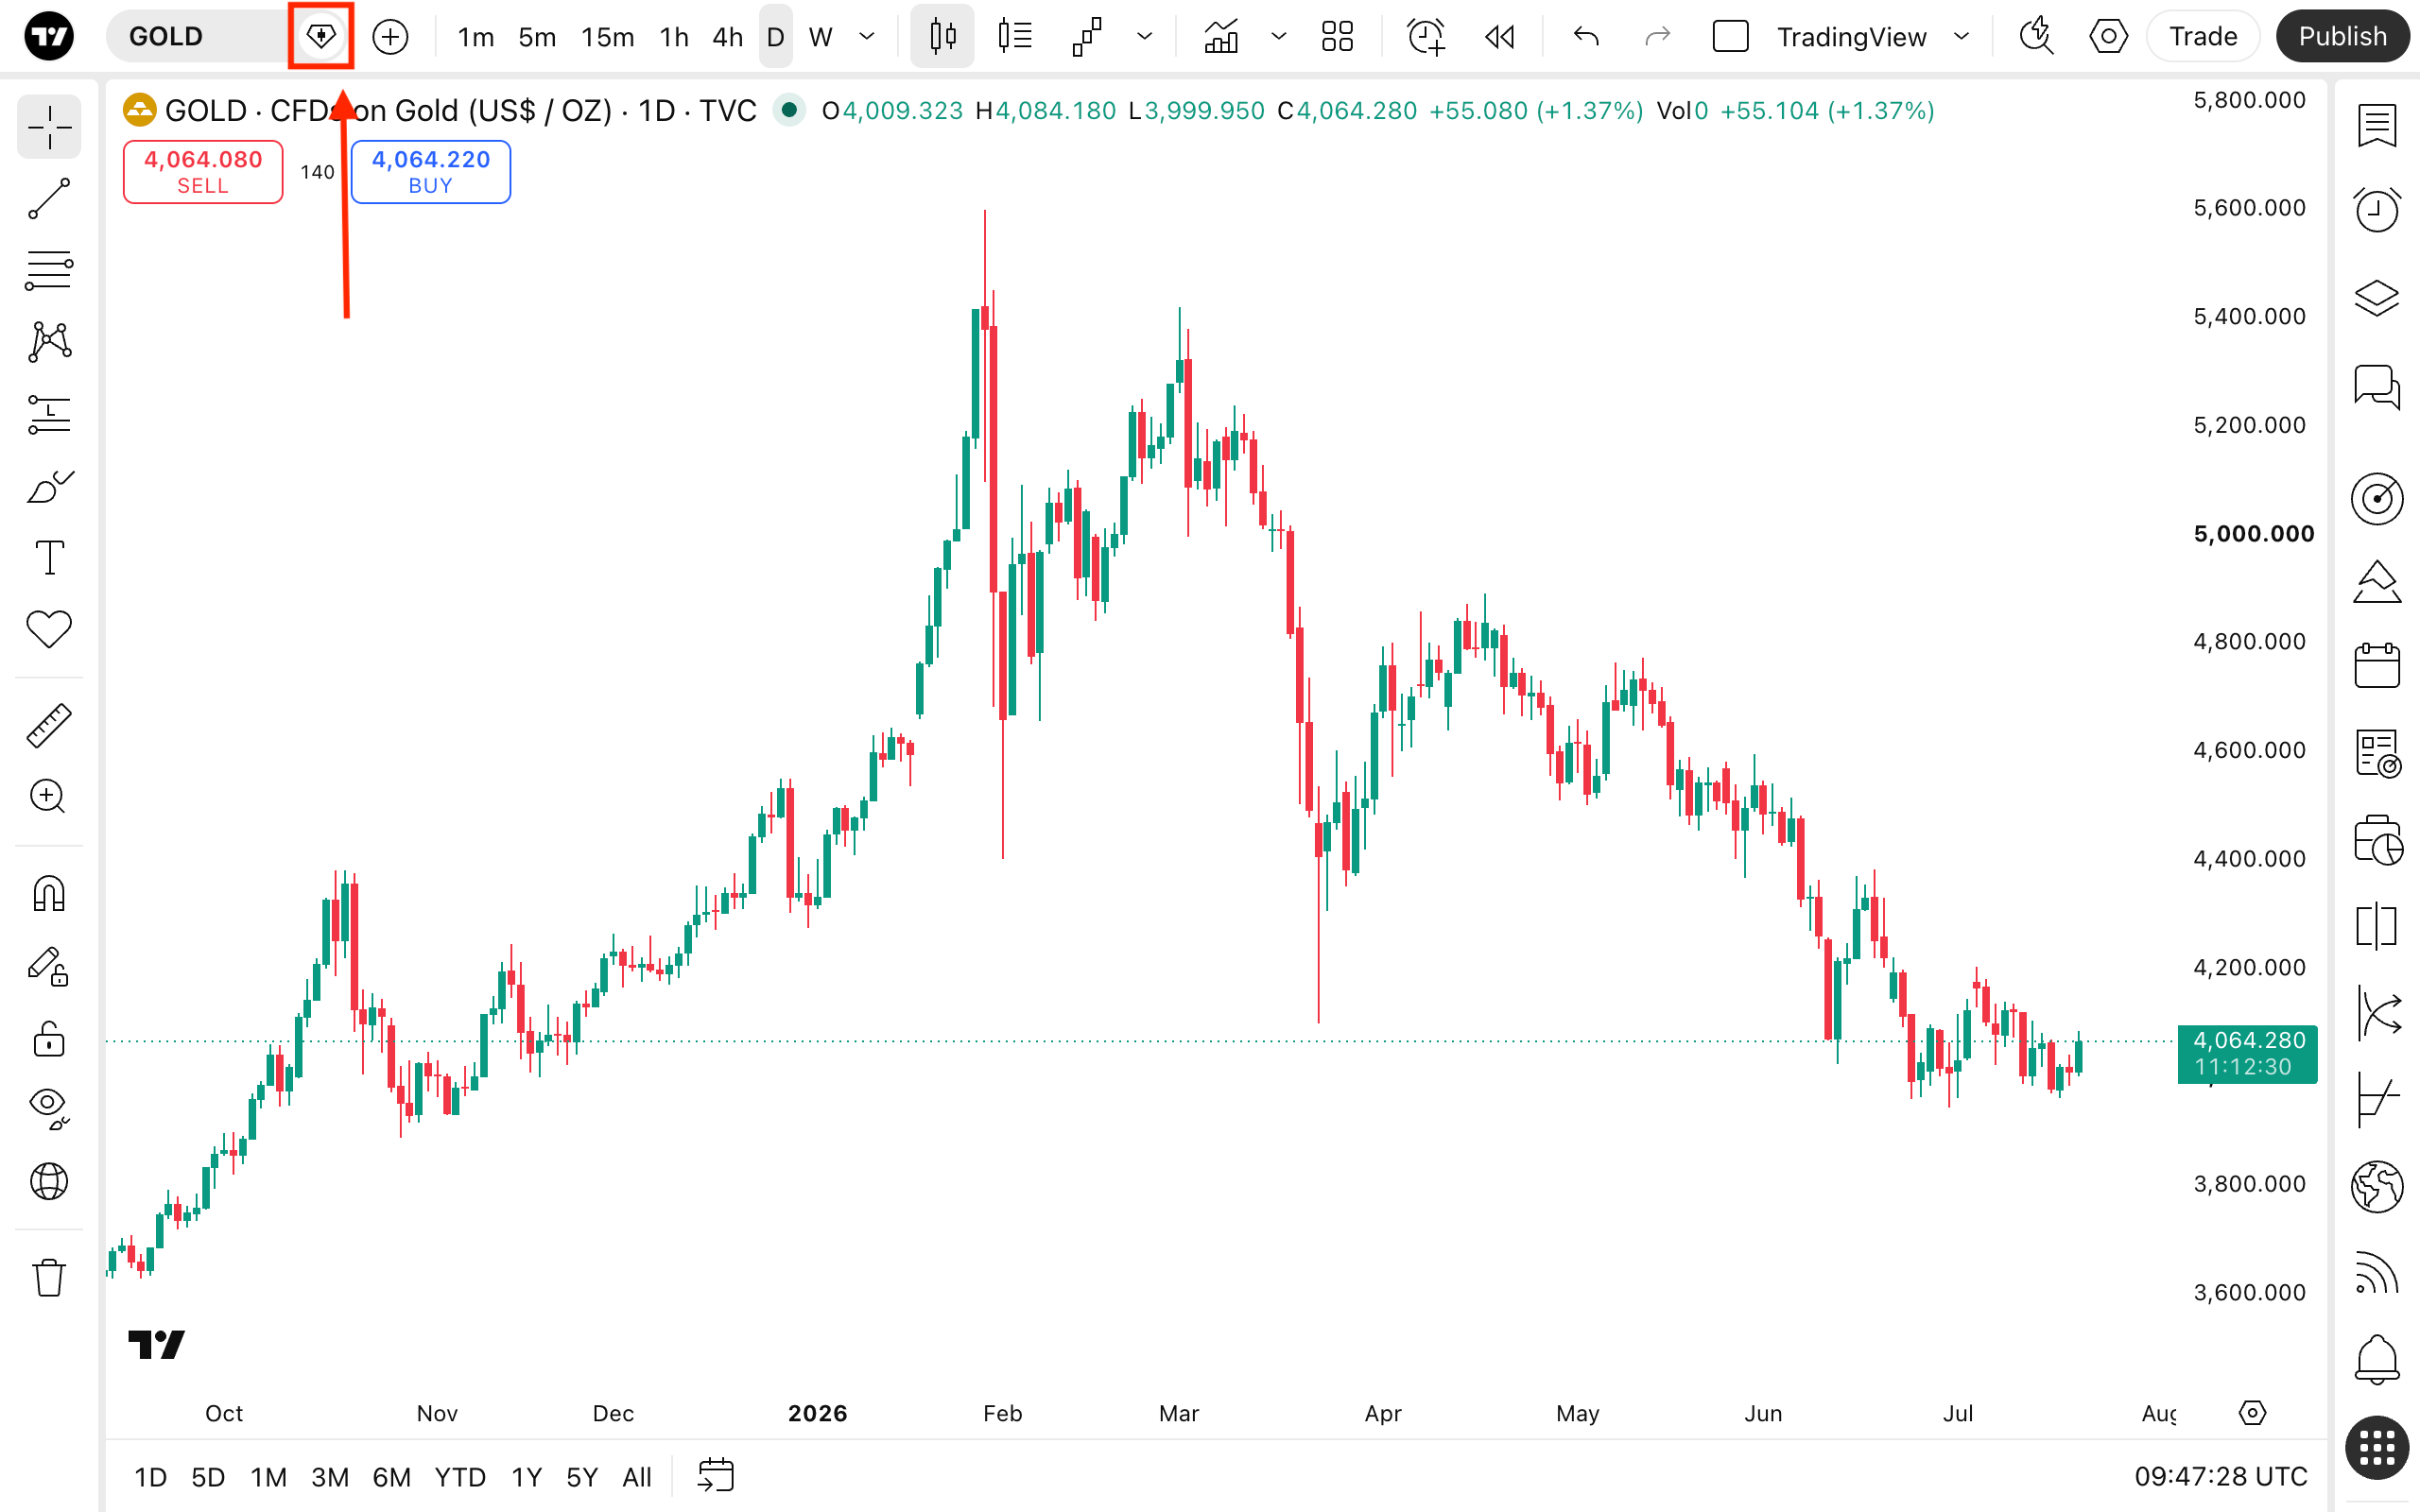
Next to symbol search you can access:
- Technical indicators rating
- Seasonals
- News
- Trading ideas published by other users
Compare symbols
This button allows you to choose an additional symbol to display on the chart together with the current symbol. The feature helps you compare assets on one chart for a more comprehensive analysis.
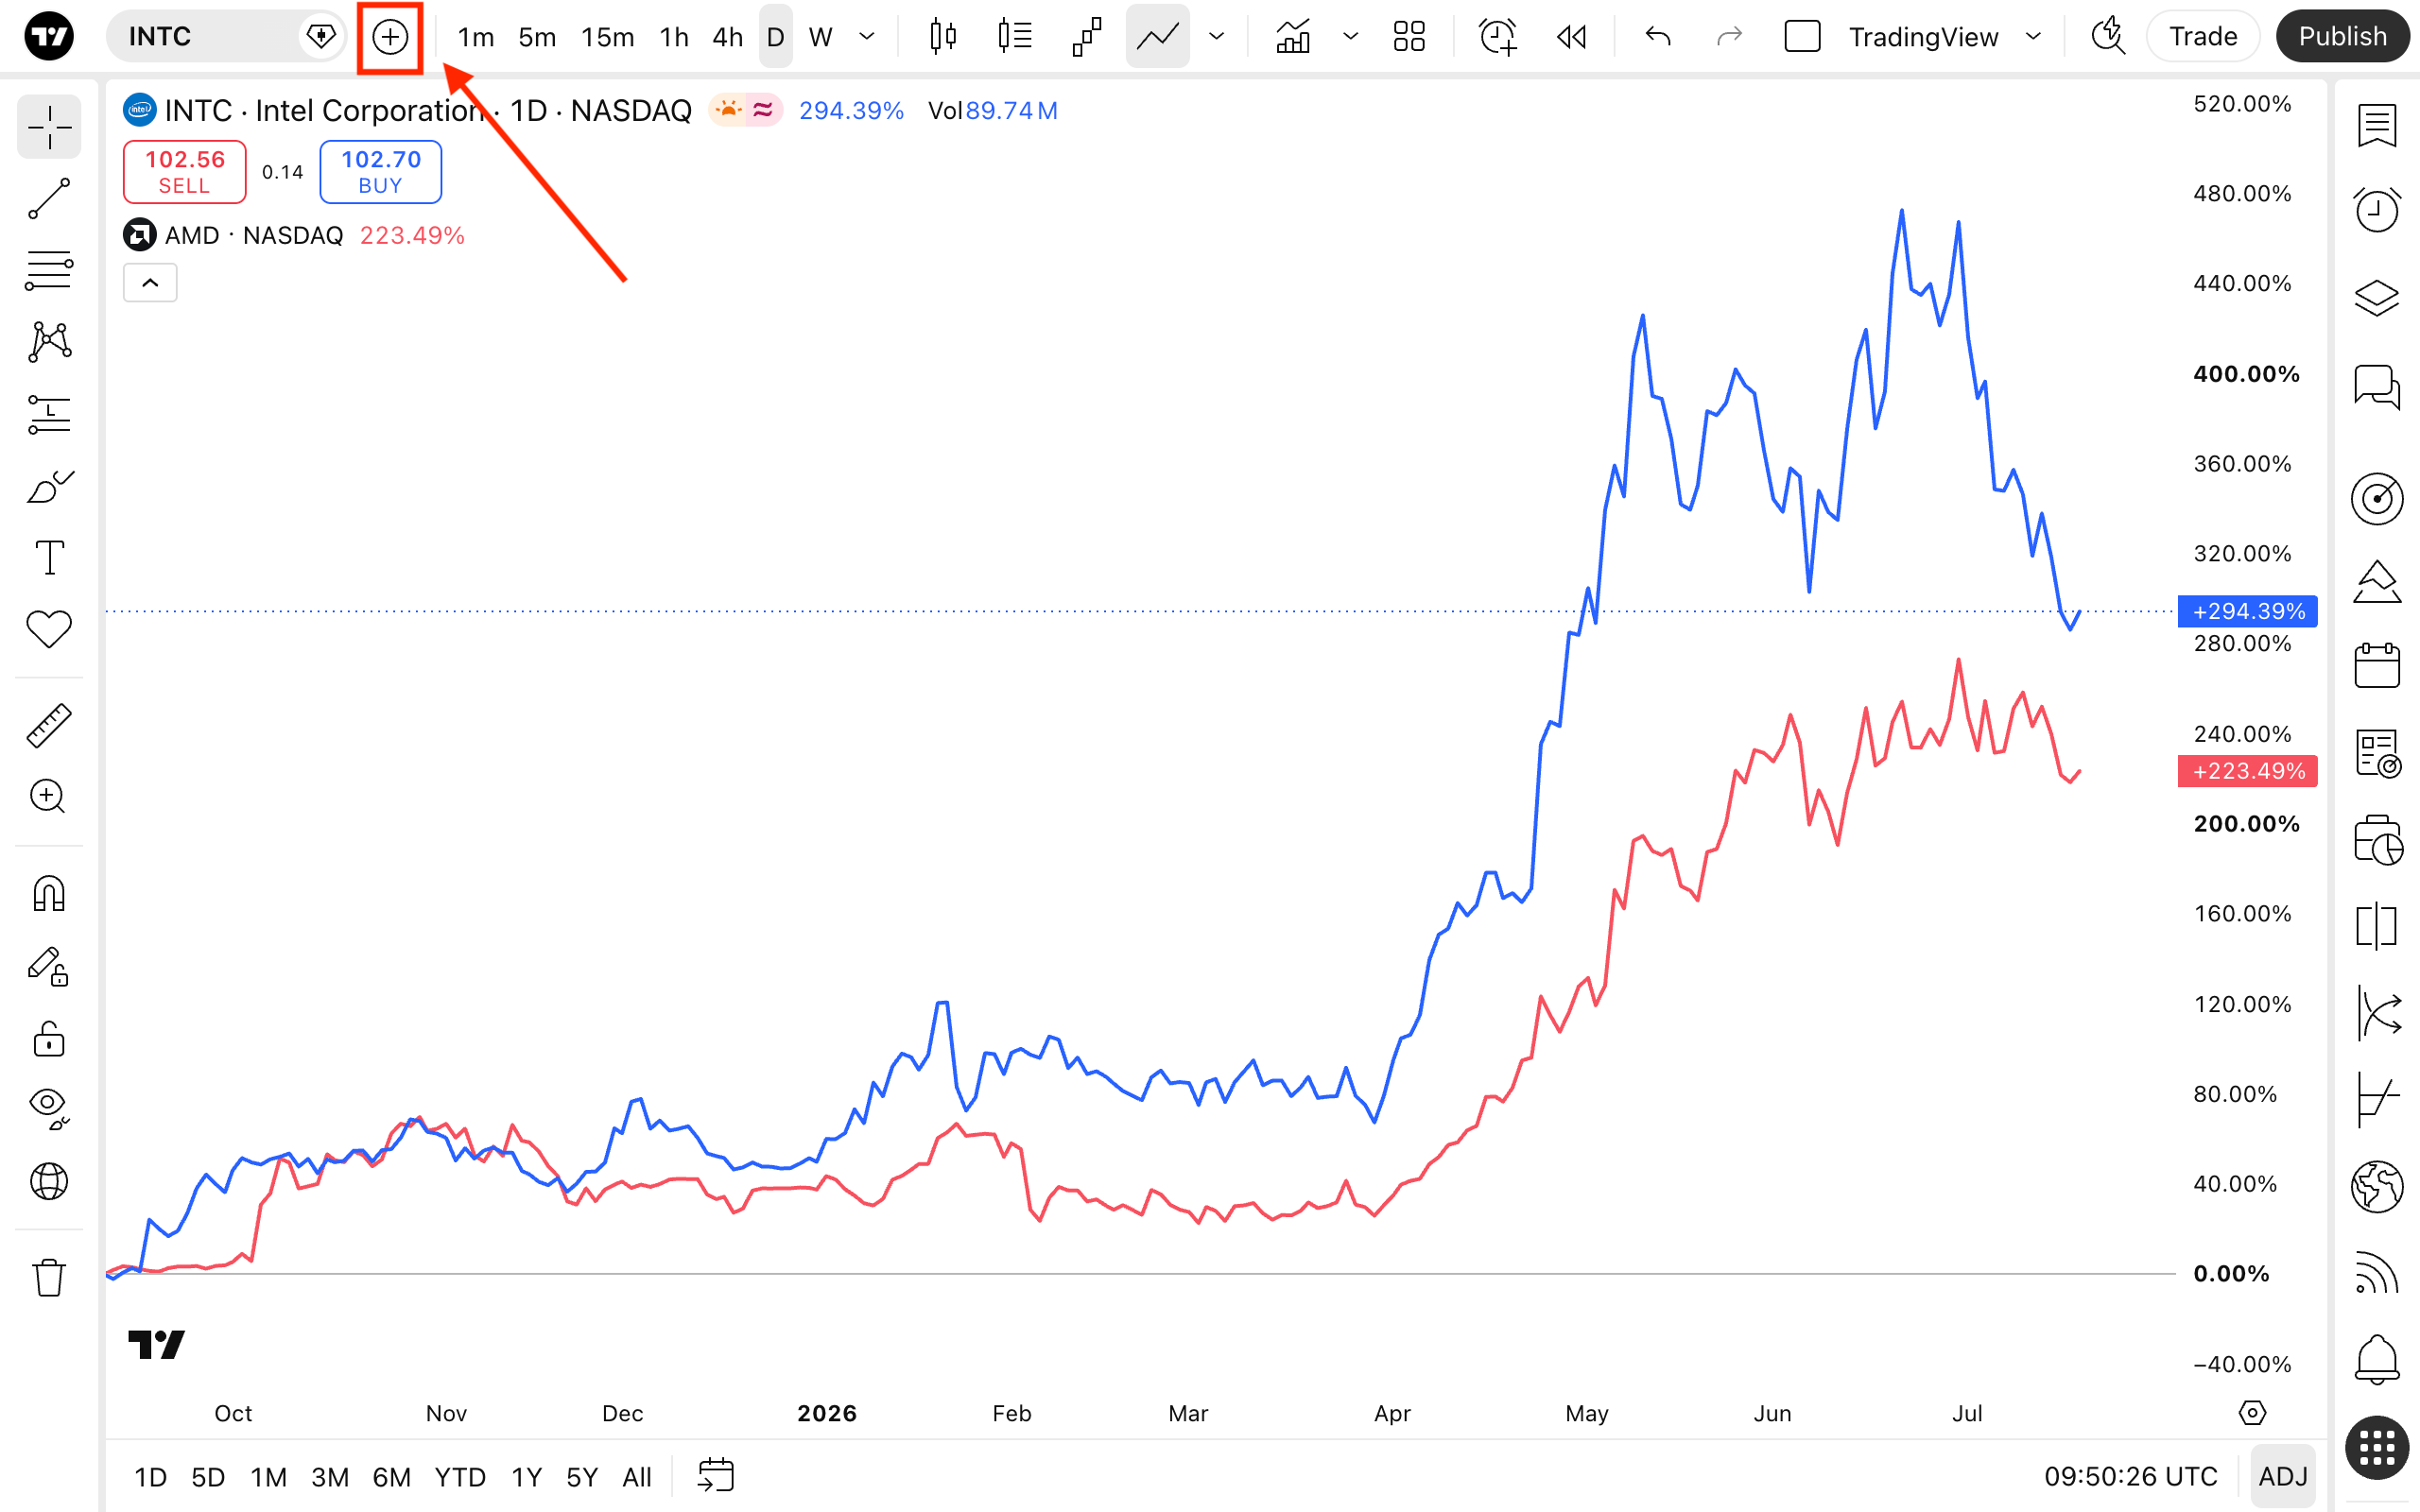
Chart interval
Each chart interval represents a "step" in time for the price — it can be from one second to months. Each chart type, with its unique visualization approach, determines how time intervals will be plotted as bars, candlesticks, and other visual elements.
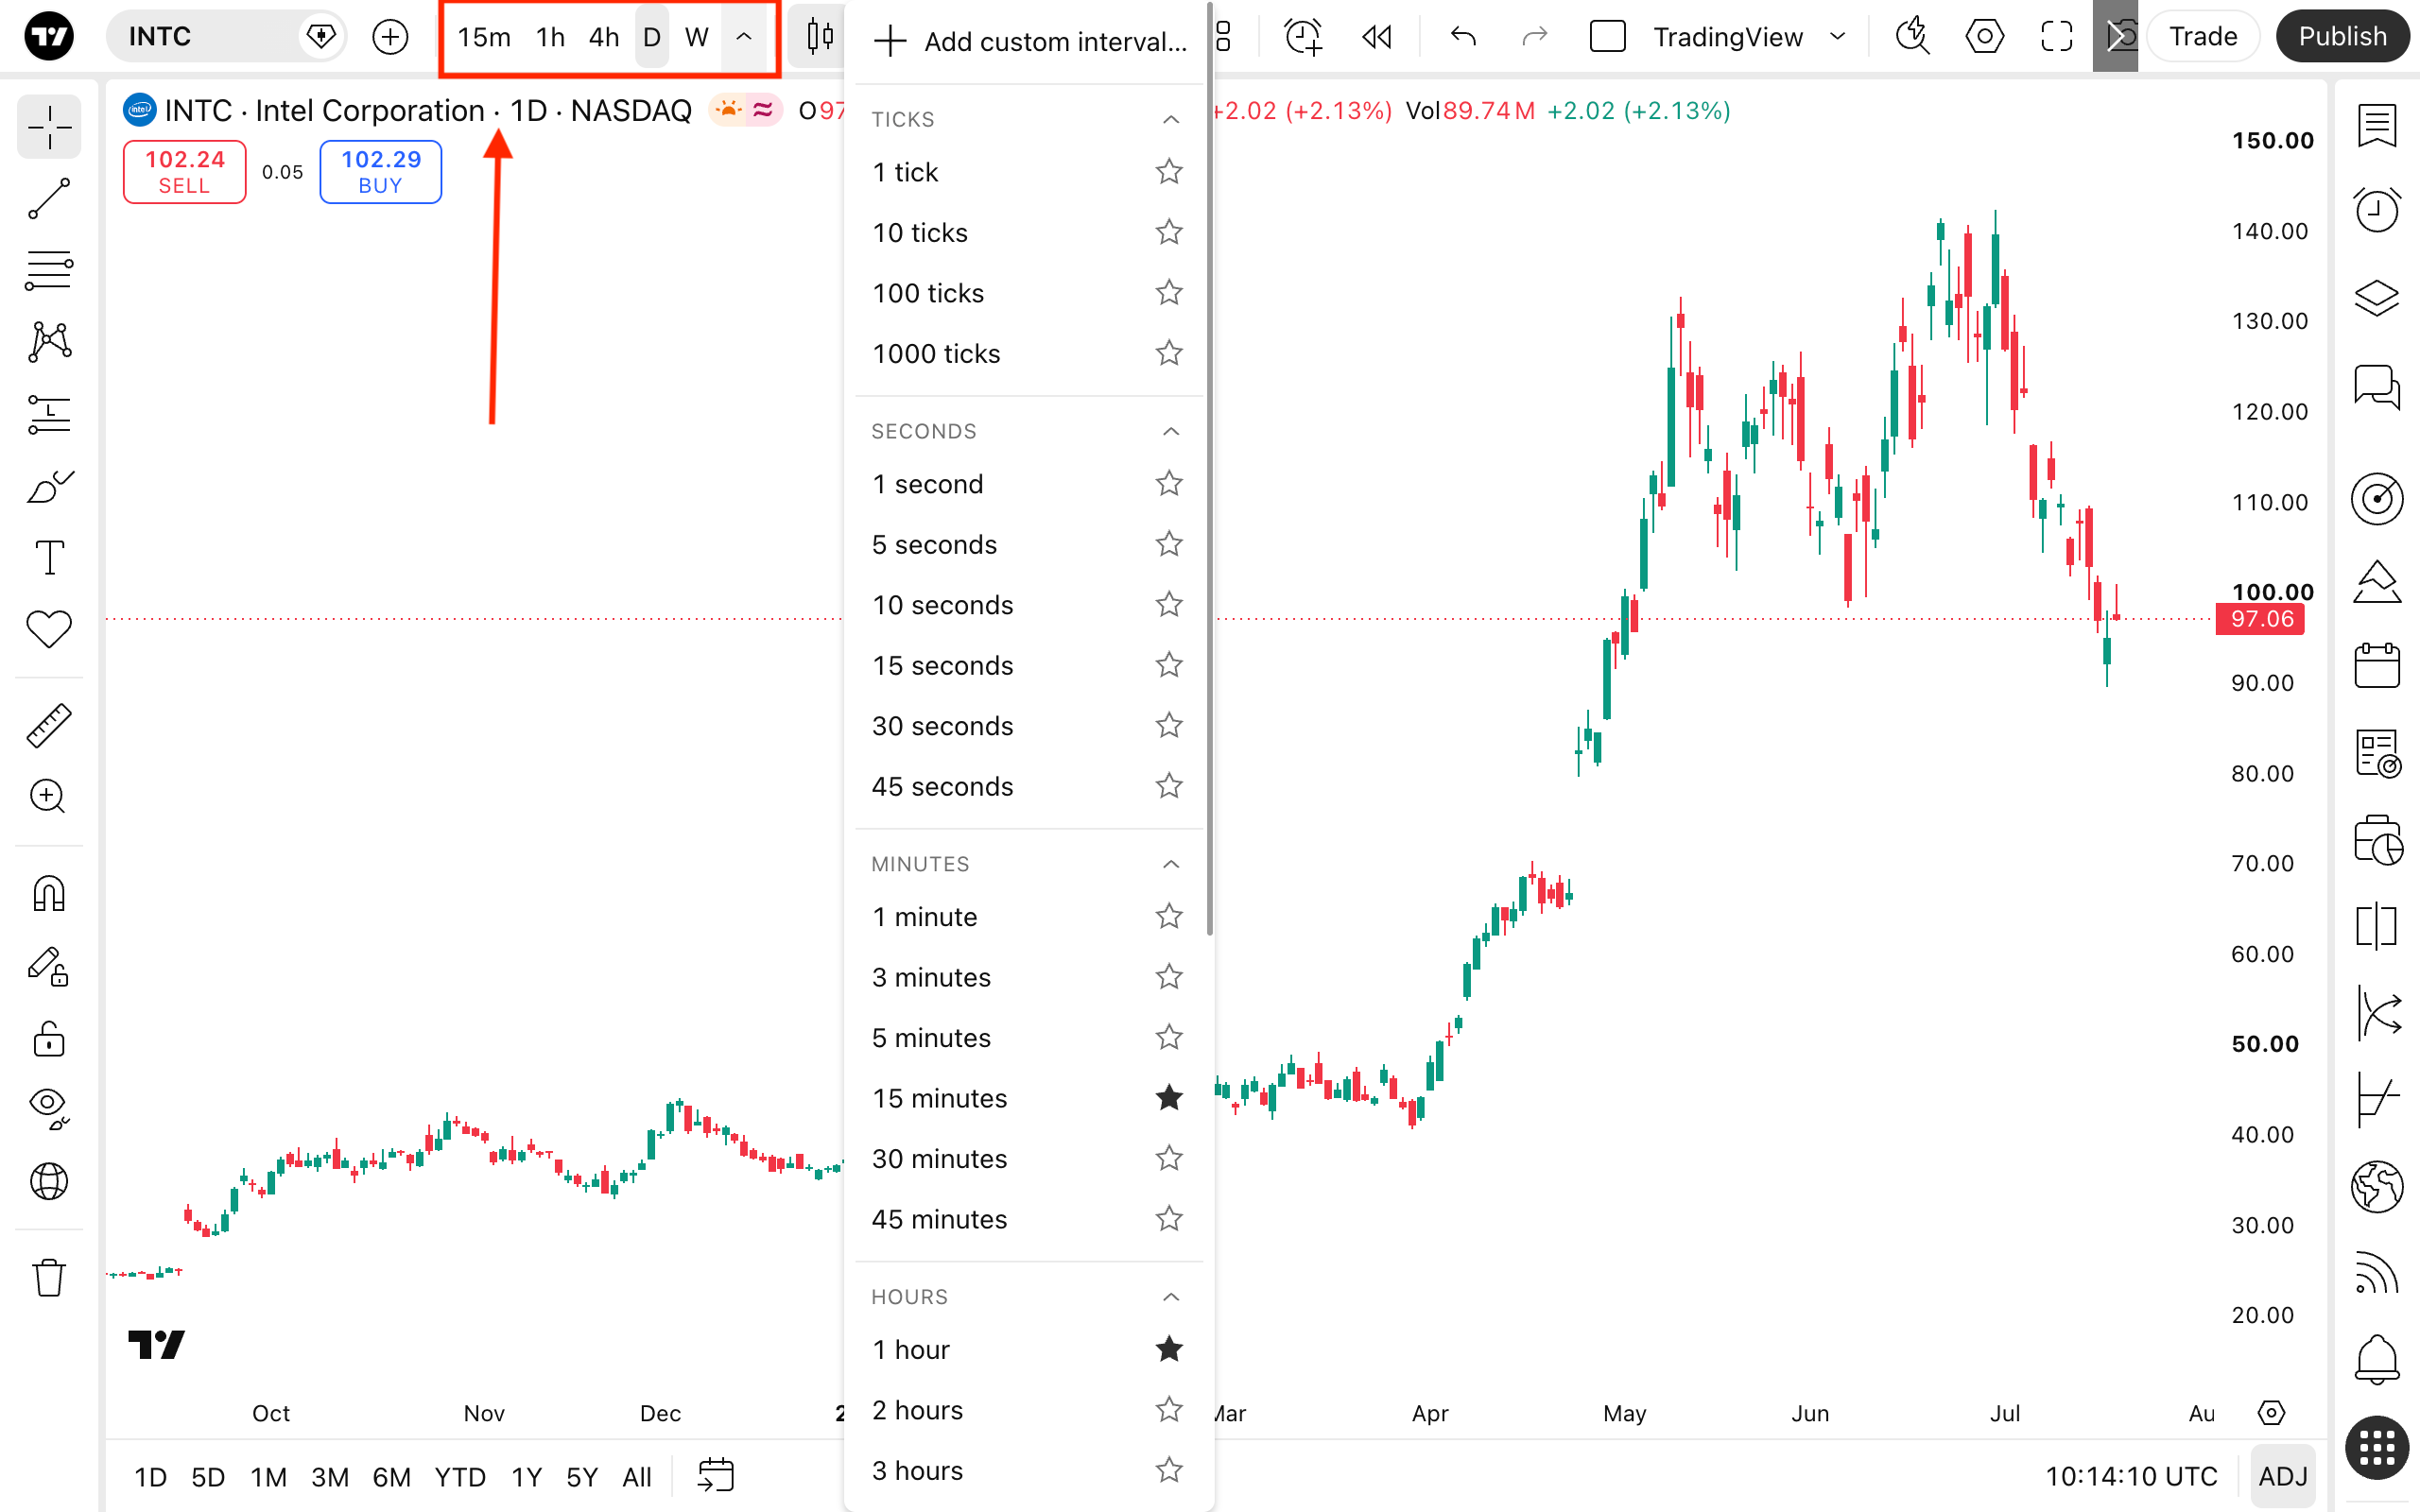
For example, if you use a line chart, the line is constructed by connecting the prices within the selected interval. With bar or candlestick charts, each bar or candlestick will represent prices over that particular time period.
Chart type
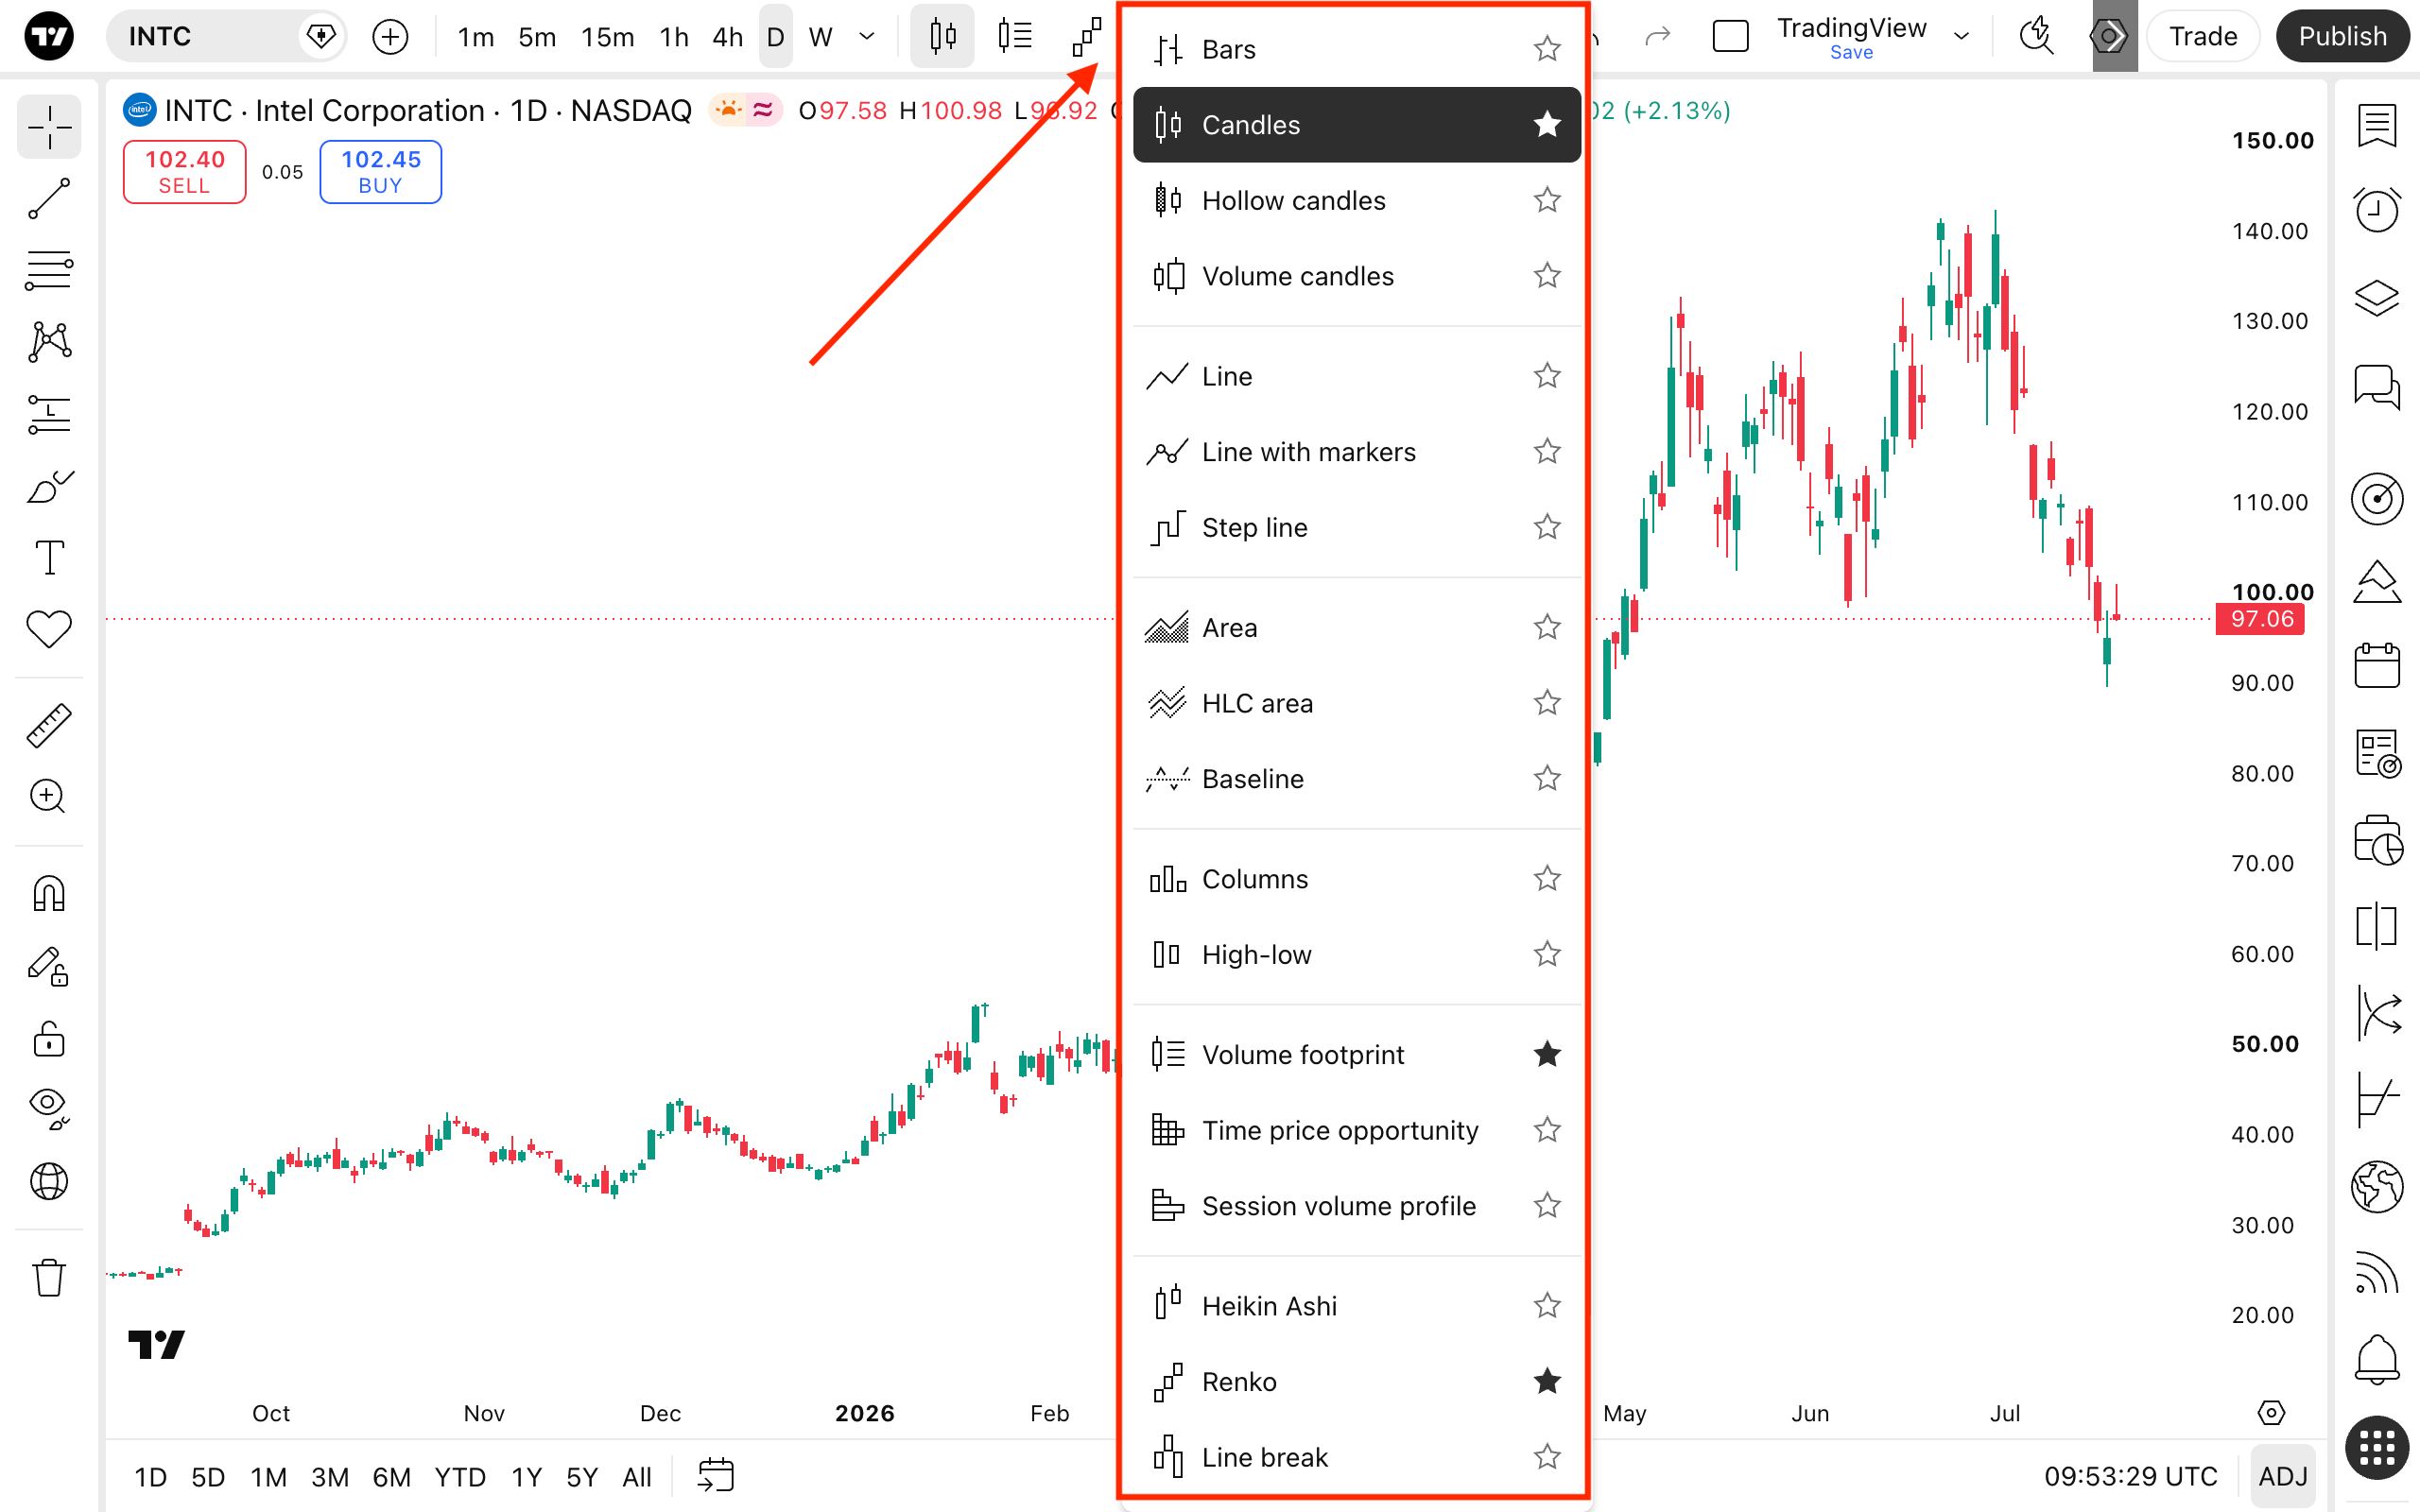
Here, you can choose from 20+ chart types. Each can be tailored to fit your analytical approach. Select from classic bars and candles to more sophisticated options like Renko charts.
For more details, read our article on how to use different chart types.
Indicators, metrics, and strategies
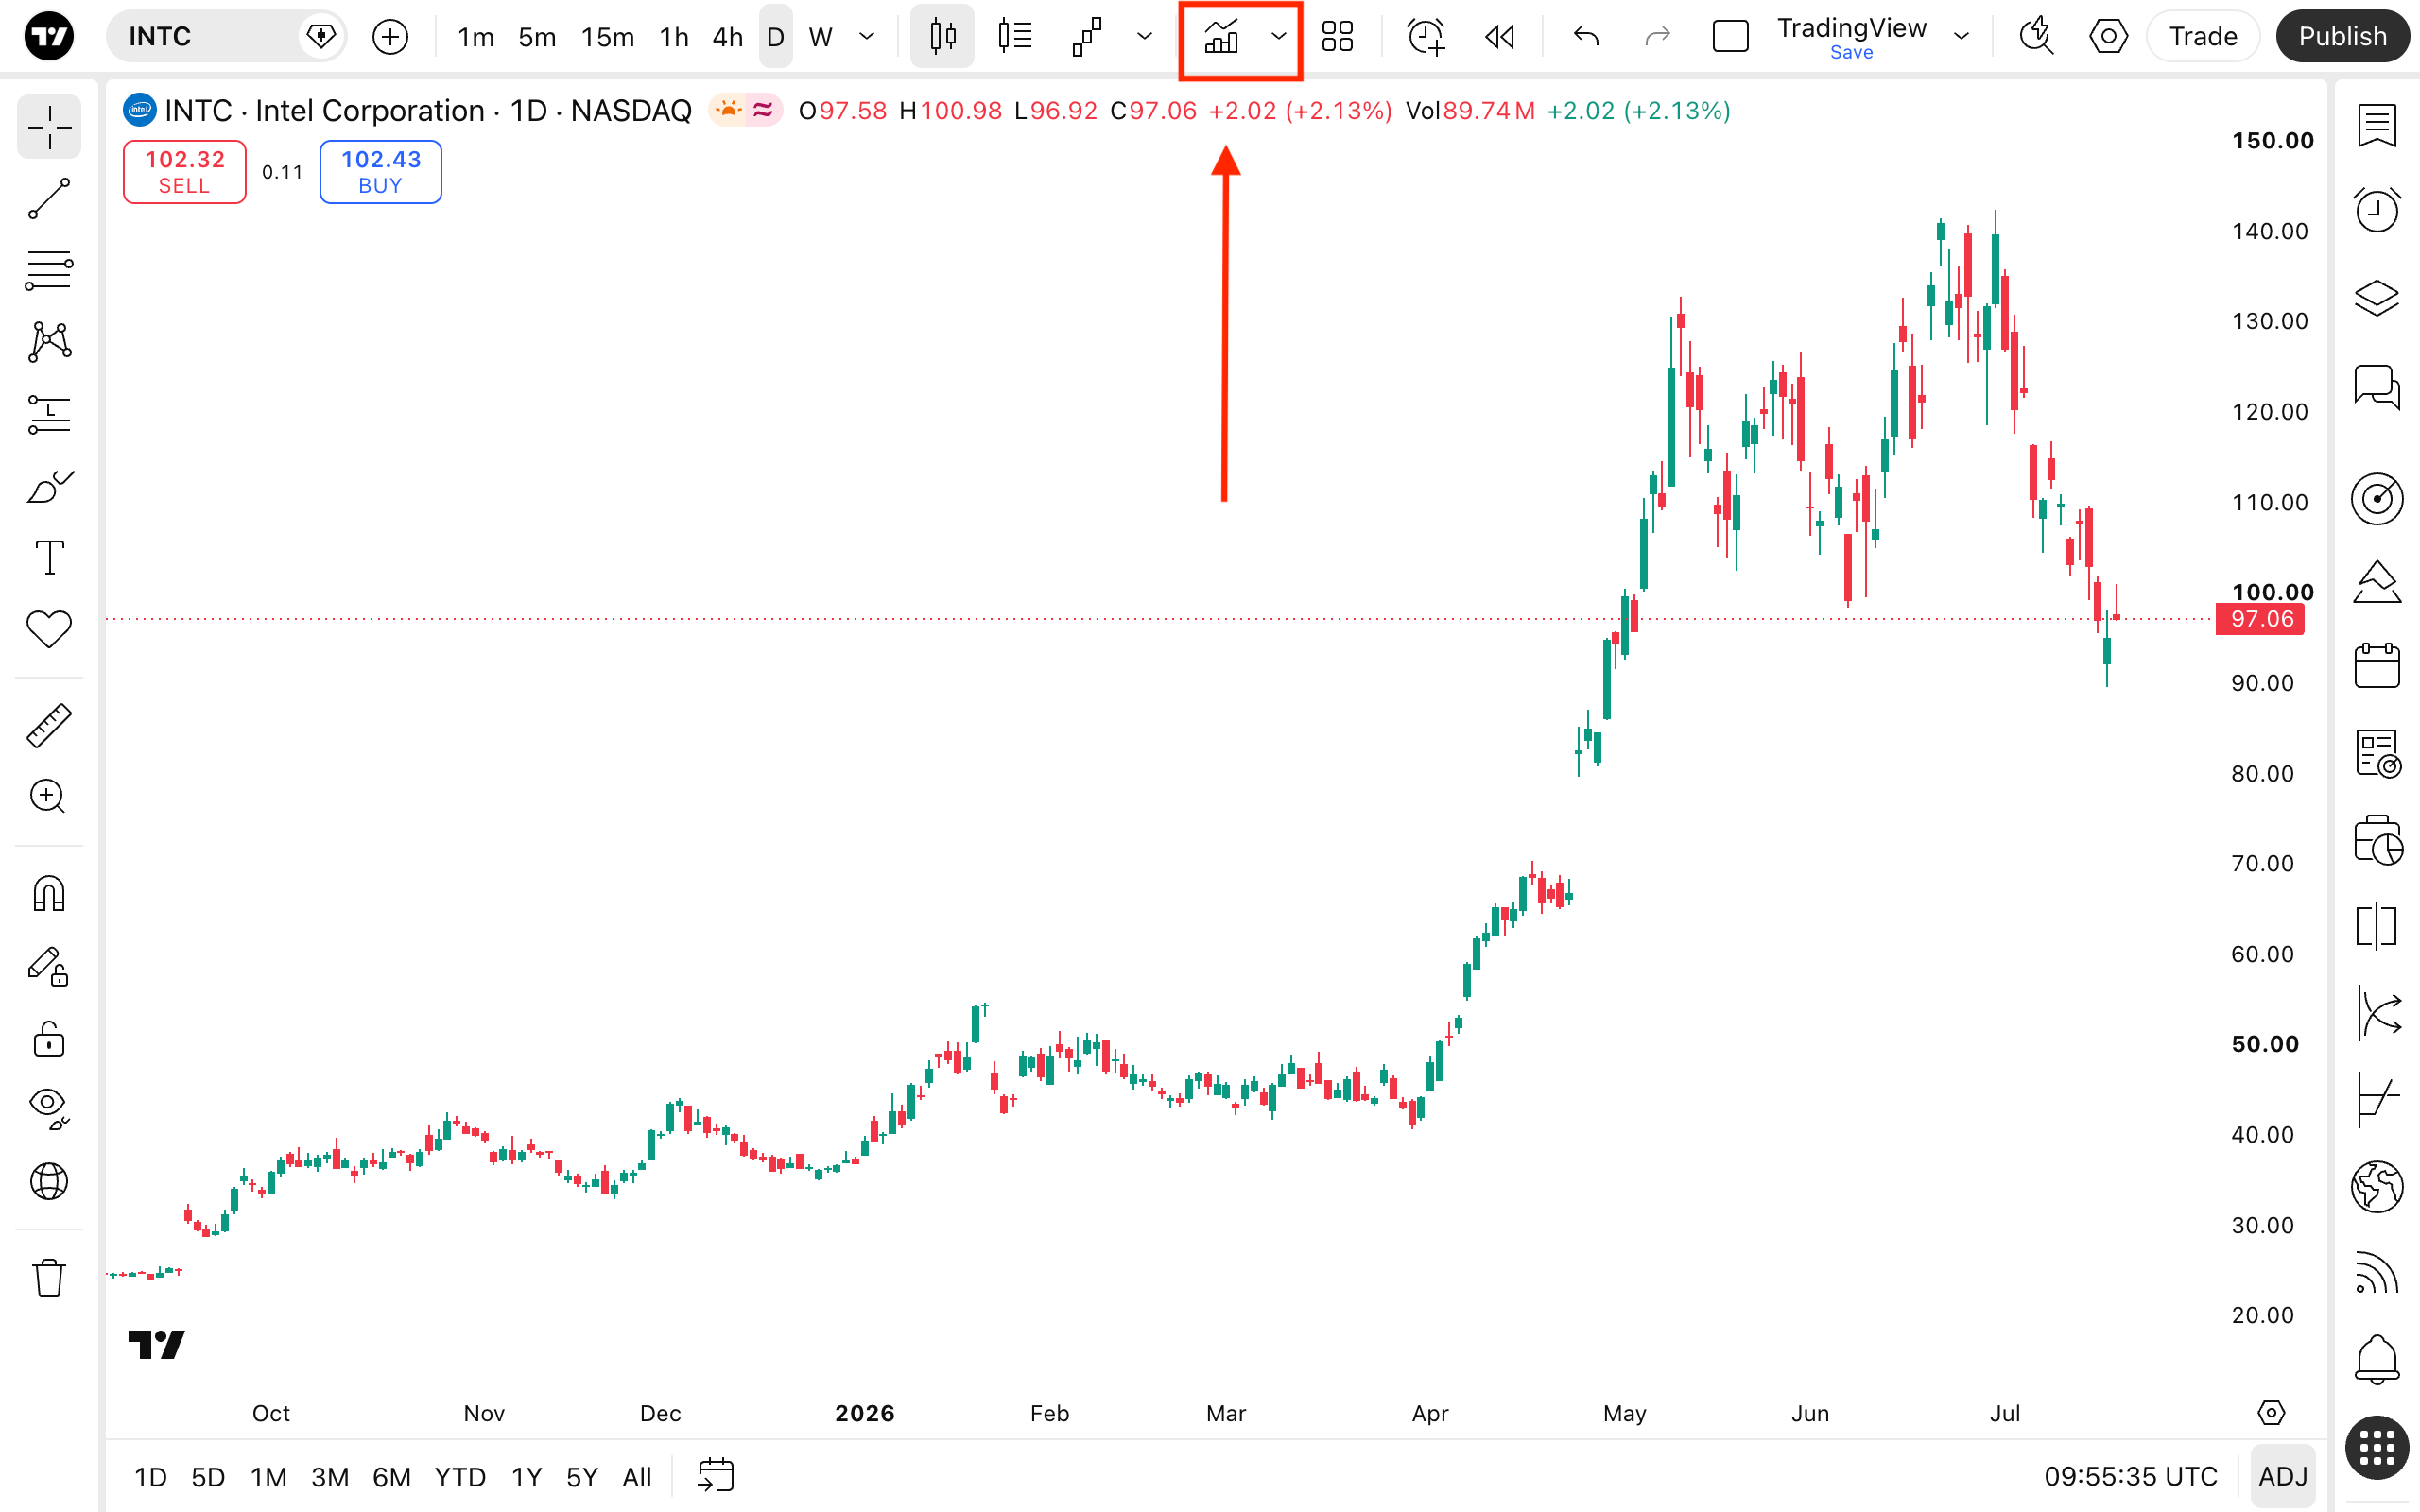
From here, you enhance your trading. These powerful tools provide essential insights to help you navigate the markets.
- Technicals: Functions used in technical analysis to predict future prices based on their movements and assets' trading volume.
- Fundamentals: Financial data for fundamental analysis is derived from a company's performance reports for stocks. For crypto, we use on-chain and exchange data.
- Strategies: Specific scripts written in Pine Script® language. They can send, modify, execute, and cancel buy or sell orders and simulate real trading right on your chart.
- Store: Explore hand-picked, TradingView approved authors from Paid Spaces.
With indicator templates, you can save your chosen indicators for later use. When saving, you can also remember the symbol and interval so you can load them simultaneously.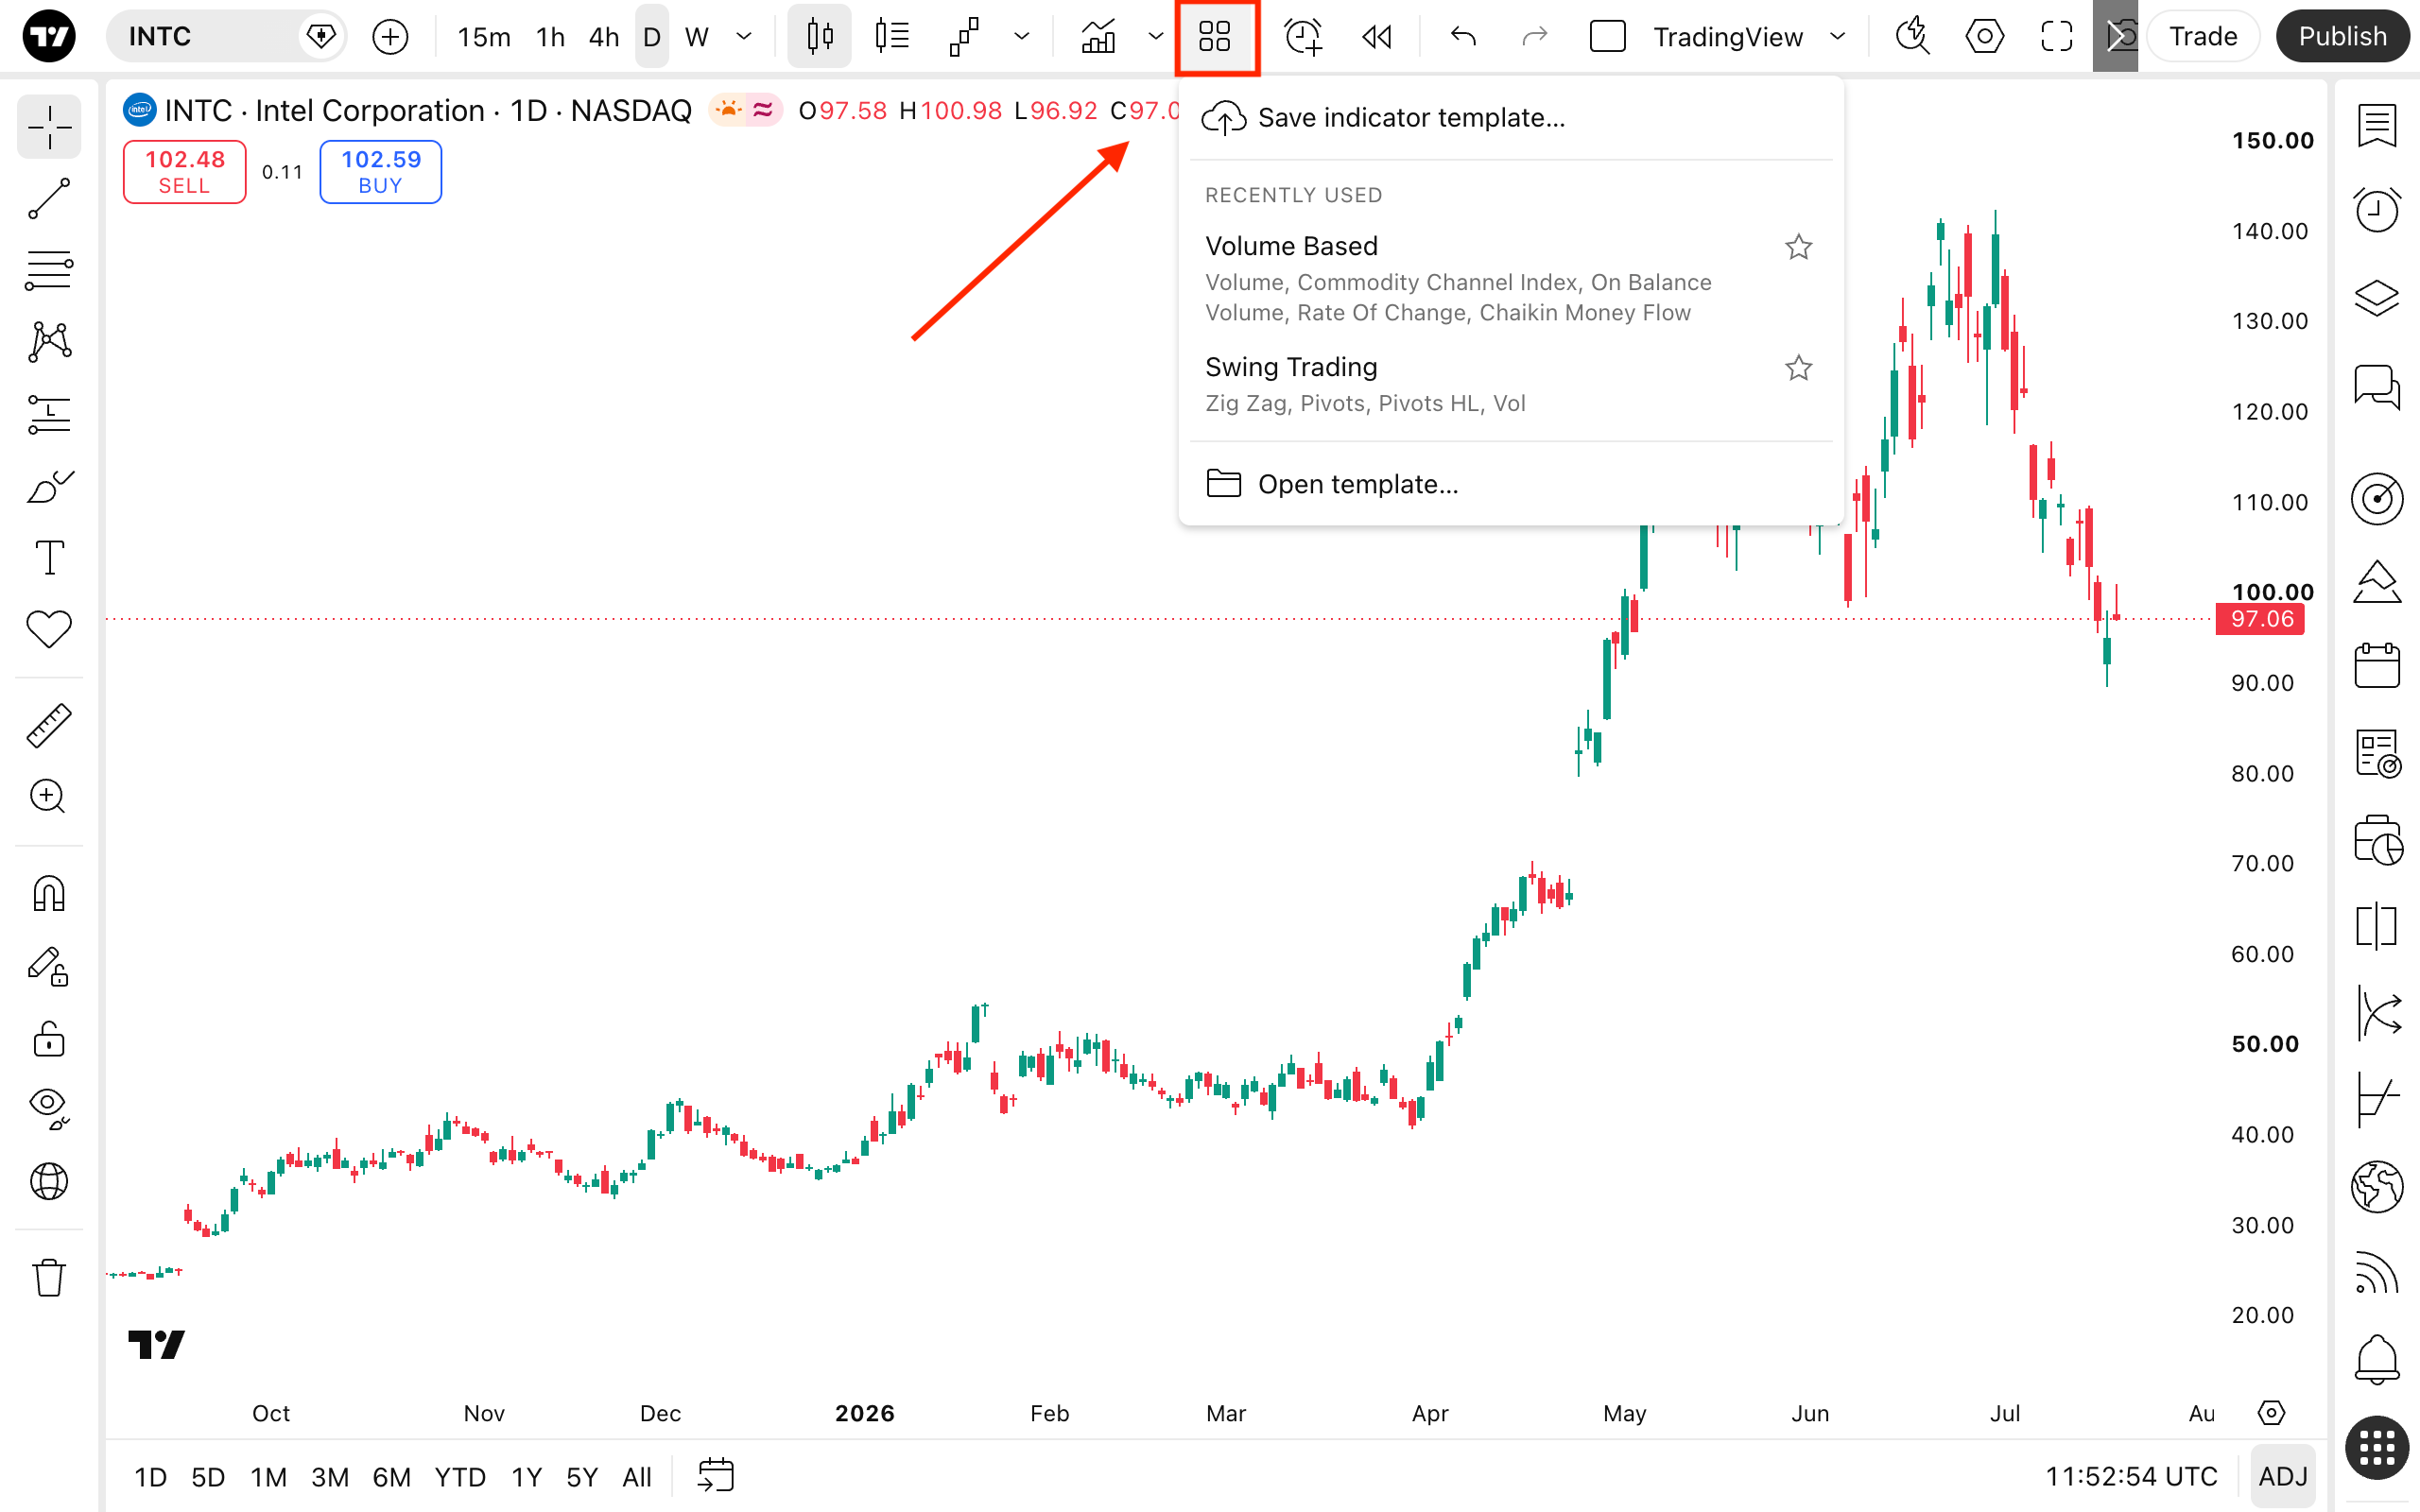 Alerts
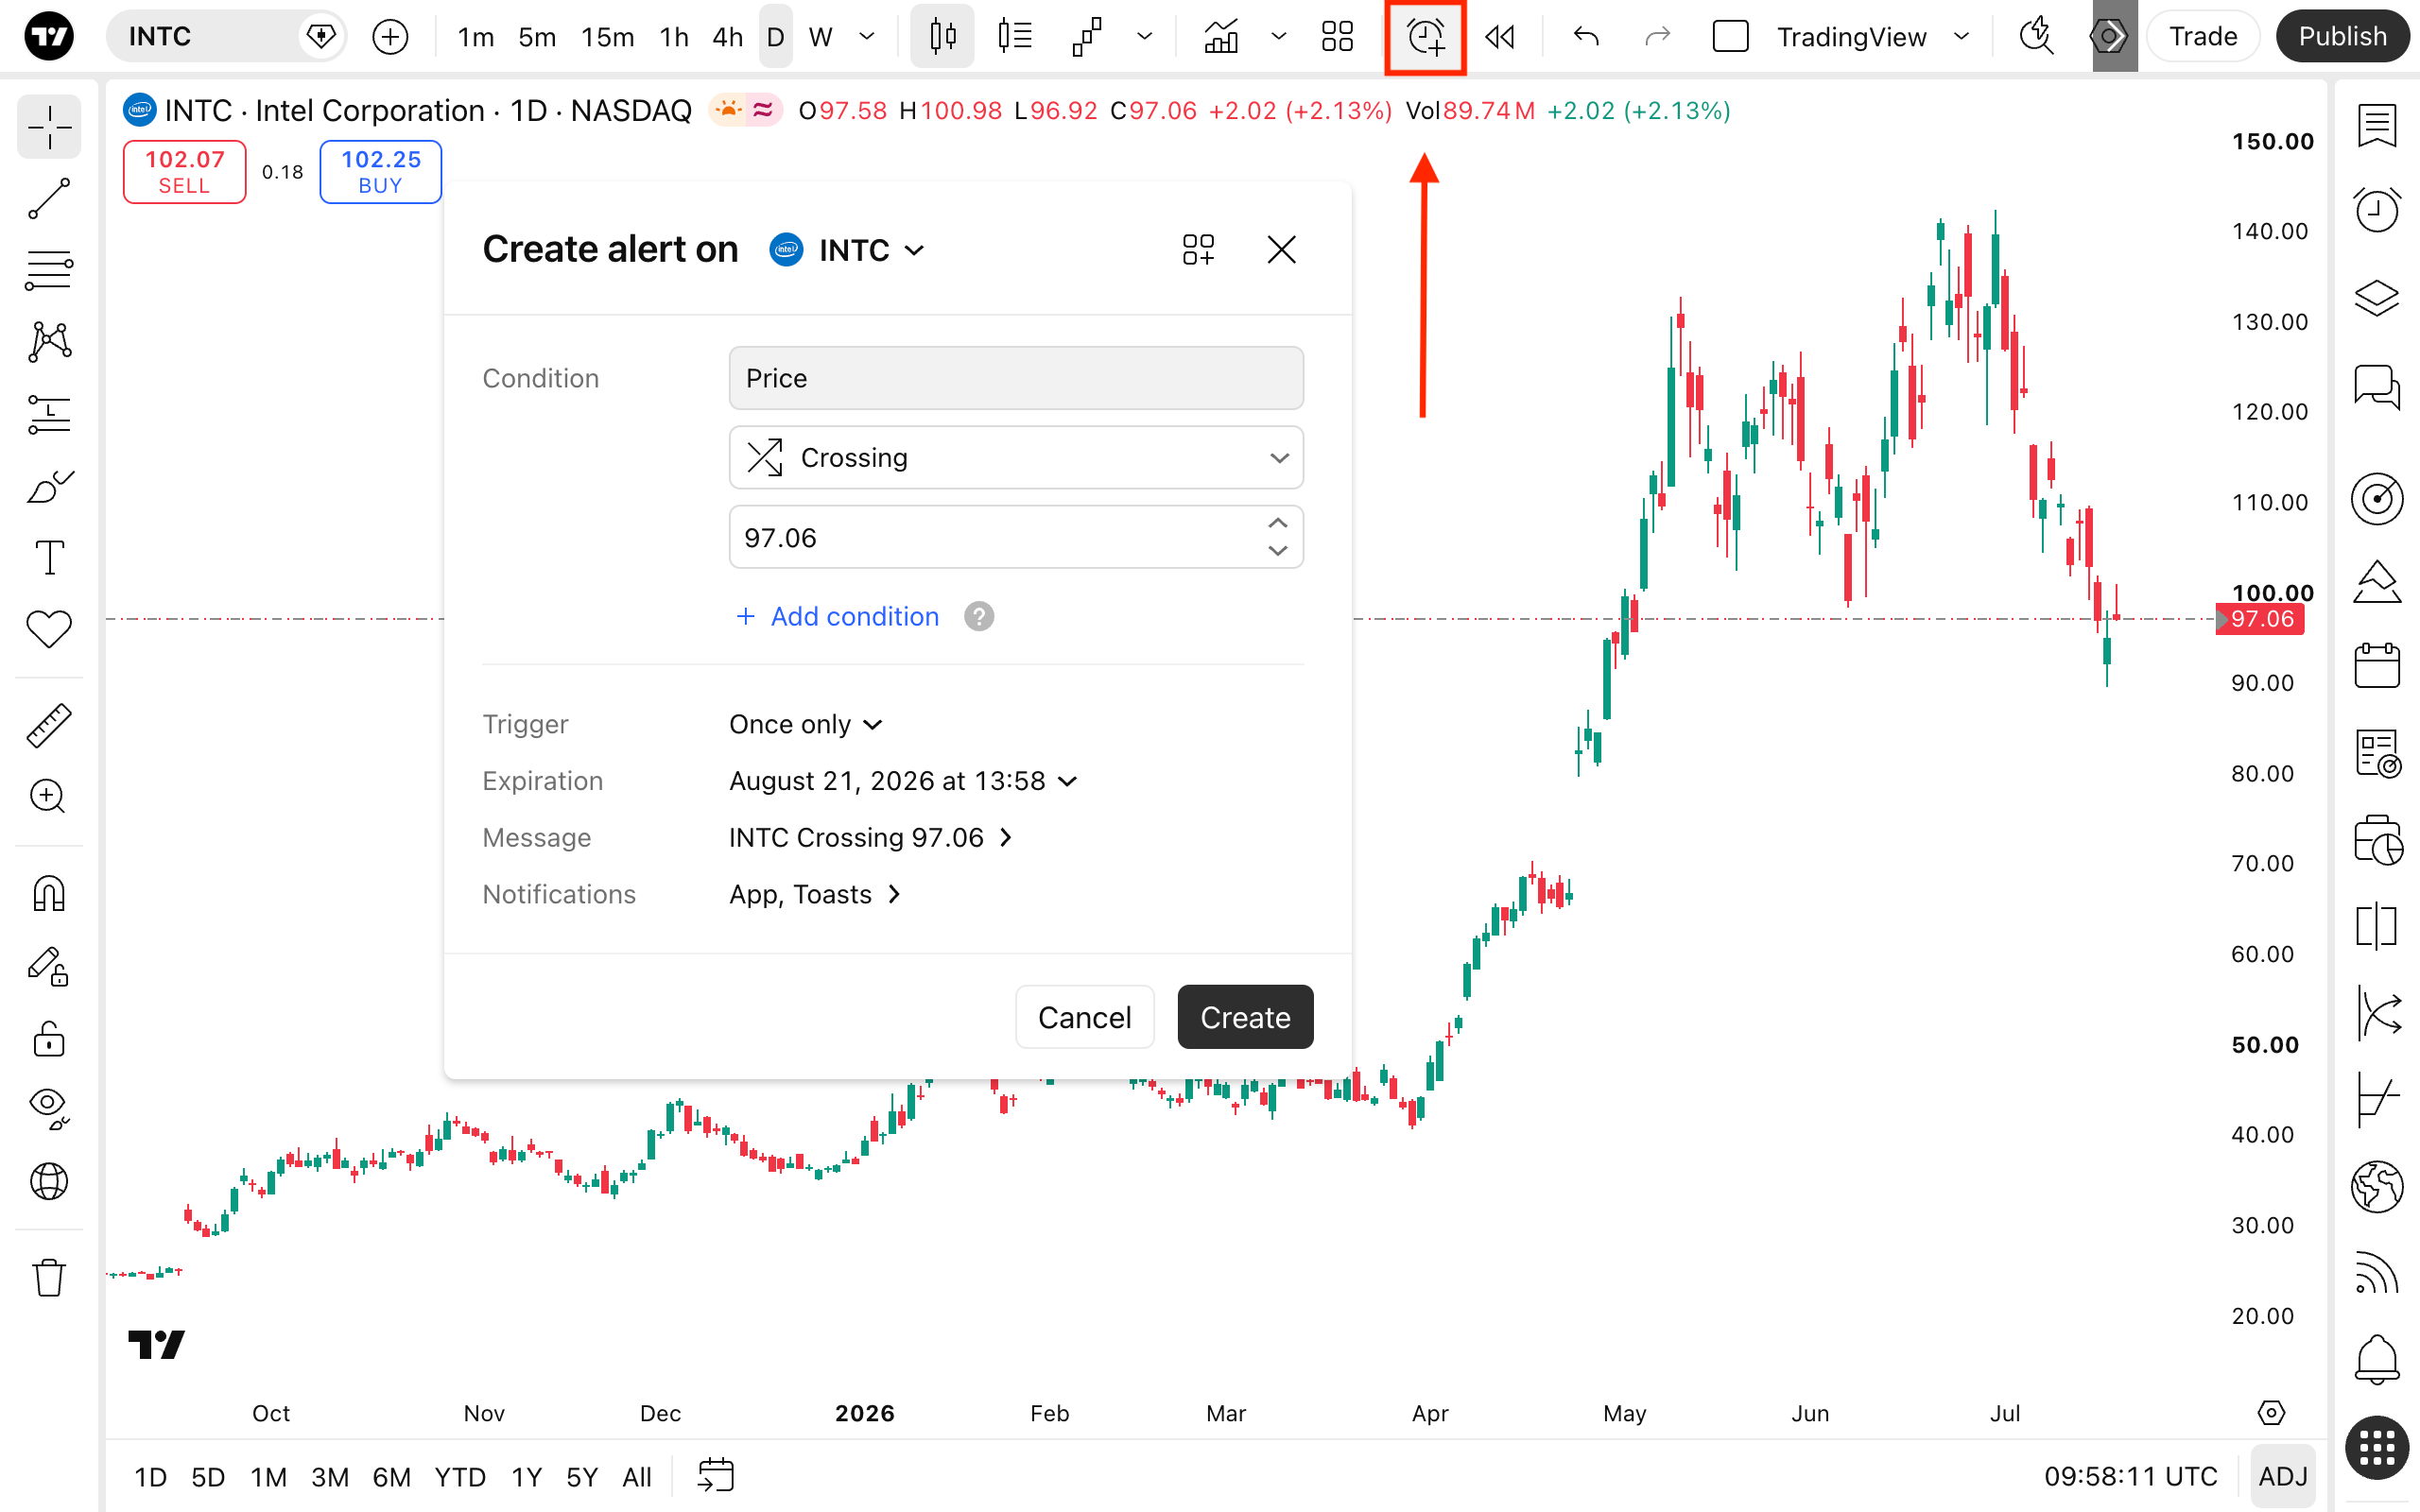
Set up alerts and manage their notifications to keep track of prices, indicators, strategies, or drawings. You can choose the condition that'll trigger the alert, its expiration date, and leave a message alongside it.
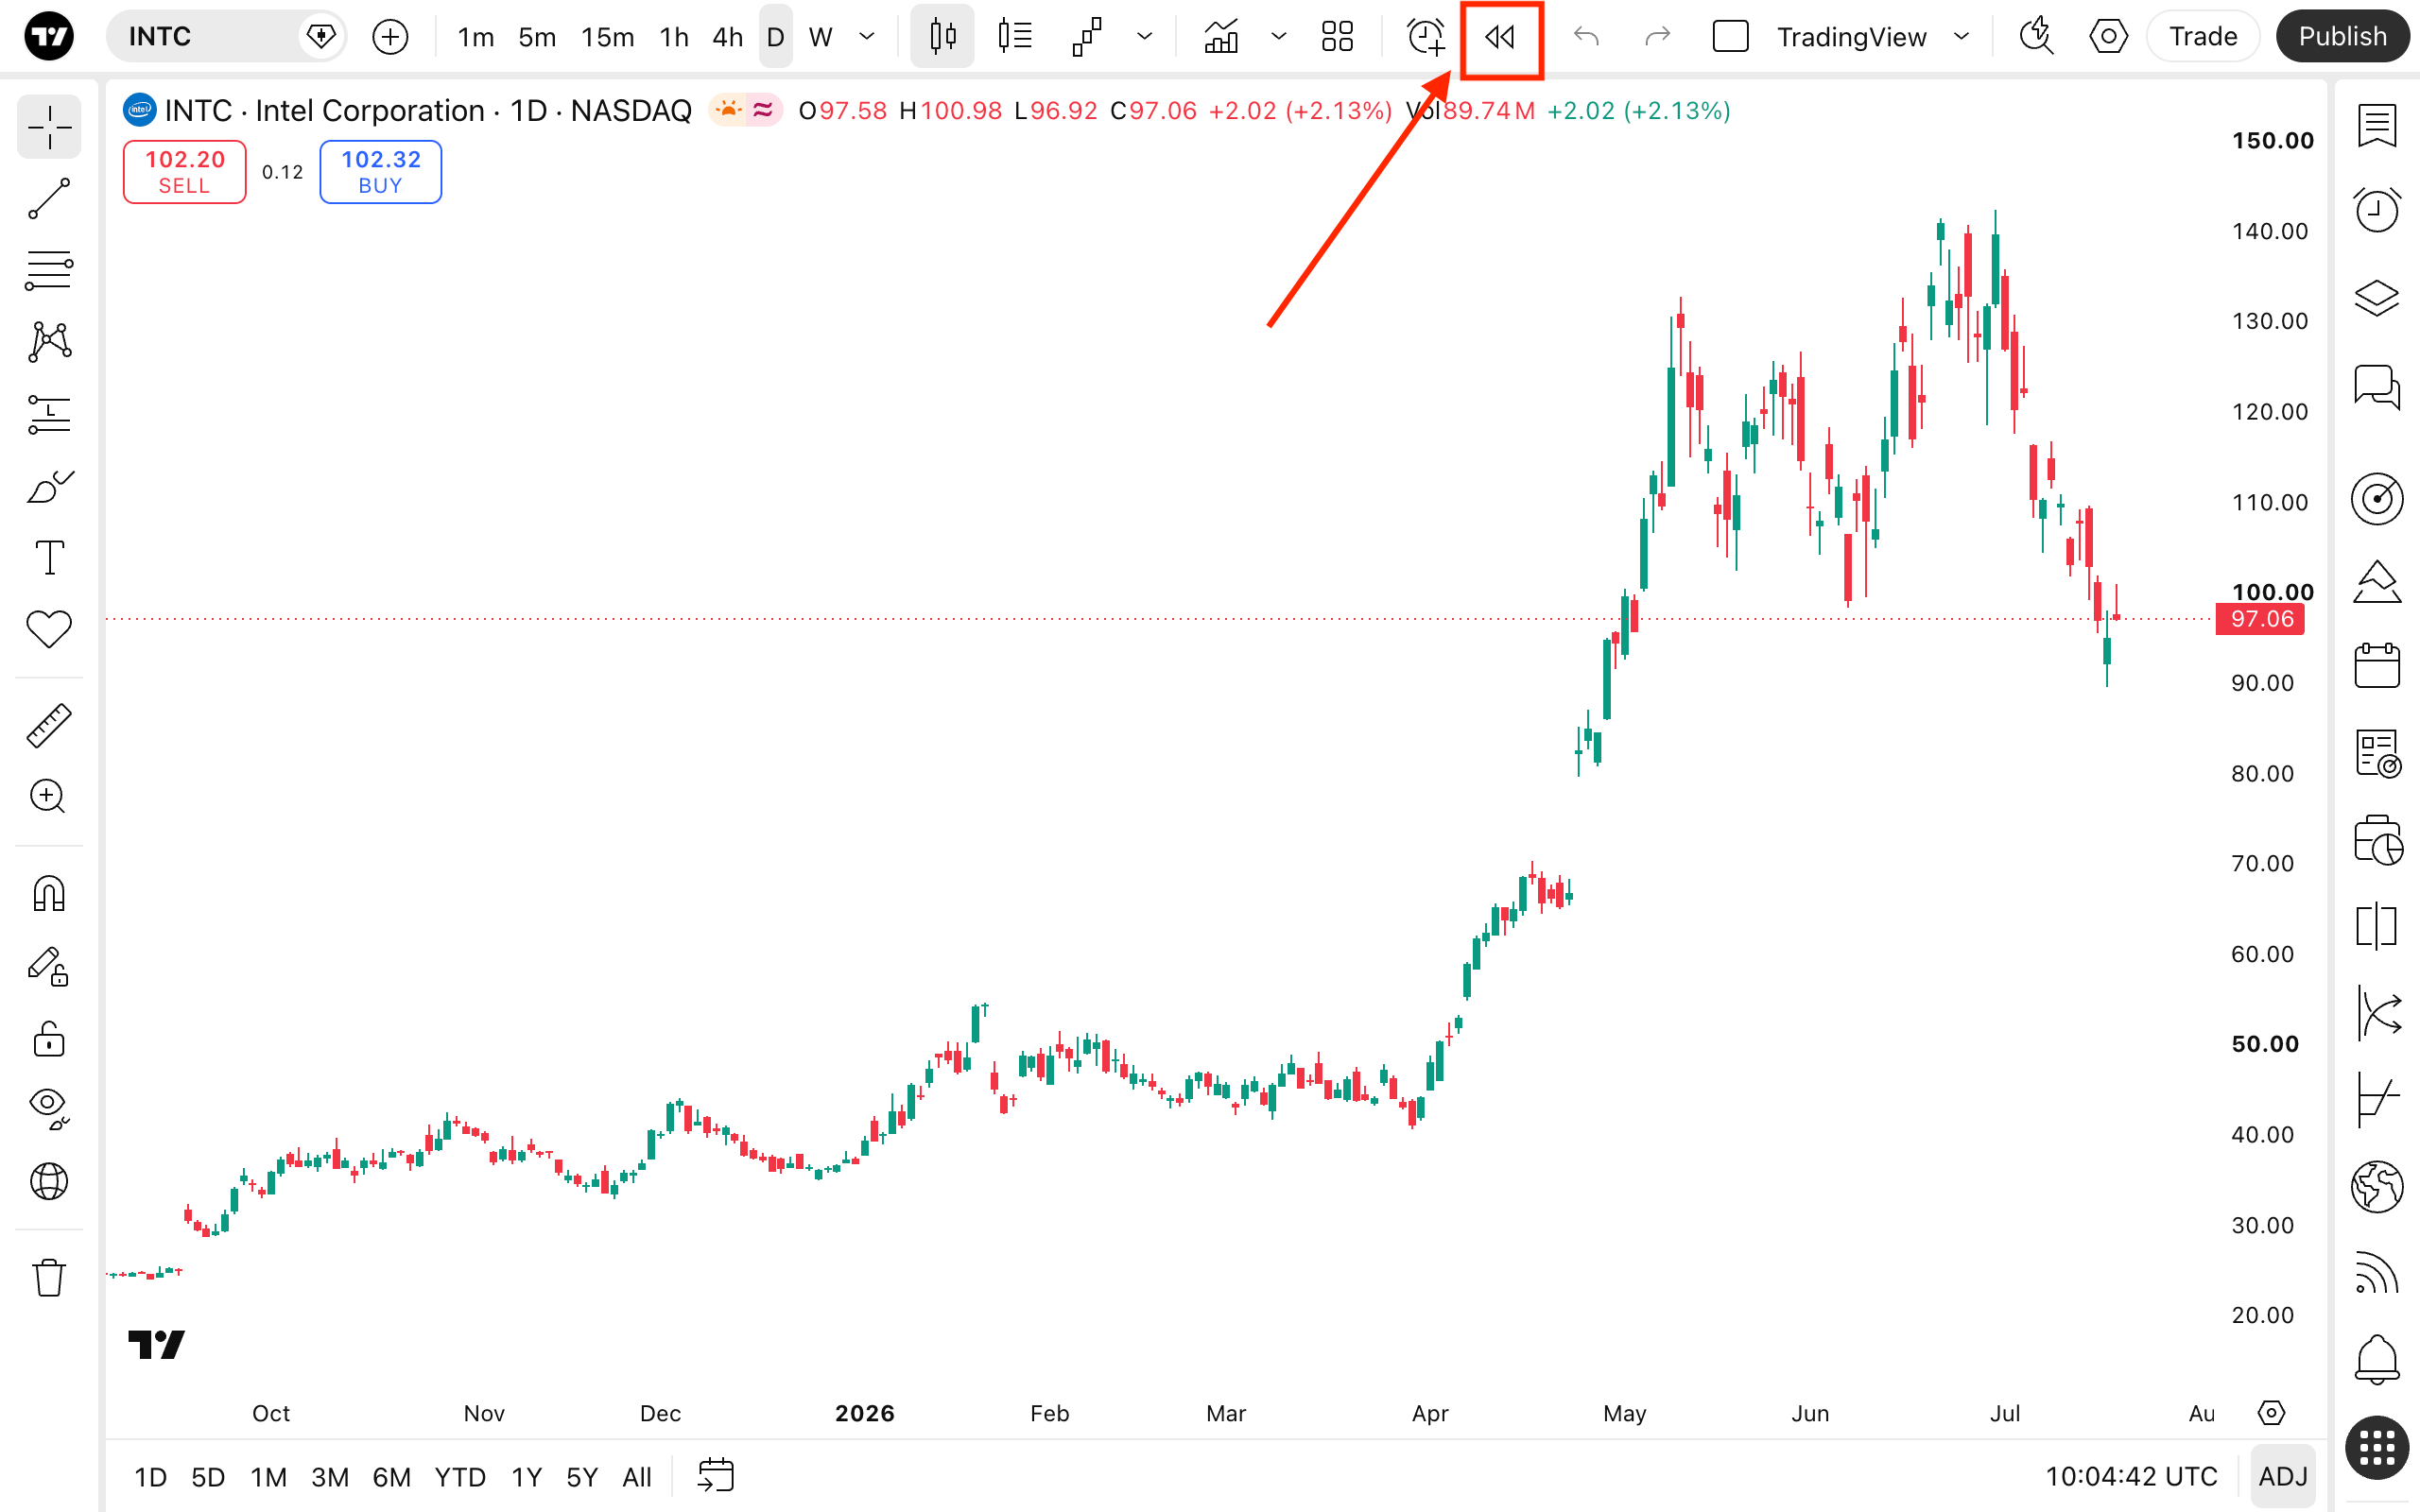
Bar replay
Bar replay allows you to simulate past price movements for strategy testing. You can go back in time to analyze historical market behavior and practice trading decisions and test strategies without real financial exposure.
Undo and Redo buttons
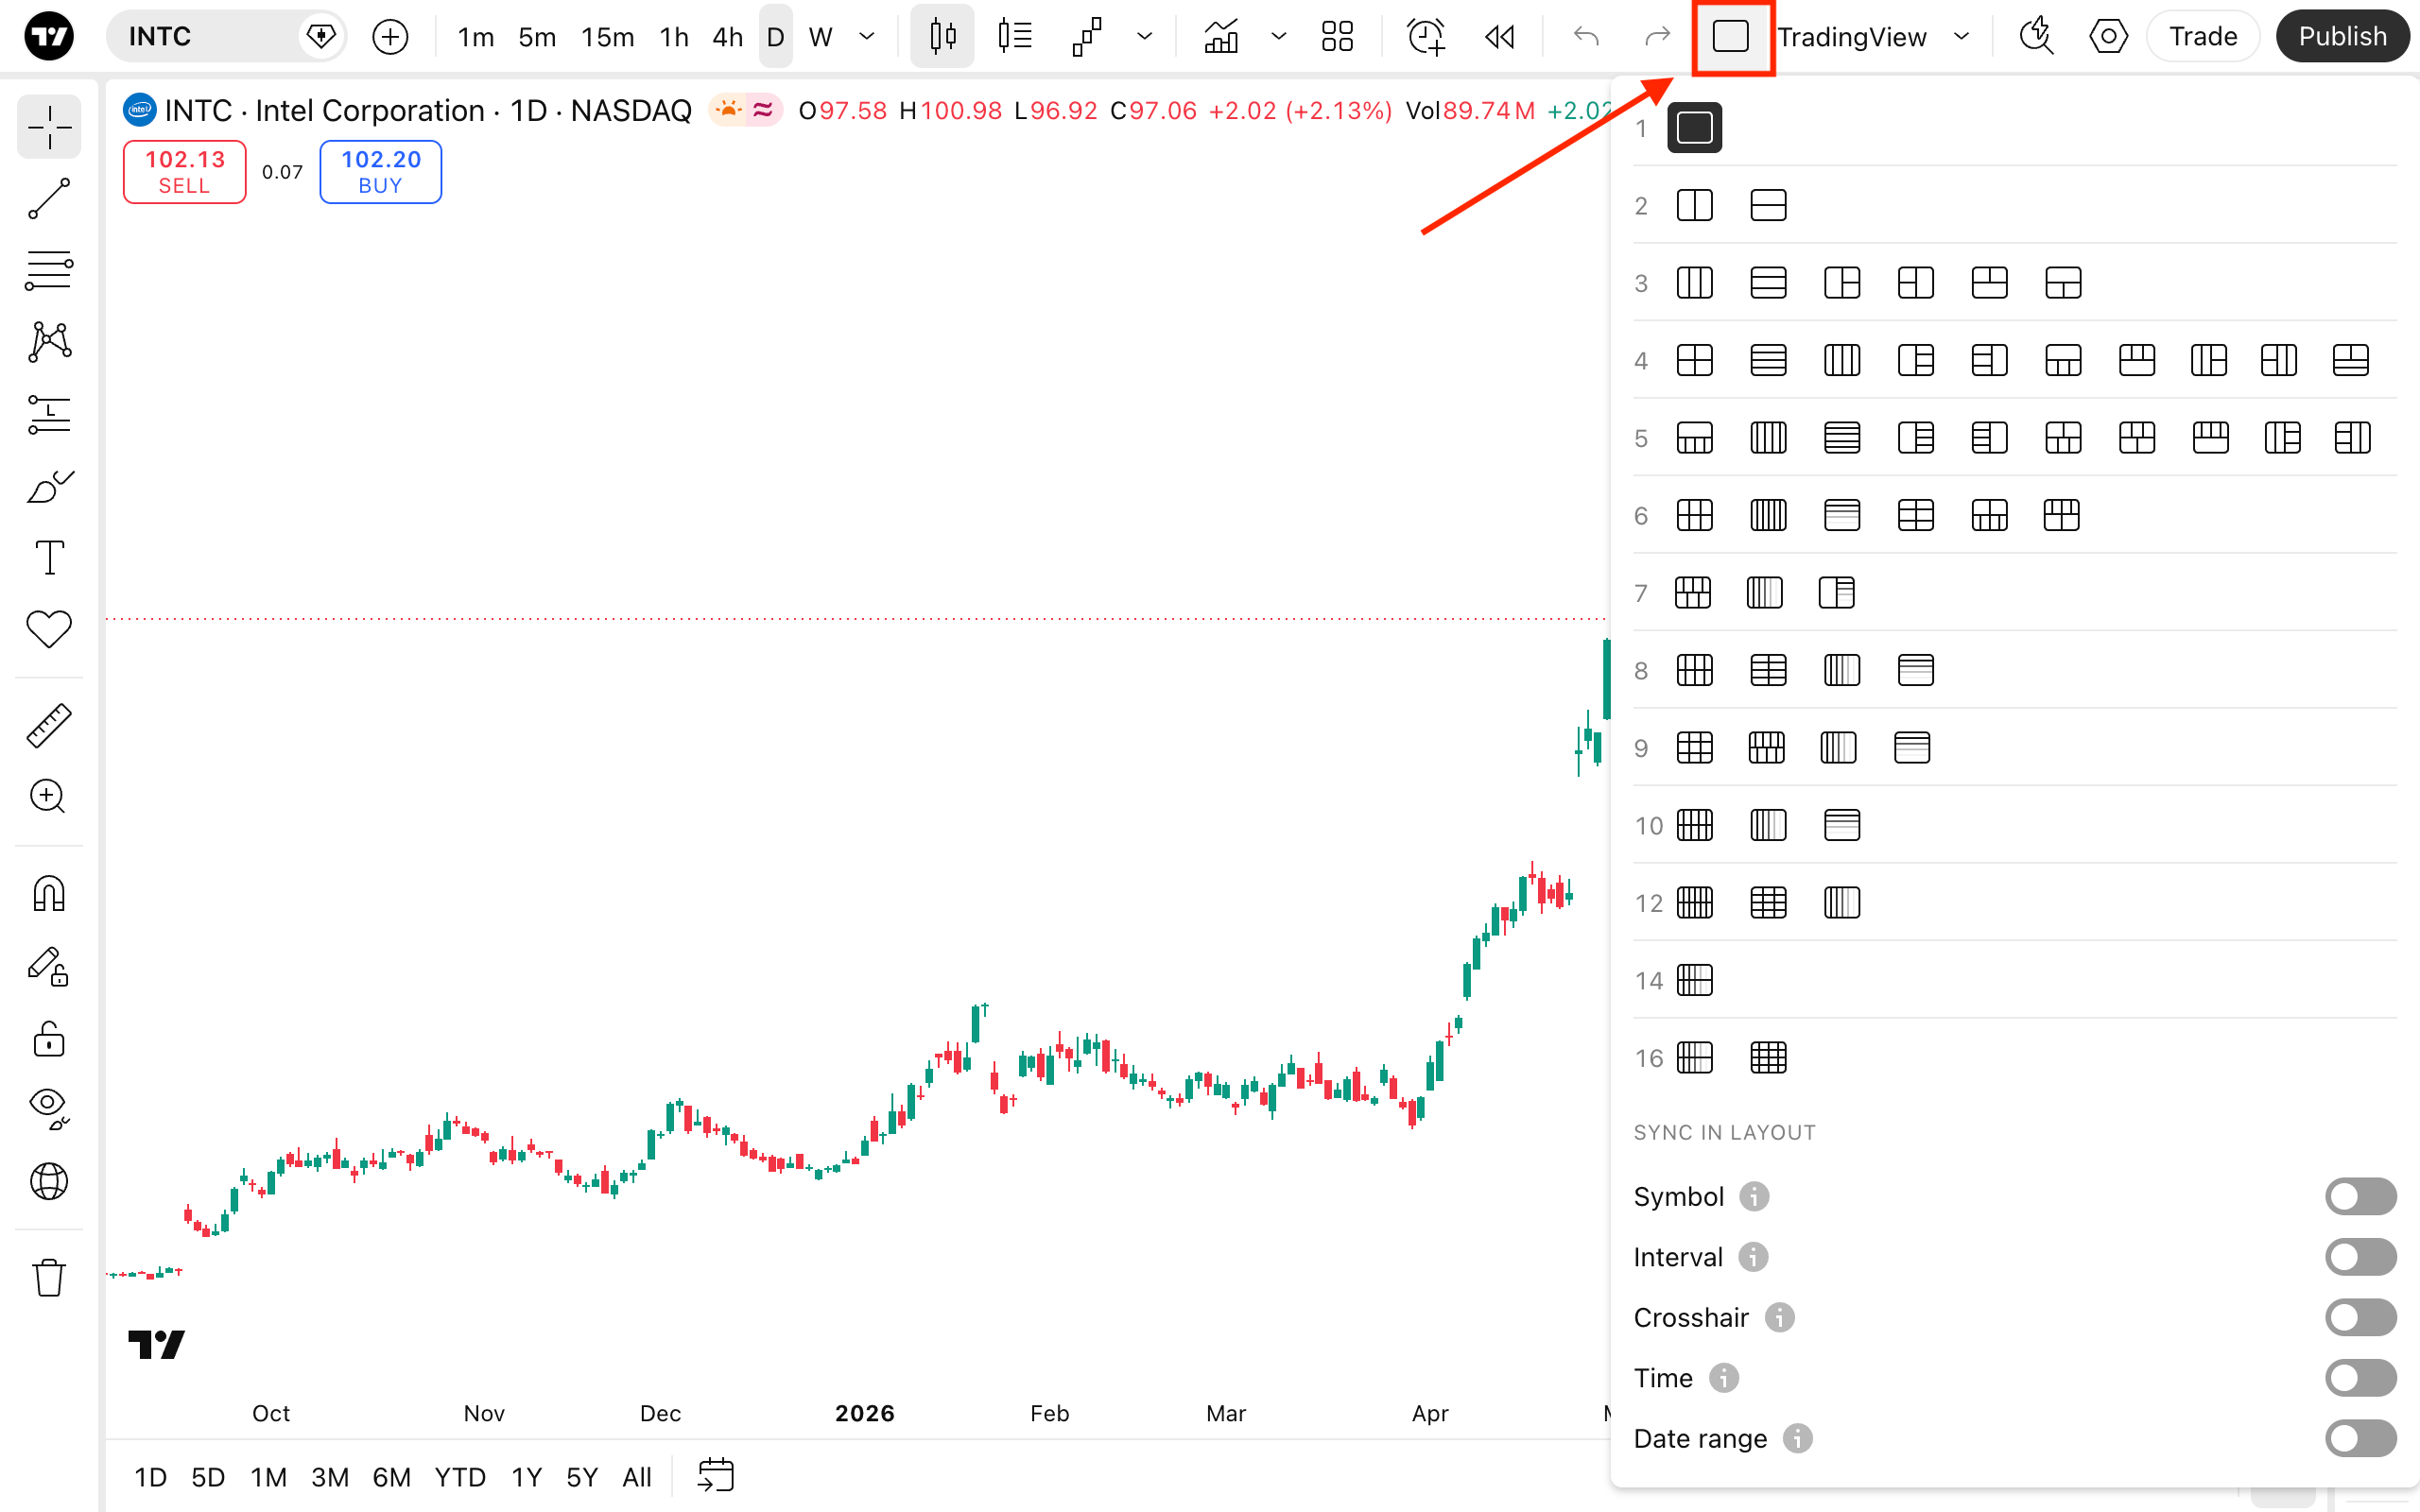
All changes on the chart can be managed with the help of the "Undo" and "Redo" buttons.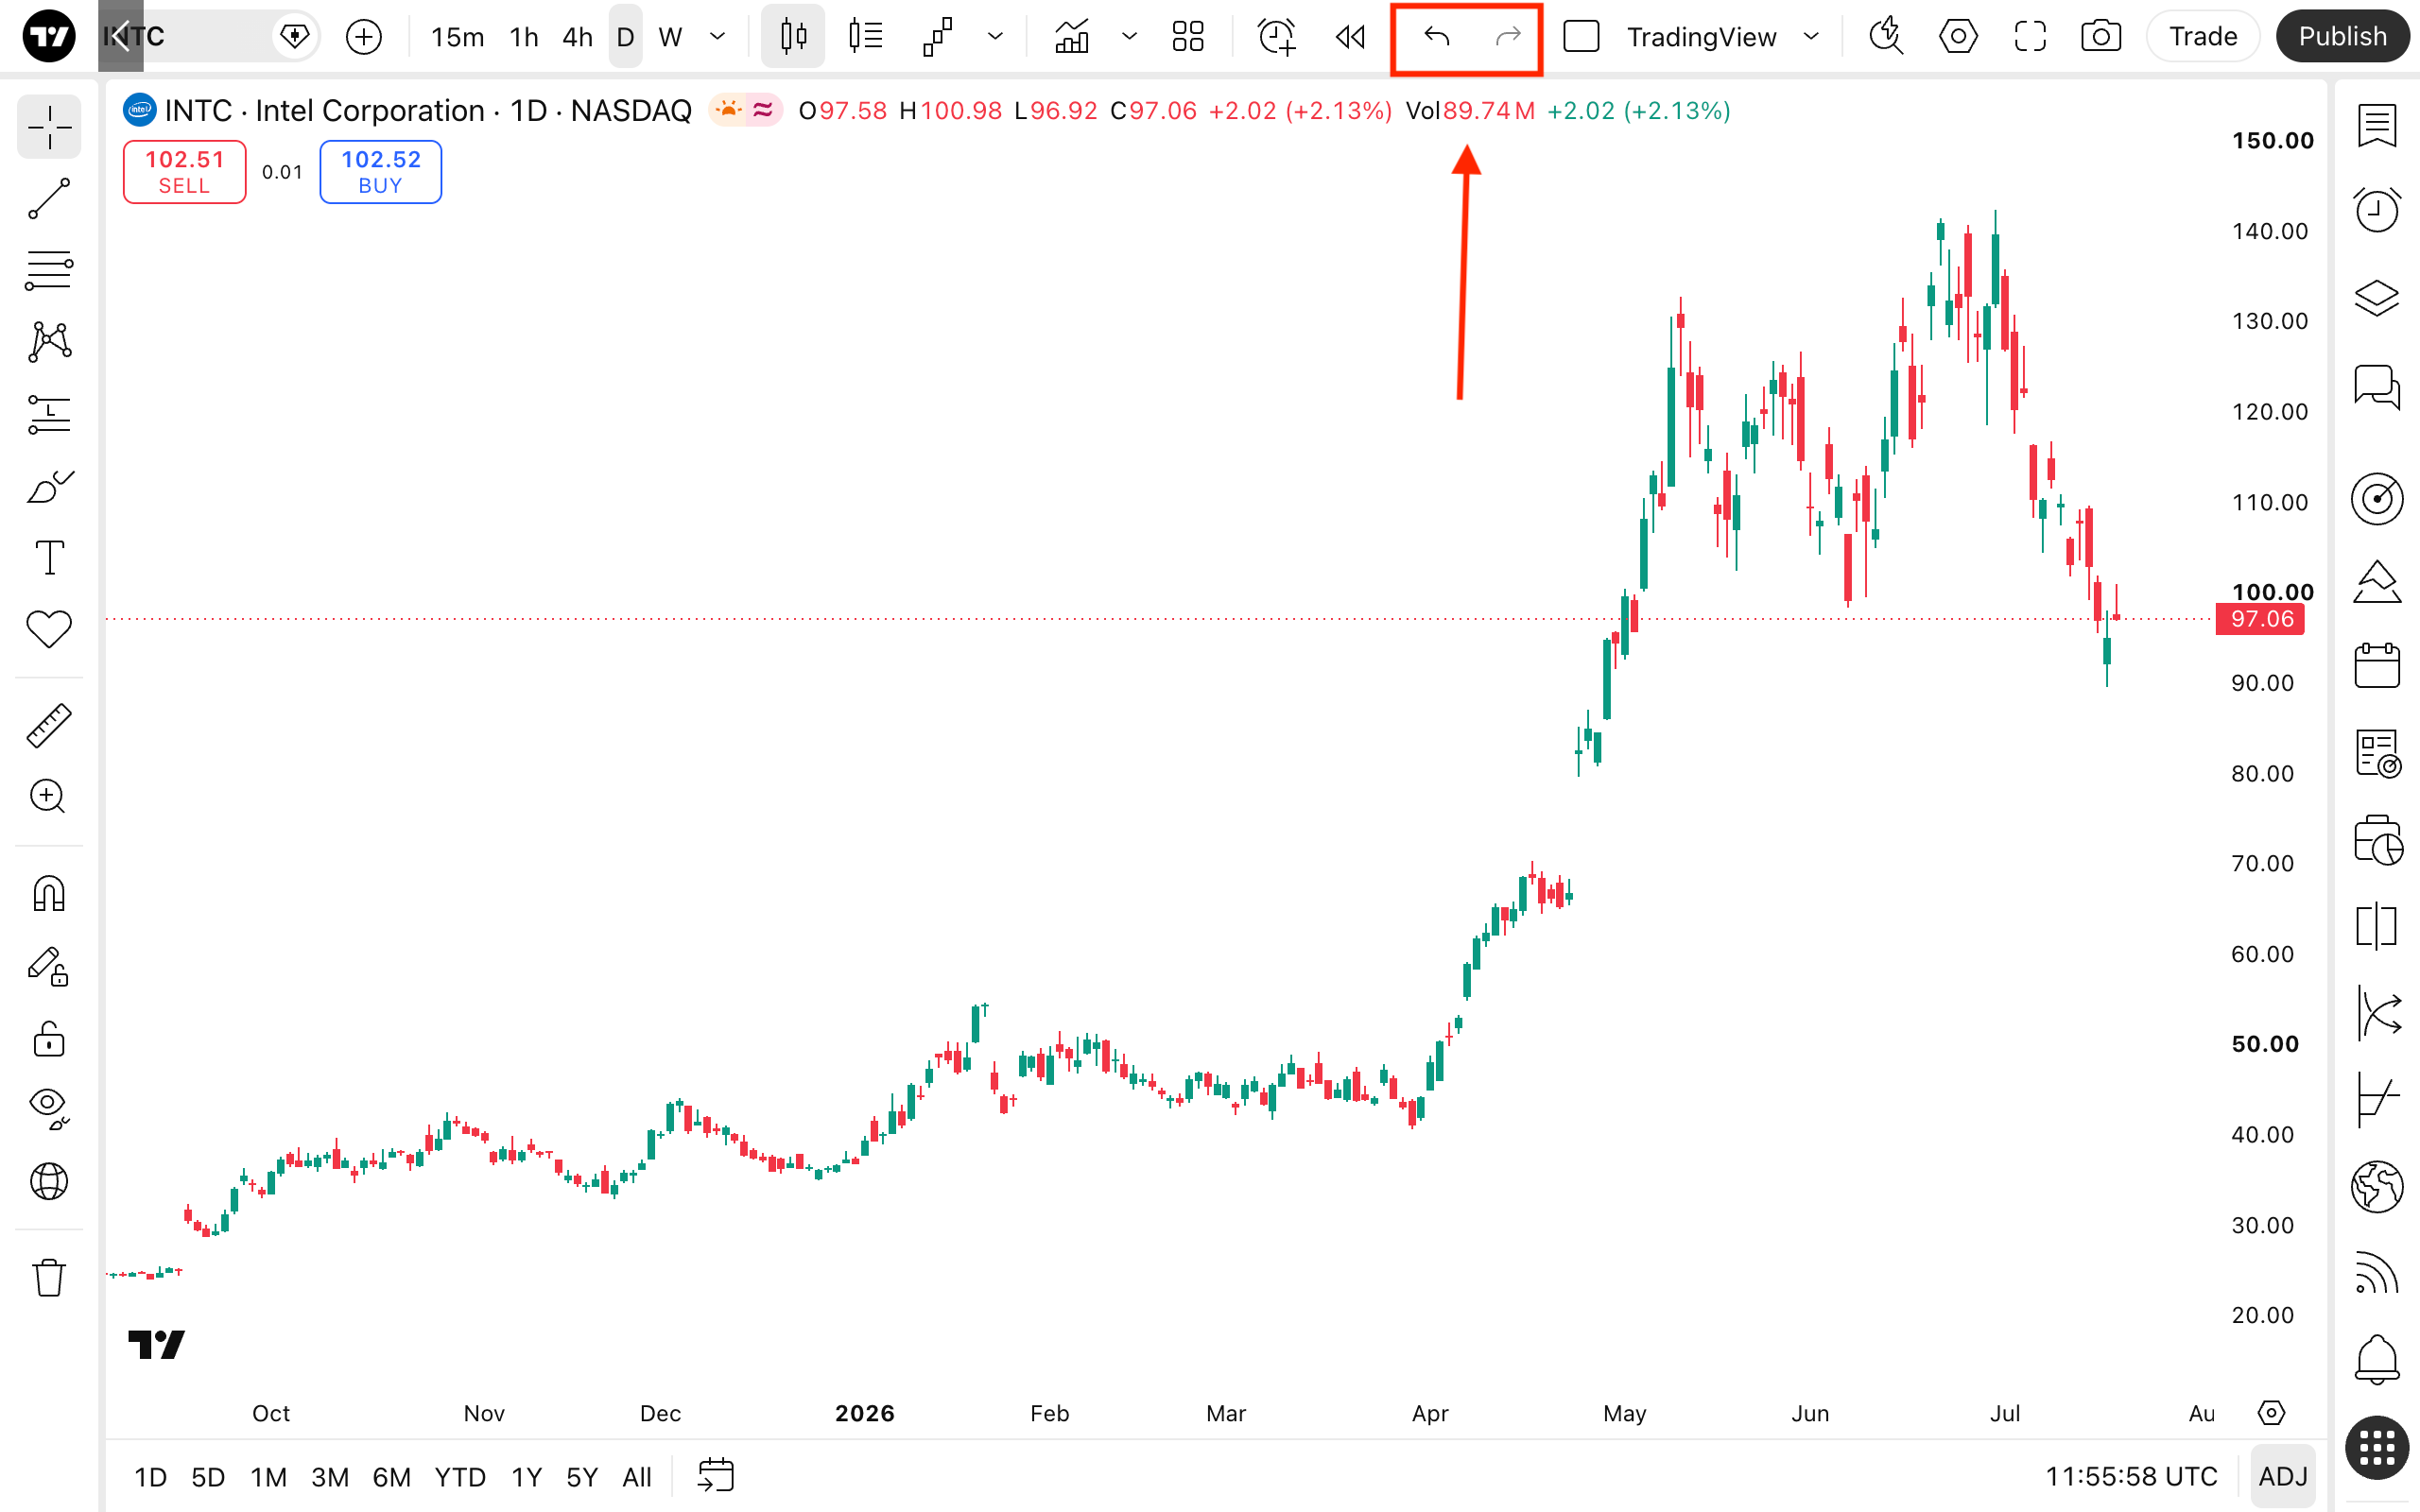 Chart layouts
In the layout setup menu, you can configure the number and placement of charts. In its essence, a layout is a separately saved workspace. Each chart within a layout retains its own settings and can be customized independently, but you can also choose to sync them.
Quick search
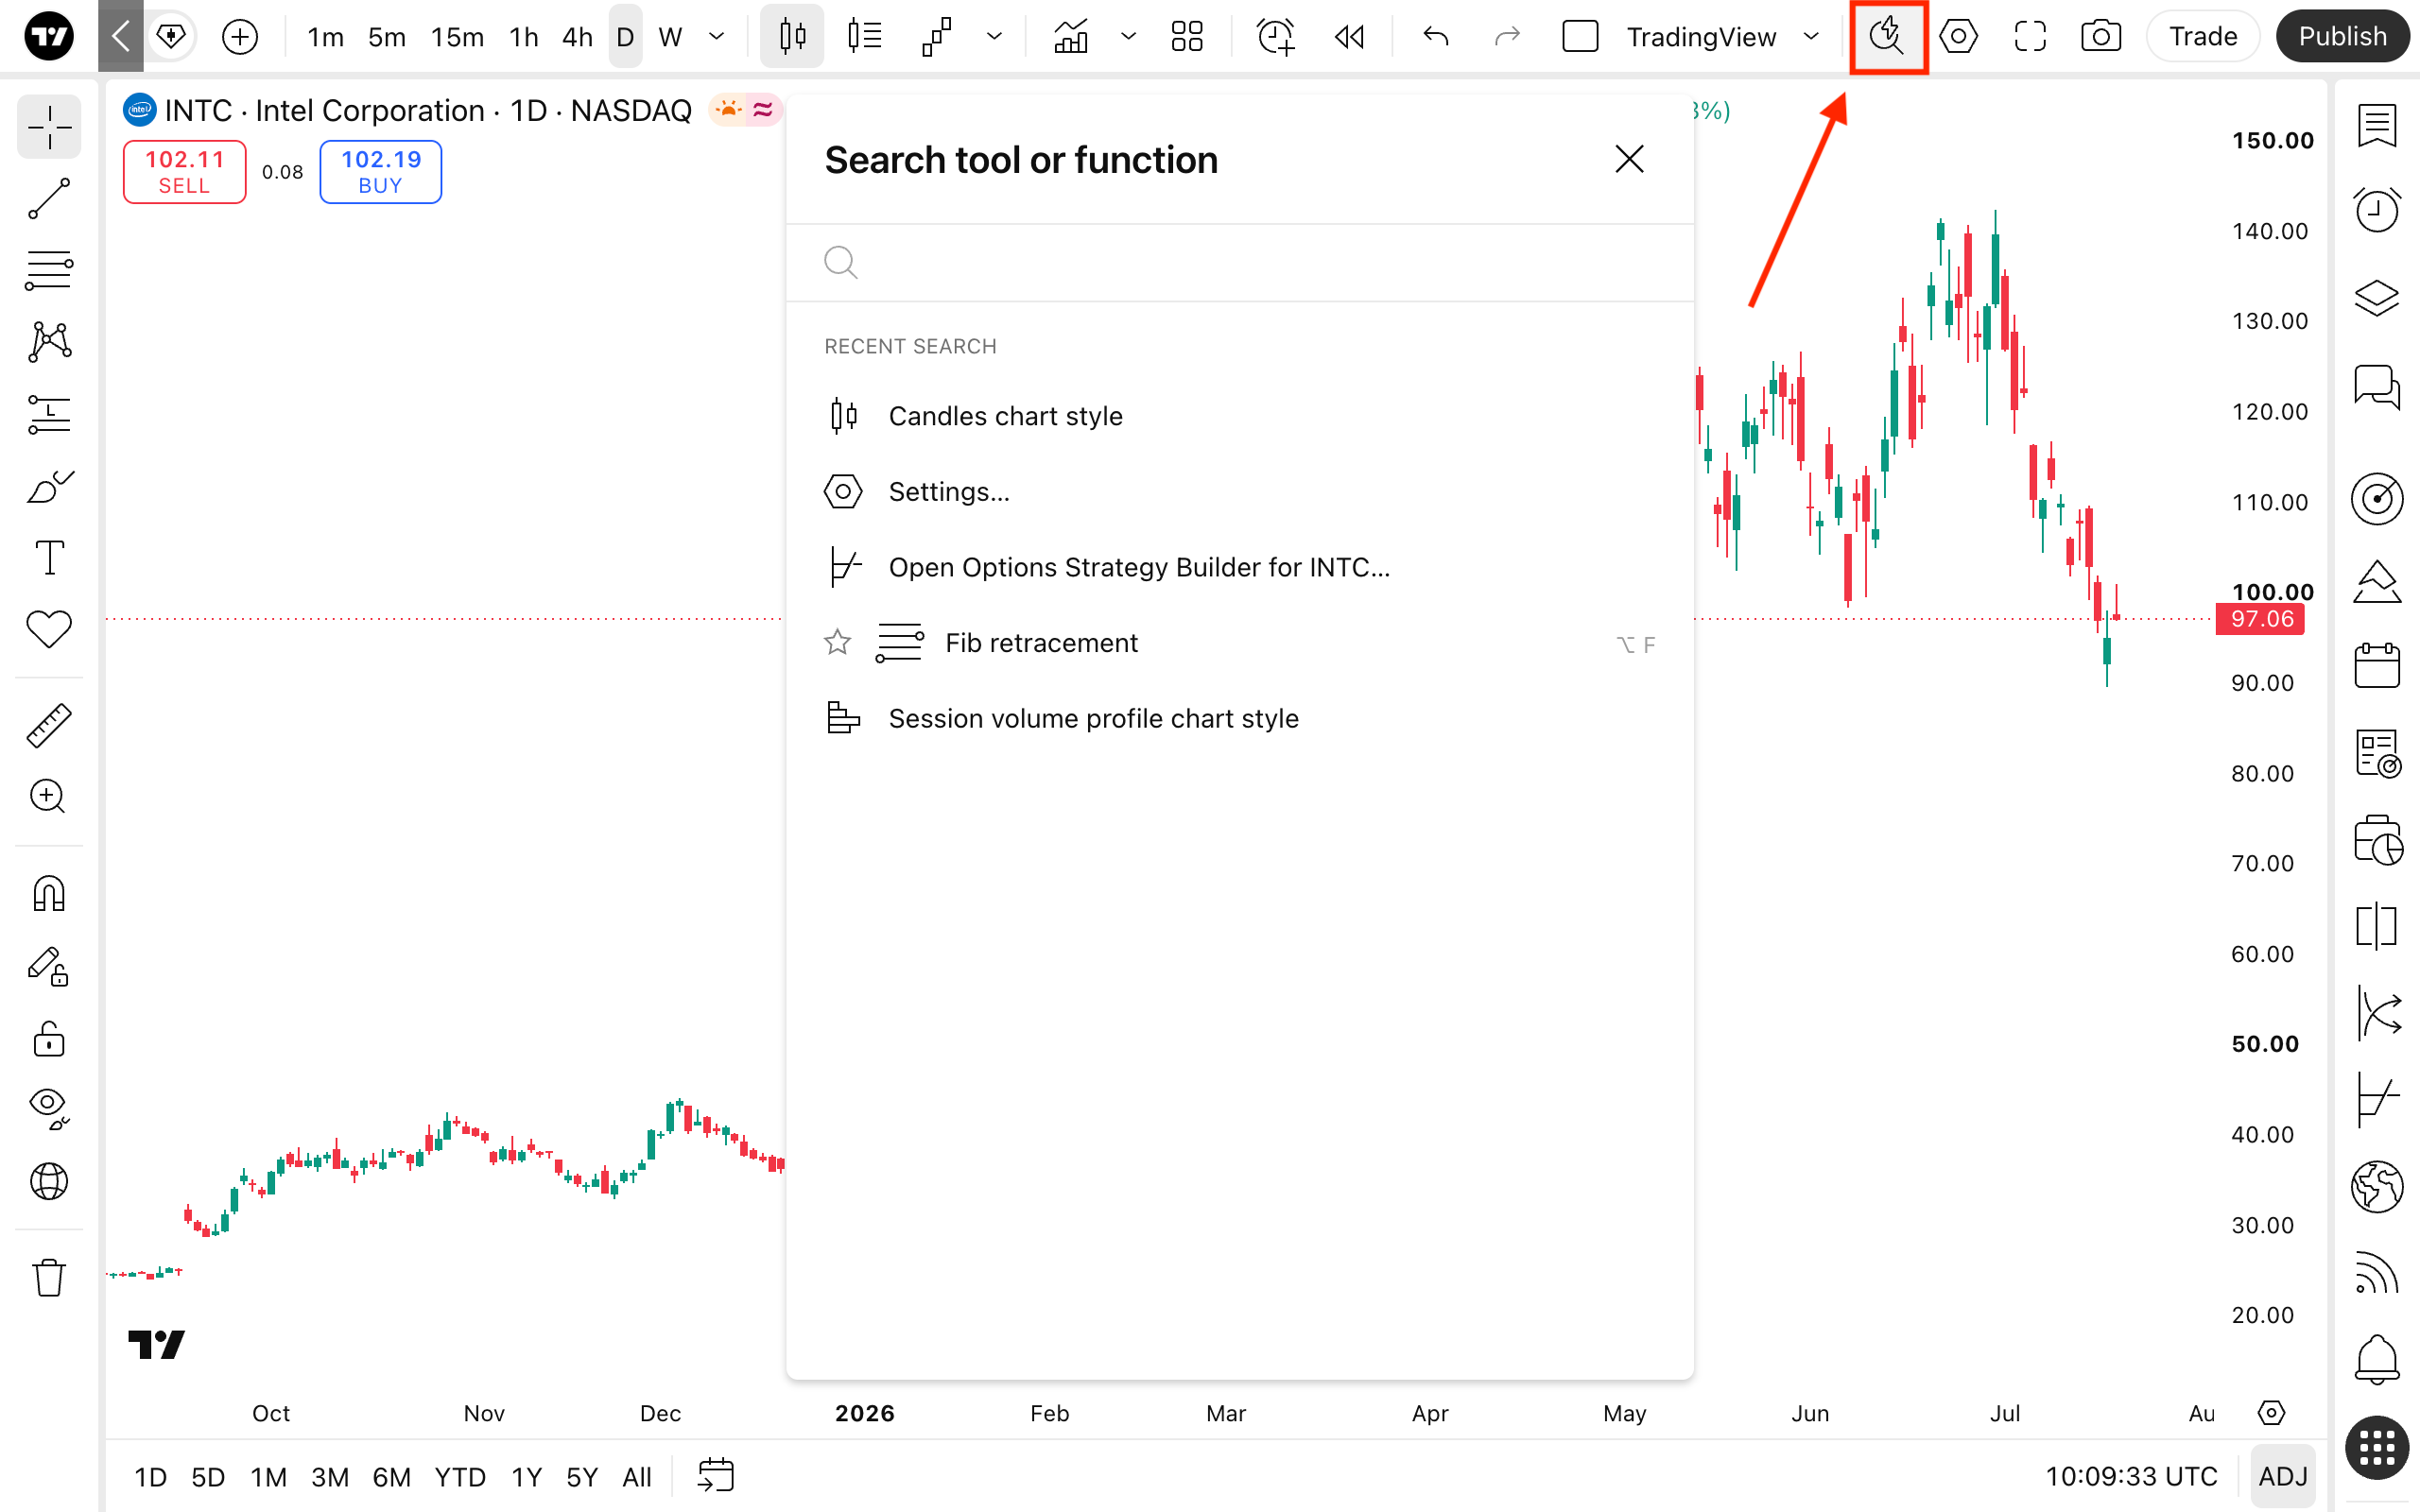
To facilitate navigation, click the "Quick search" button. This is an easy way to find tools, functions, drawings, or settings.
Settings
You can configure the chart as you desire. To open the settings menu, click the "Settings" button at the top right corner or double-click on the price line, bar, or candlestick.
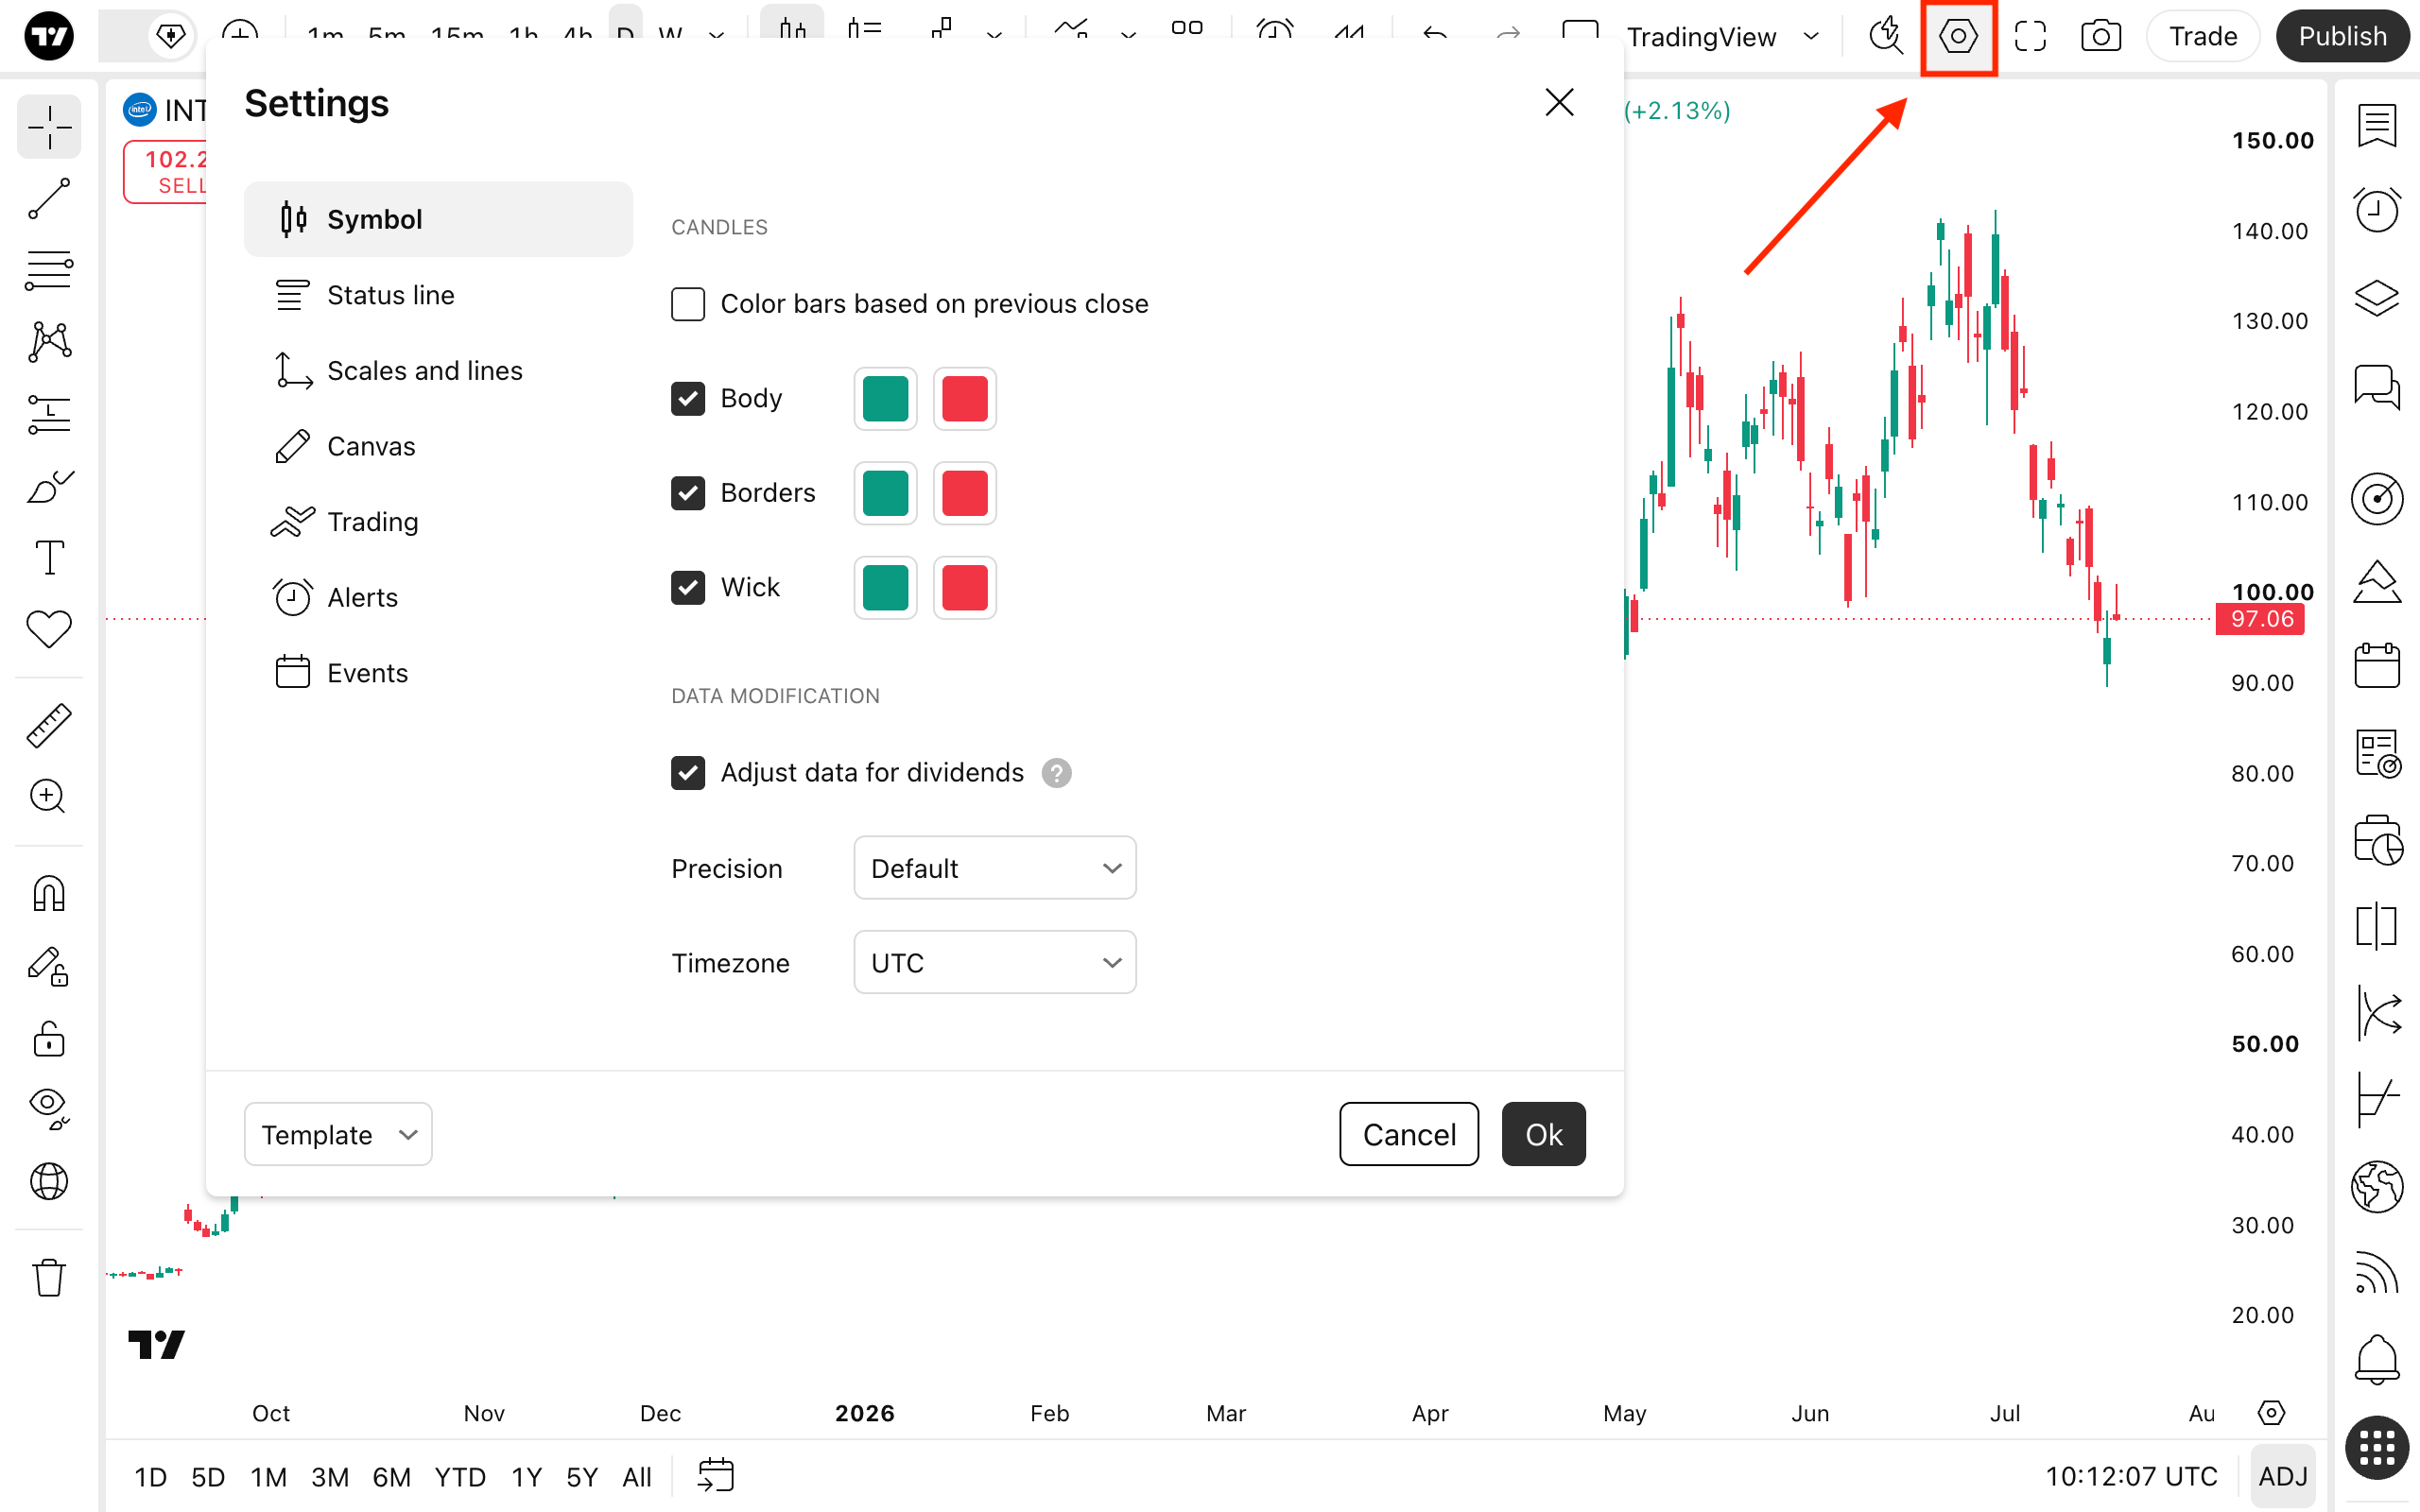
To learn more about Superchart settings, read our article — How to configure your Supercharts.
Take a snapshot
This button allows you to take a snapshot of your current chart. Download it, save it, or post it — use every feature to share your thoughts and get feedback.
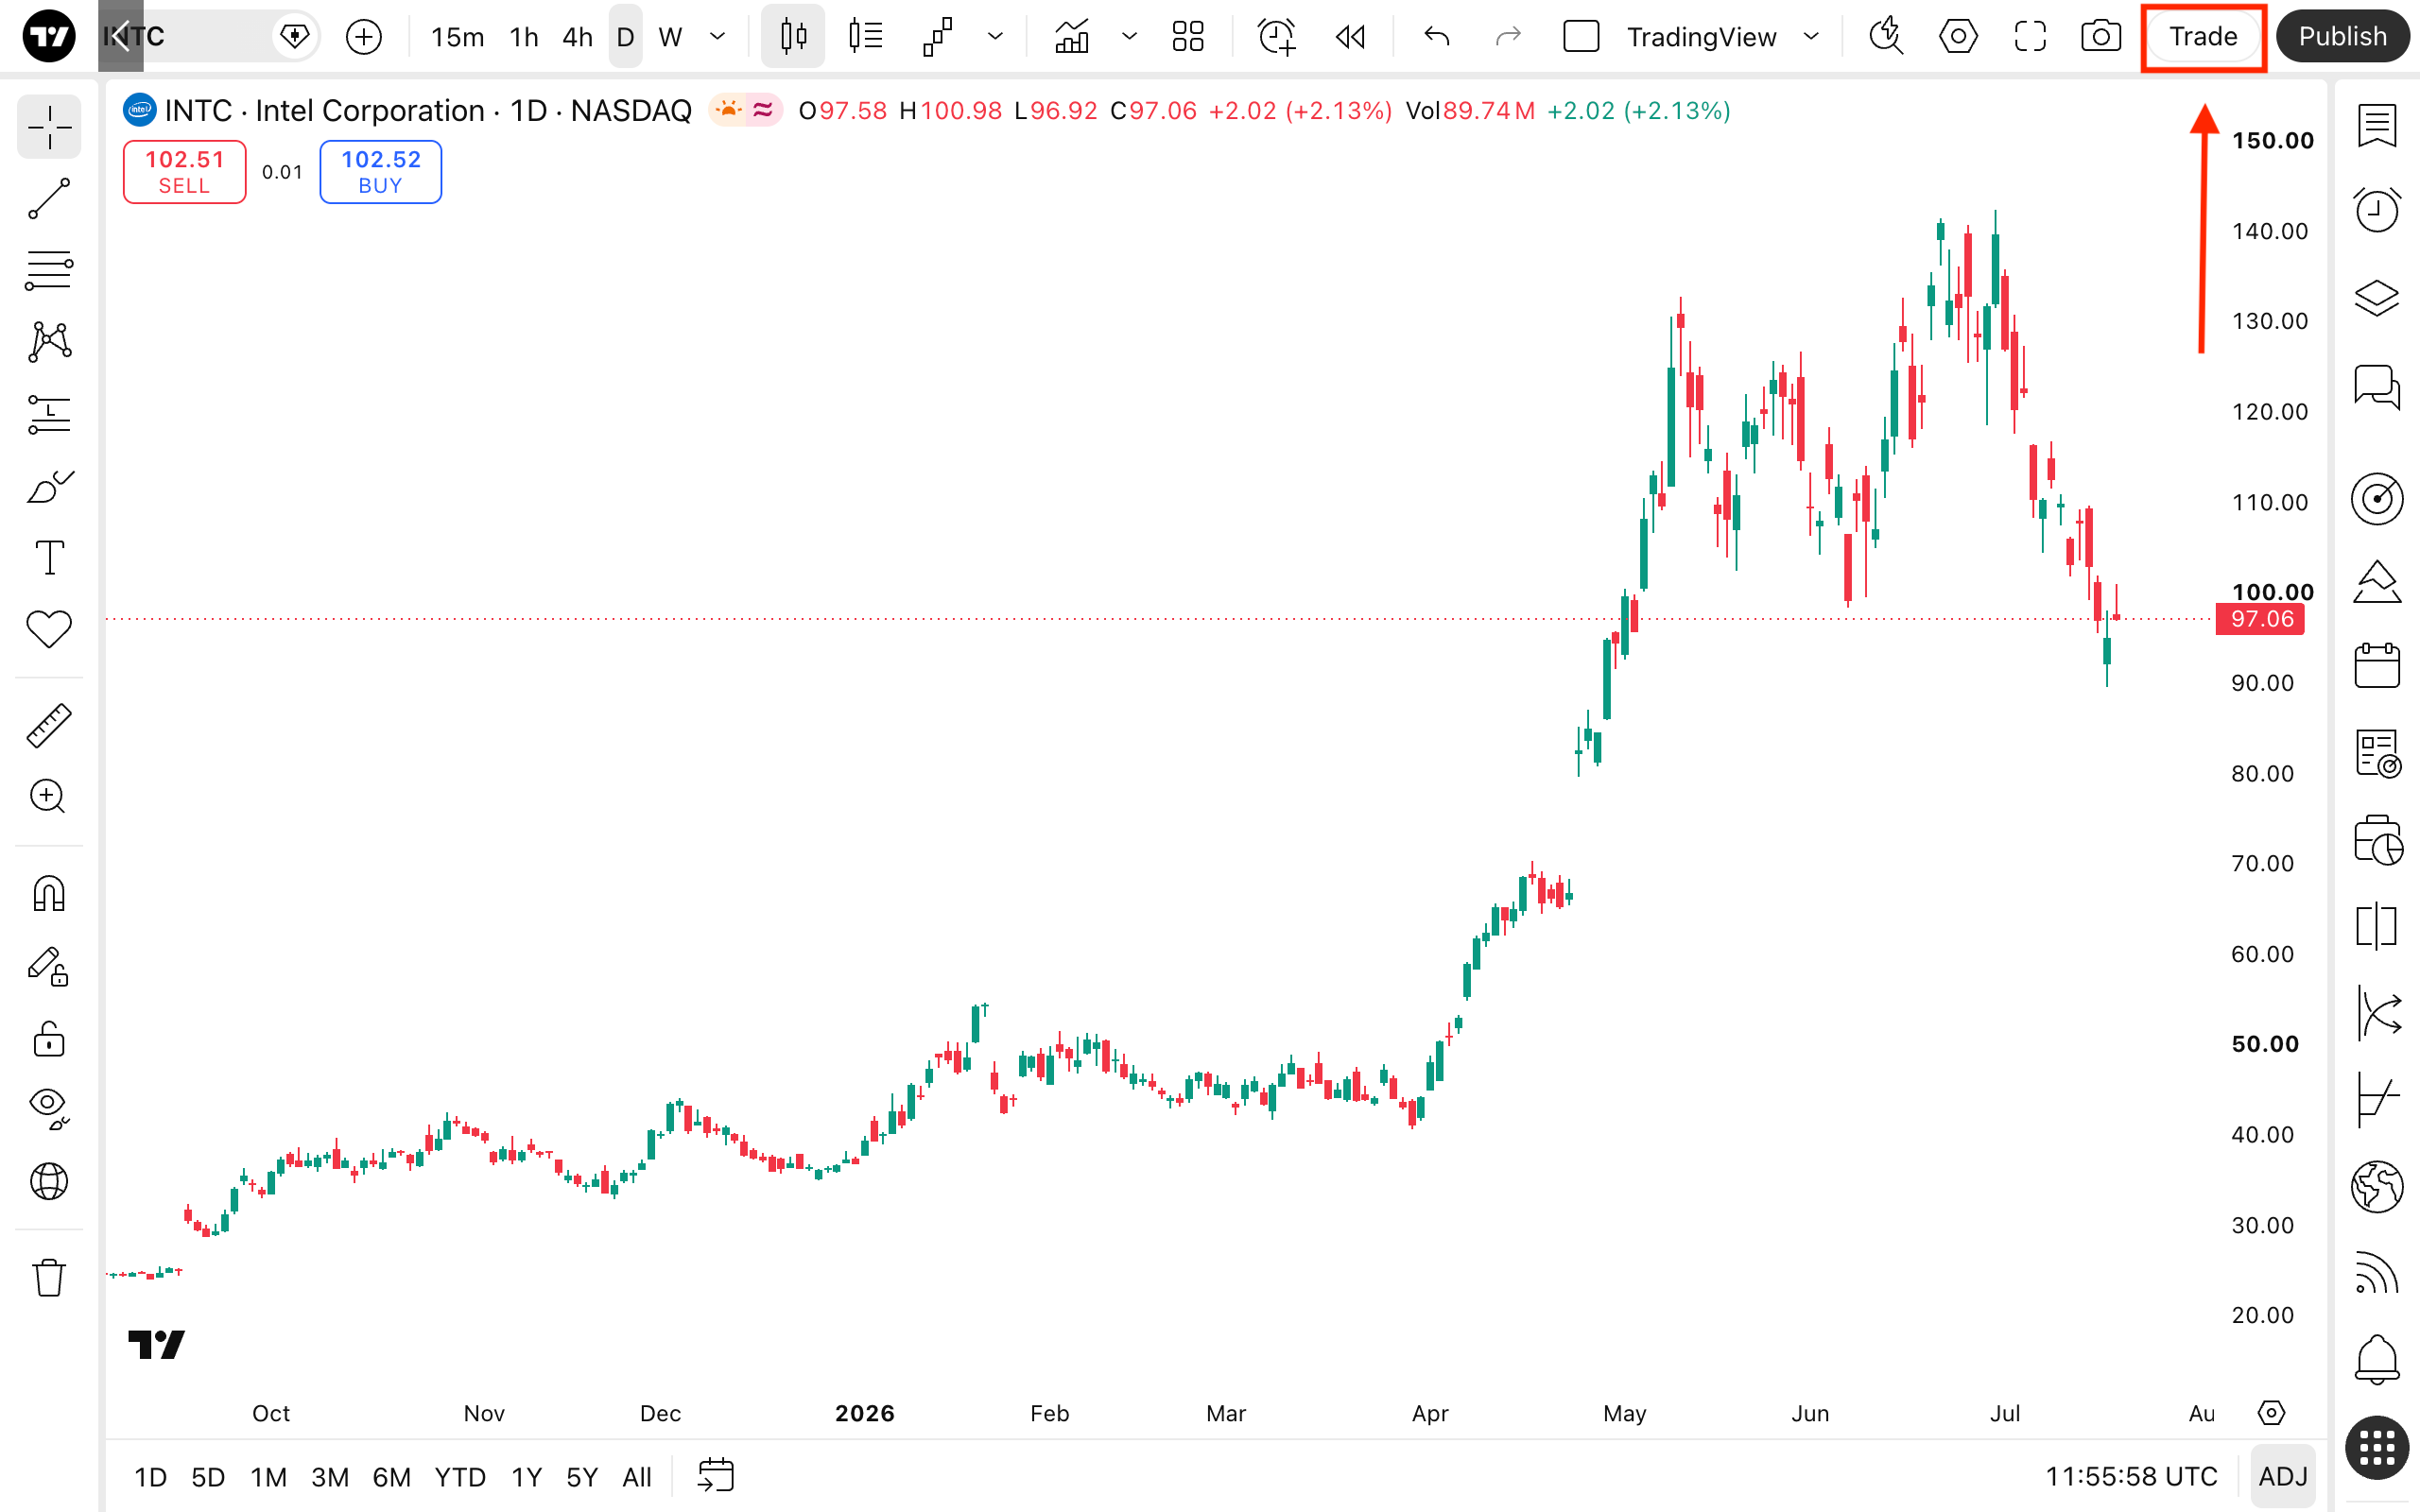
Trade
Here, you can connect to Paper Trading and other top brokers on our platform.
Publish
We are convinced that trading should be social. With the "Publish" button, you can share ideas on the current market state. Learn how to become a top author by consistently creating and publishing high-quality ideas and get lots of rockets and boosts.
The left toolbar
This side of the chart allows you to access drawing tools, which help you map your trades. There are many different types of drawings that fit every trading style — from scalping to position trading.
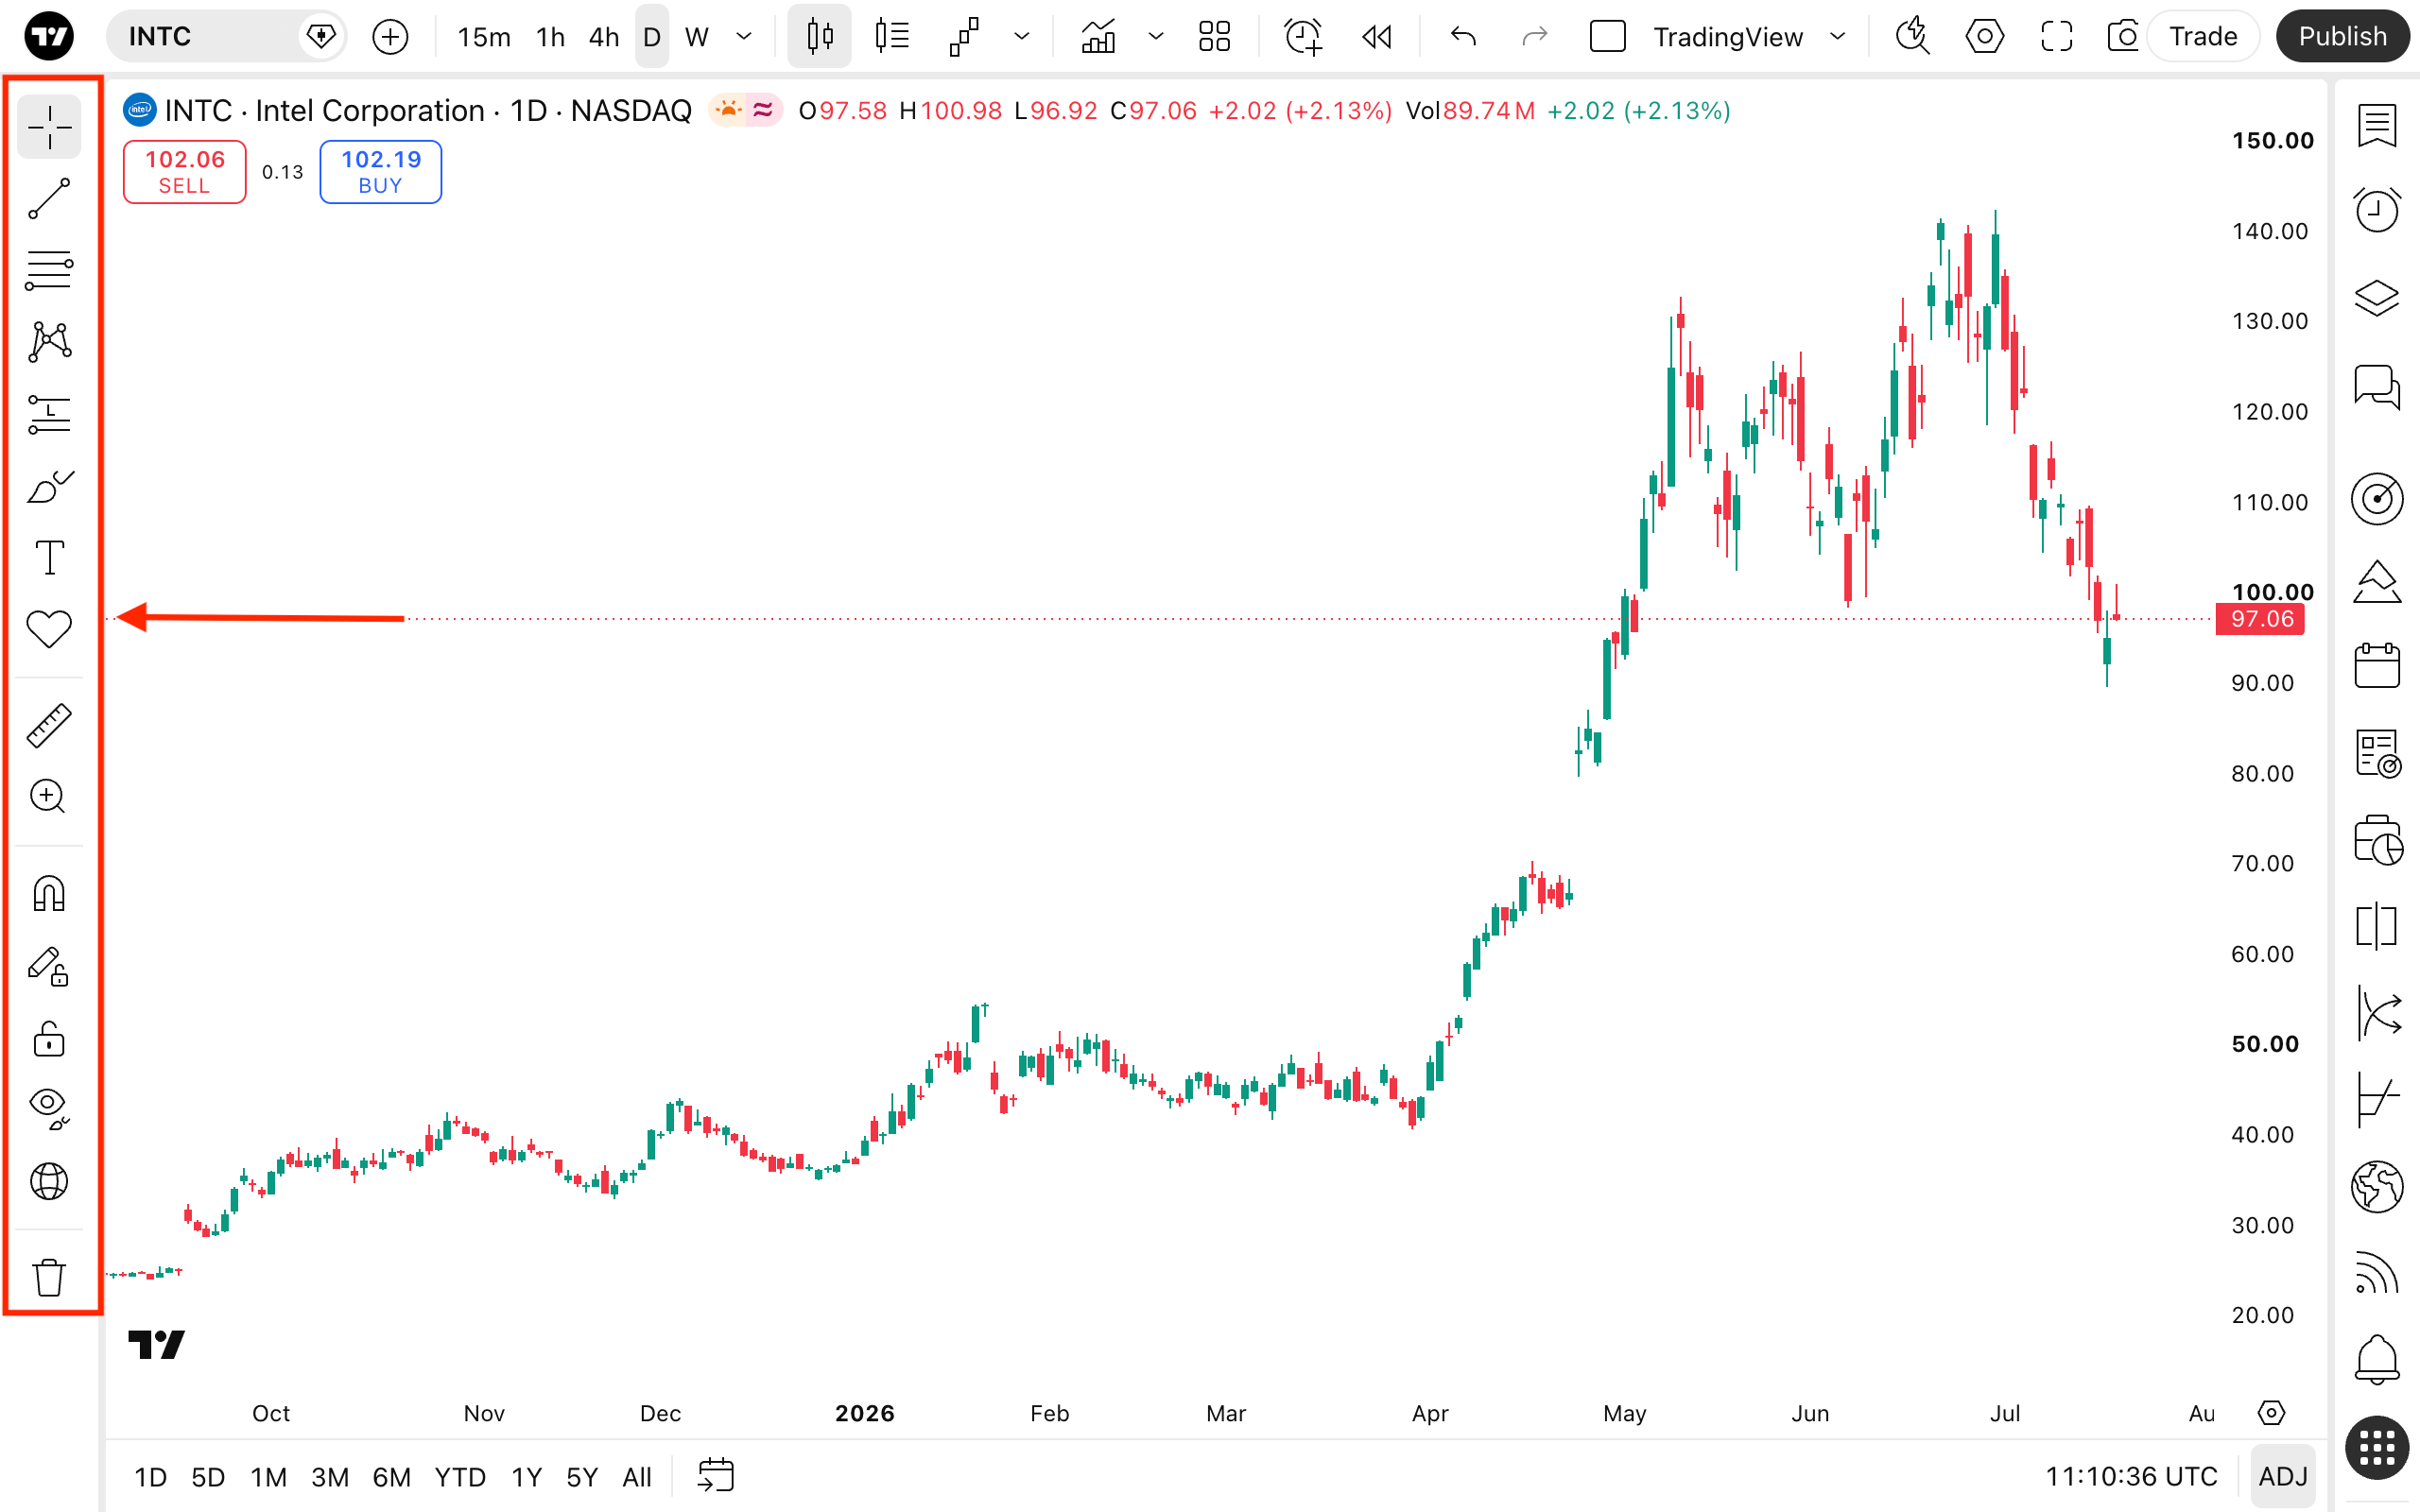
Each icon here represents a particular drawings category:
- Cursors: Choose the cursor type that will help you better navigate your charts.
- Trend tools: Select lines, channels, or pitchforks to mark movement directions and price levels.
- Gann and Fibonacci tools: Automatically build levels based on Fibonacci formulas and Gann theory. Adjust the number of levels and coefficients as needed.
- Patterns: Access Elliott waves to mark highs, lows, distances between them and identify market cycles.
- Forecasting and measurement tools: Gauge chart distances, predict price movement, and evaluate trading positions.
- Geometric shapes: Use brushes, arrows, and other classic shapes like rectangles and curves.
- Annotation tools: Add text notes directly to the chart, making technical analysis clearer.
- Icons: Add emojis and stickers. Switch between groups using the tabs at the bottom of the menu.
- Measure: Gauge the distance between bars.
- Zoom in: See closer the selected area.
- Magnets: Stick drawings to the nearest open, high, low, or close prices.
- Keep drawing: Add multiple objects to the chart consecutively.
- Lock all drawings: Prevent their accidental movement.
- Hide options: Hide drawings, indicators, positions and orders, or all of them.
- Sync drawings options: Mirror the drawings from the initial layout to additional layouts.
- Remove options: Delete drawings, indicators, or both.
To learn how to use each of them, explore our article on drawing tools available on TradingView.
The right toolbar
Here you can access watchlists, news, alerts, and other products in the Overlay sheet via the Products menu at the bottom.
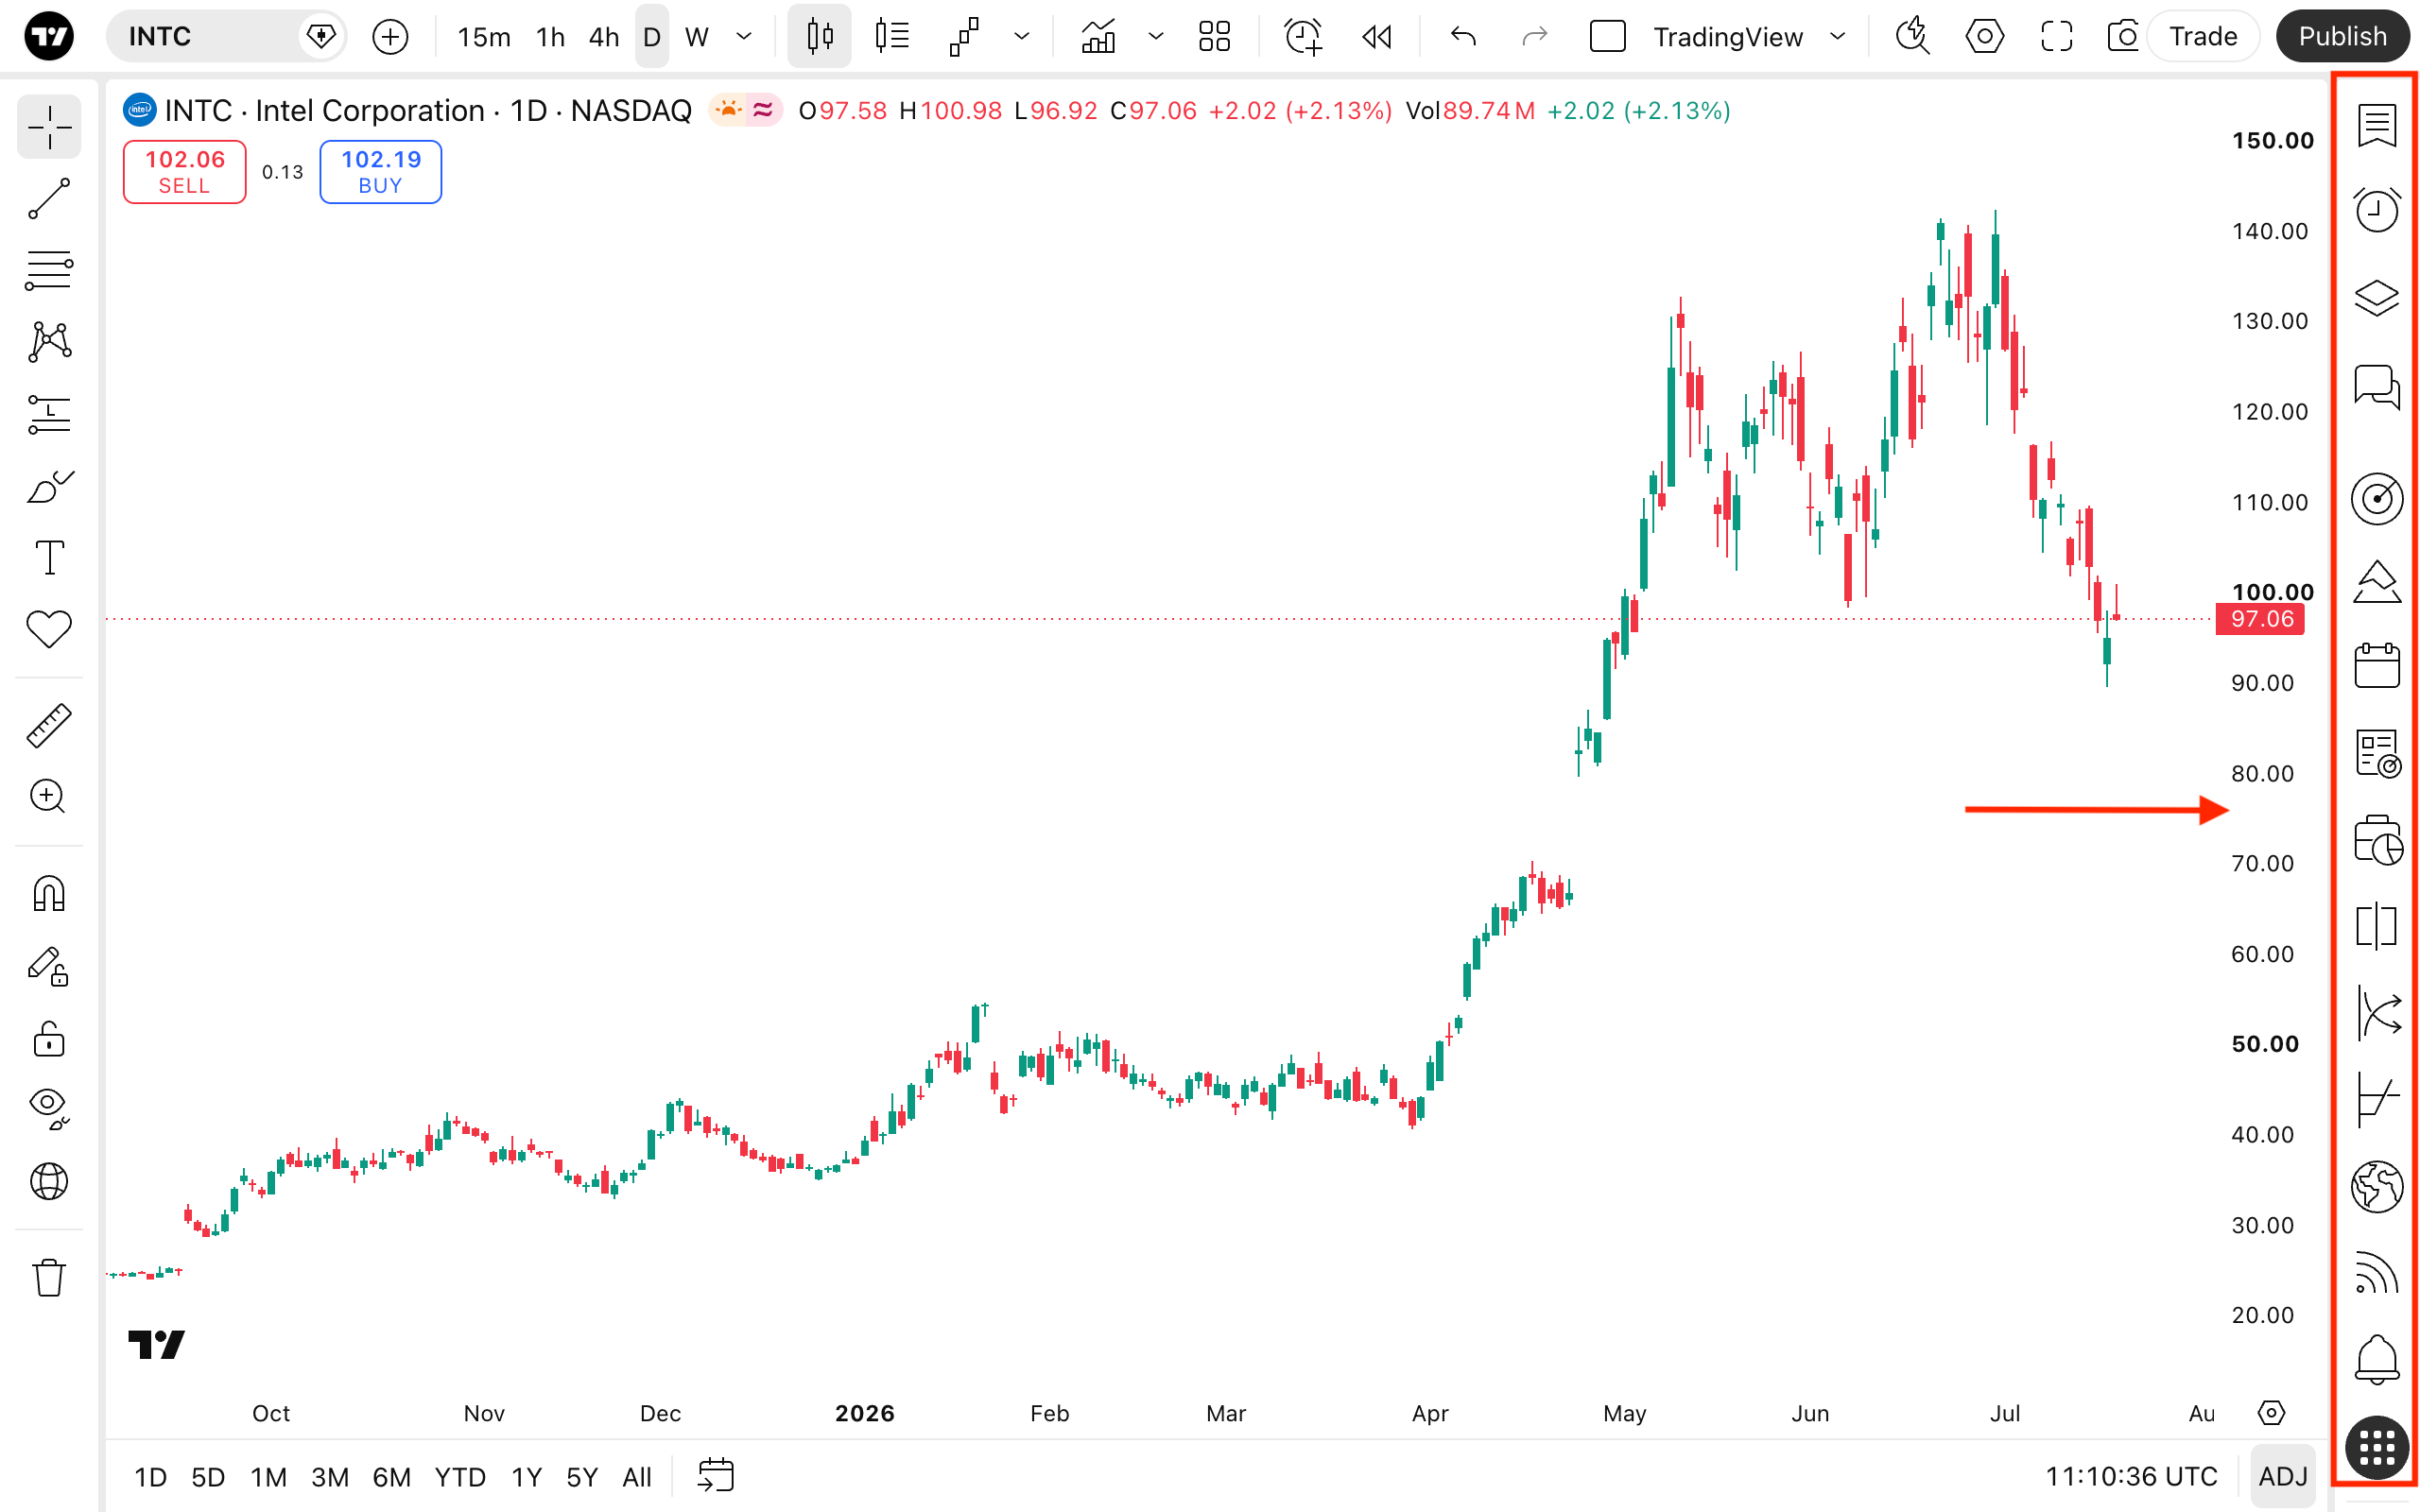
Starting from the top, you can access:
- Watchlist, details, and news: Track symbols, check their financial and technical data, and explore the latest news. Create or import new lists, navigate through existing ones, and manage them efficiently. Here you can also set watchlist alerts.
- Alerts: Manage your price alerts and technical alerts.
- Object tree and data window: Manage drawings or indicators that you've applied to the chart.
- Screeners: Open and switch between TradingView screeners to browse markets without leaving your chart.
- Pine Editor: Create custom indicators using Pine Script®.®®
- Calendars: Track the most important economic events and companies' activity.
- News Flow: Explore later news and see what's moving the markets.
- Portfolio: Track your investments performance against benchmarks and assess your risk-profile.
- Fundamental Graphs: Access stock and crypto fundamental metrics.
- Yield Curves: Explore bond rated and find the best fixed-income assets.
- Options: Financial instruments for both speculative trading and hedging.
- Macro Maps: See worldwide trends with economic indicators from around the globe.
- Community feed: Access Minds, ideas, and community indicators and see what's popular right now.
- Notifications: Check TradingView social network for your comments, mentions, and other activities.
- Help Center: Reach for the information about TradingView products, charts, indicators, and subscriptions.
The bottom panel
Here, you can switch between intervals, set the timezone, and customize the price scale.
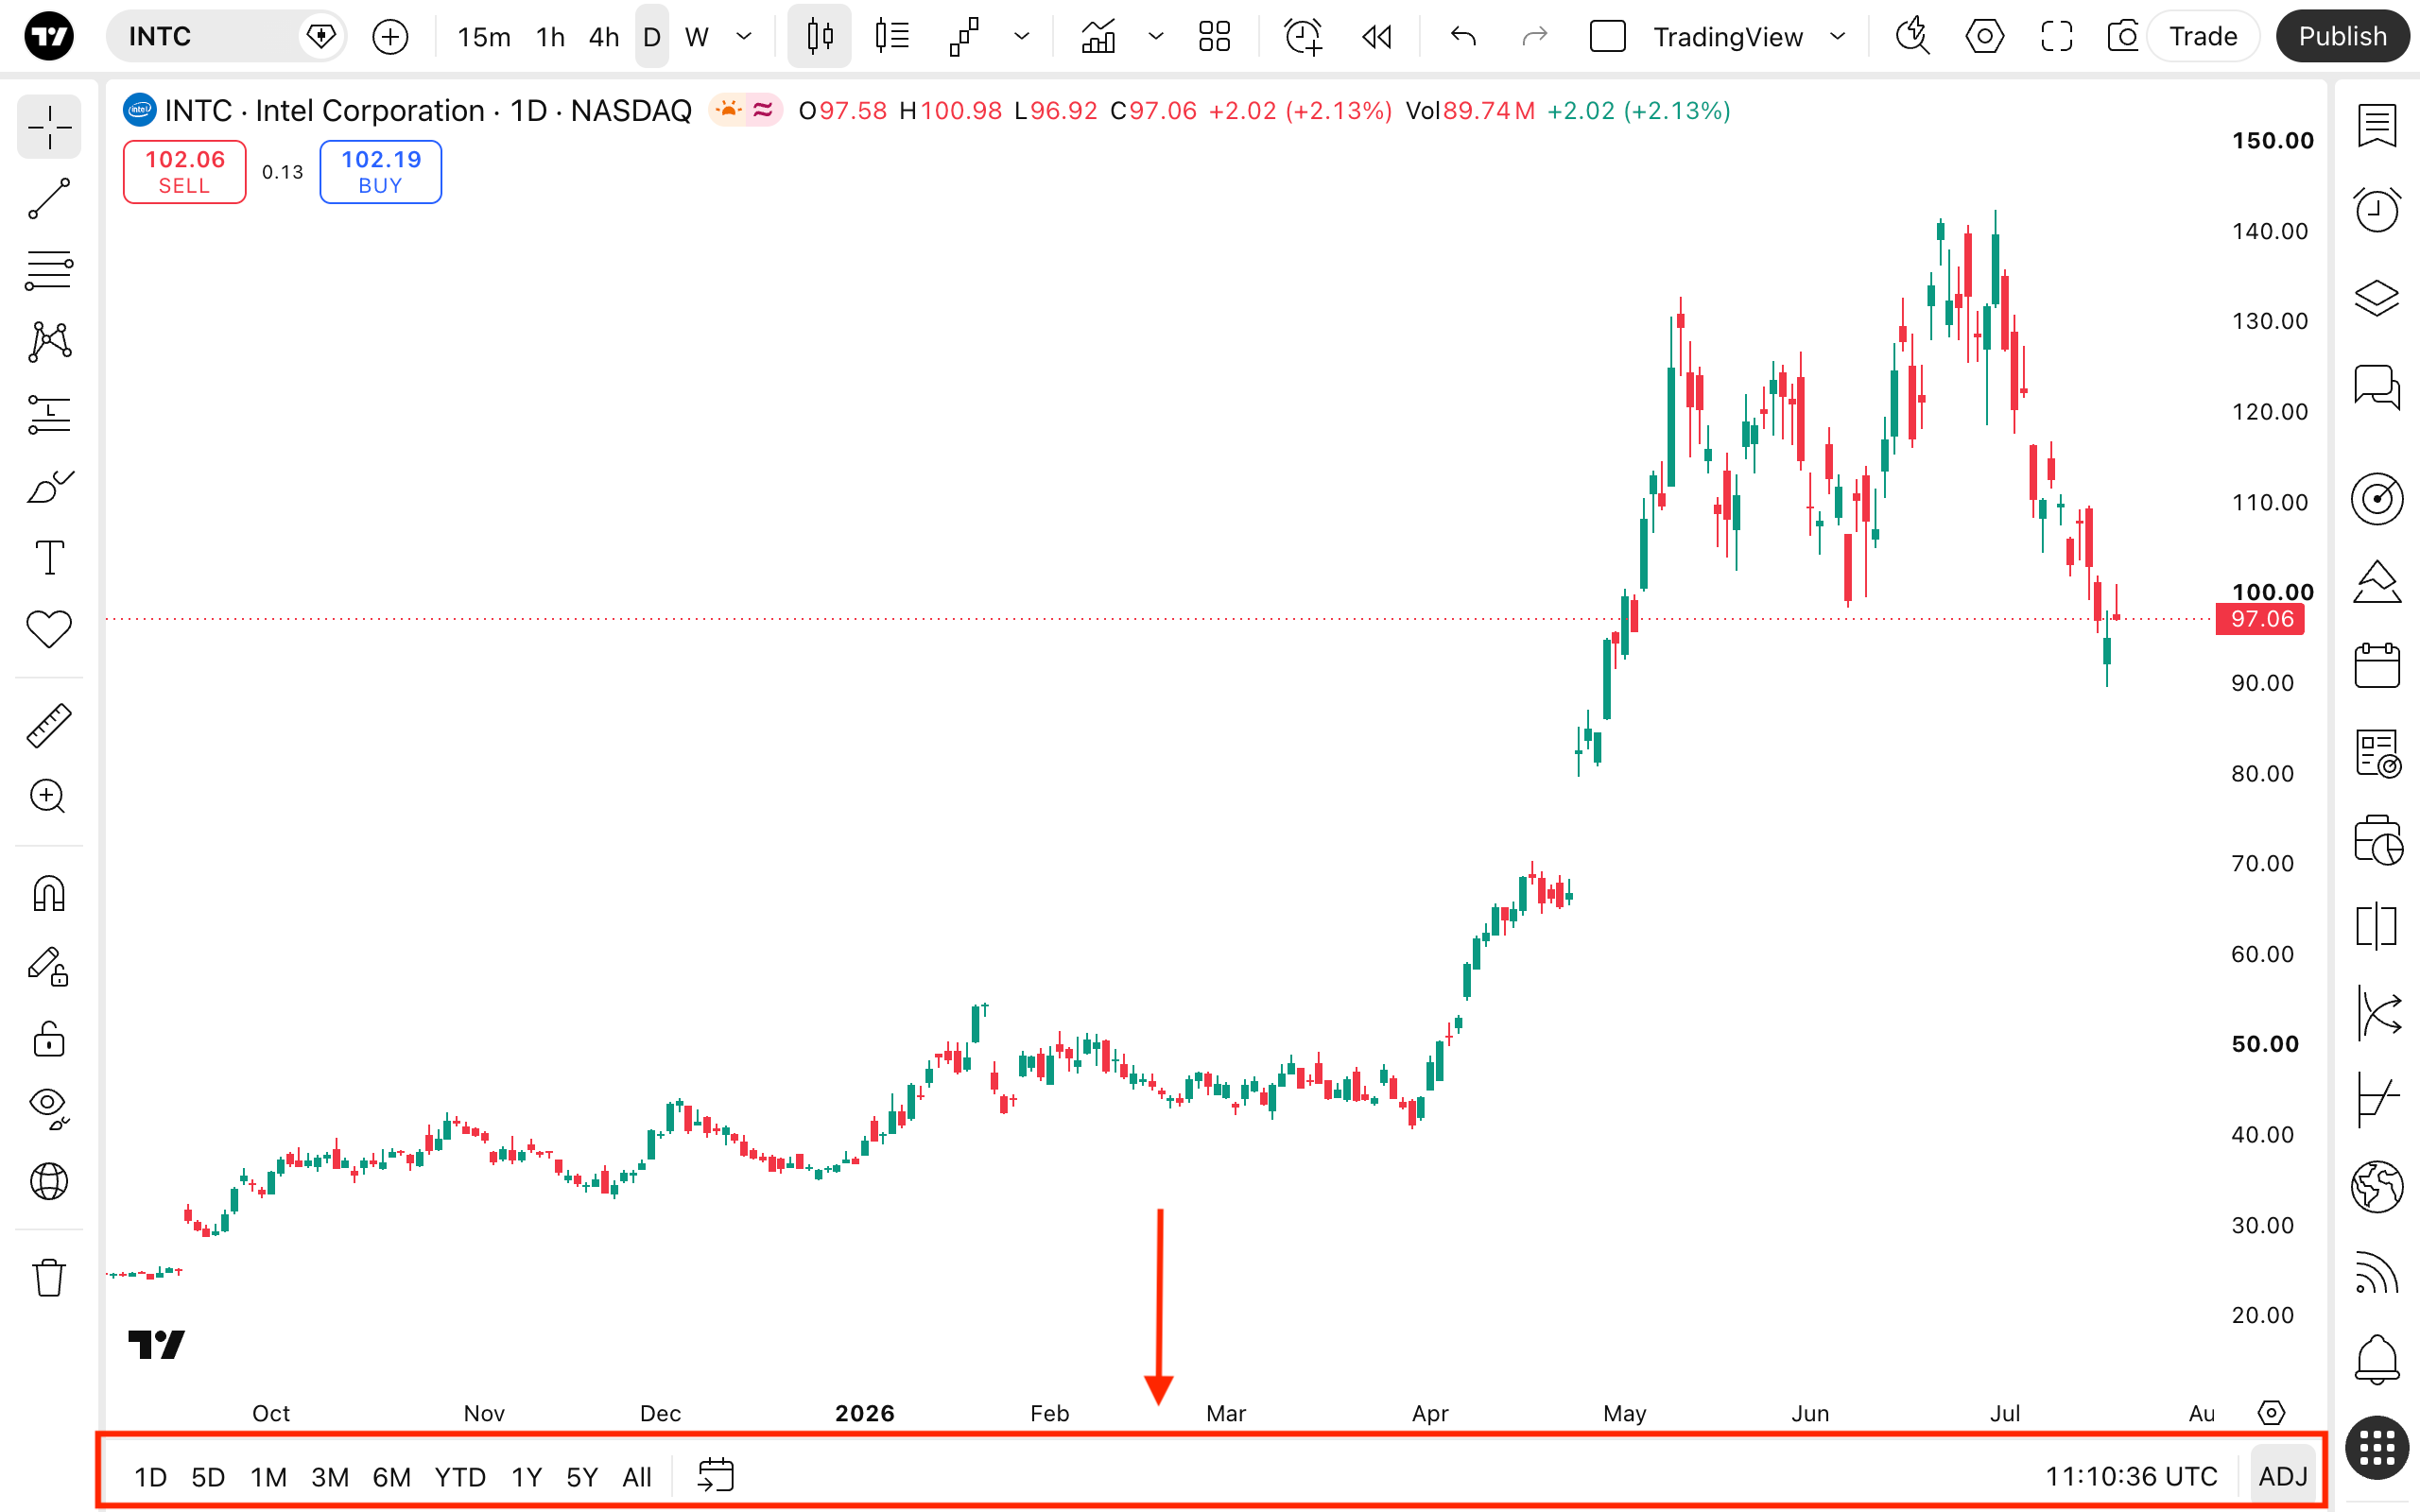
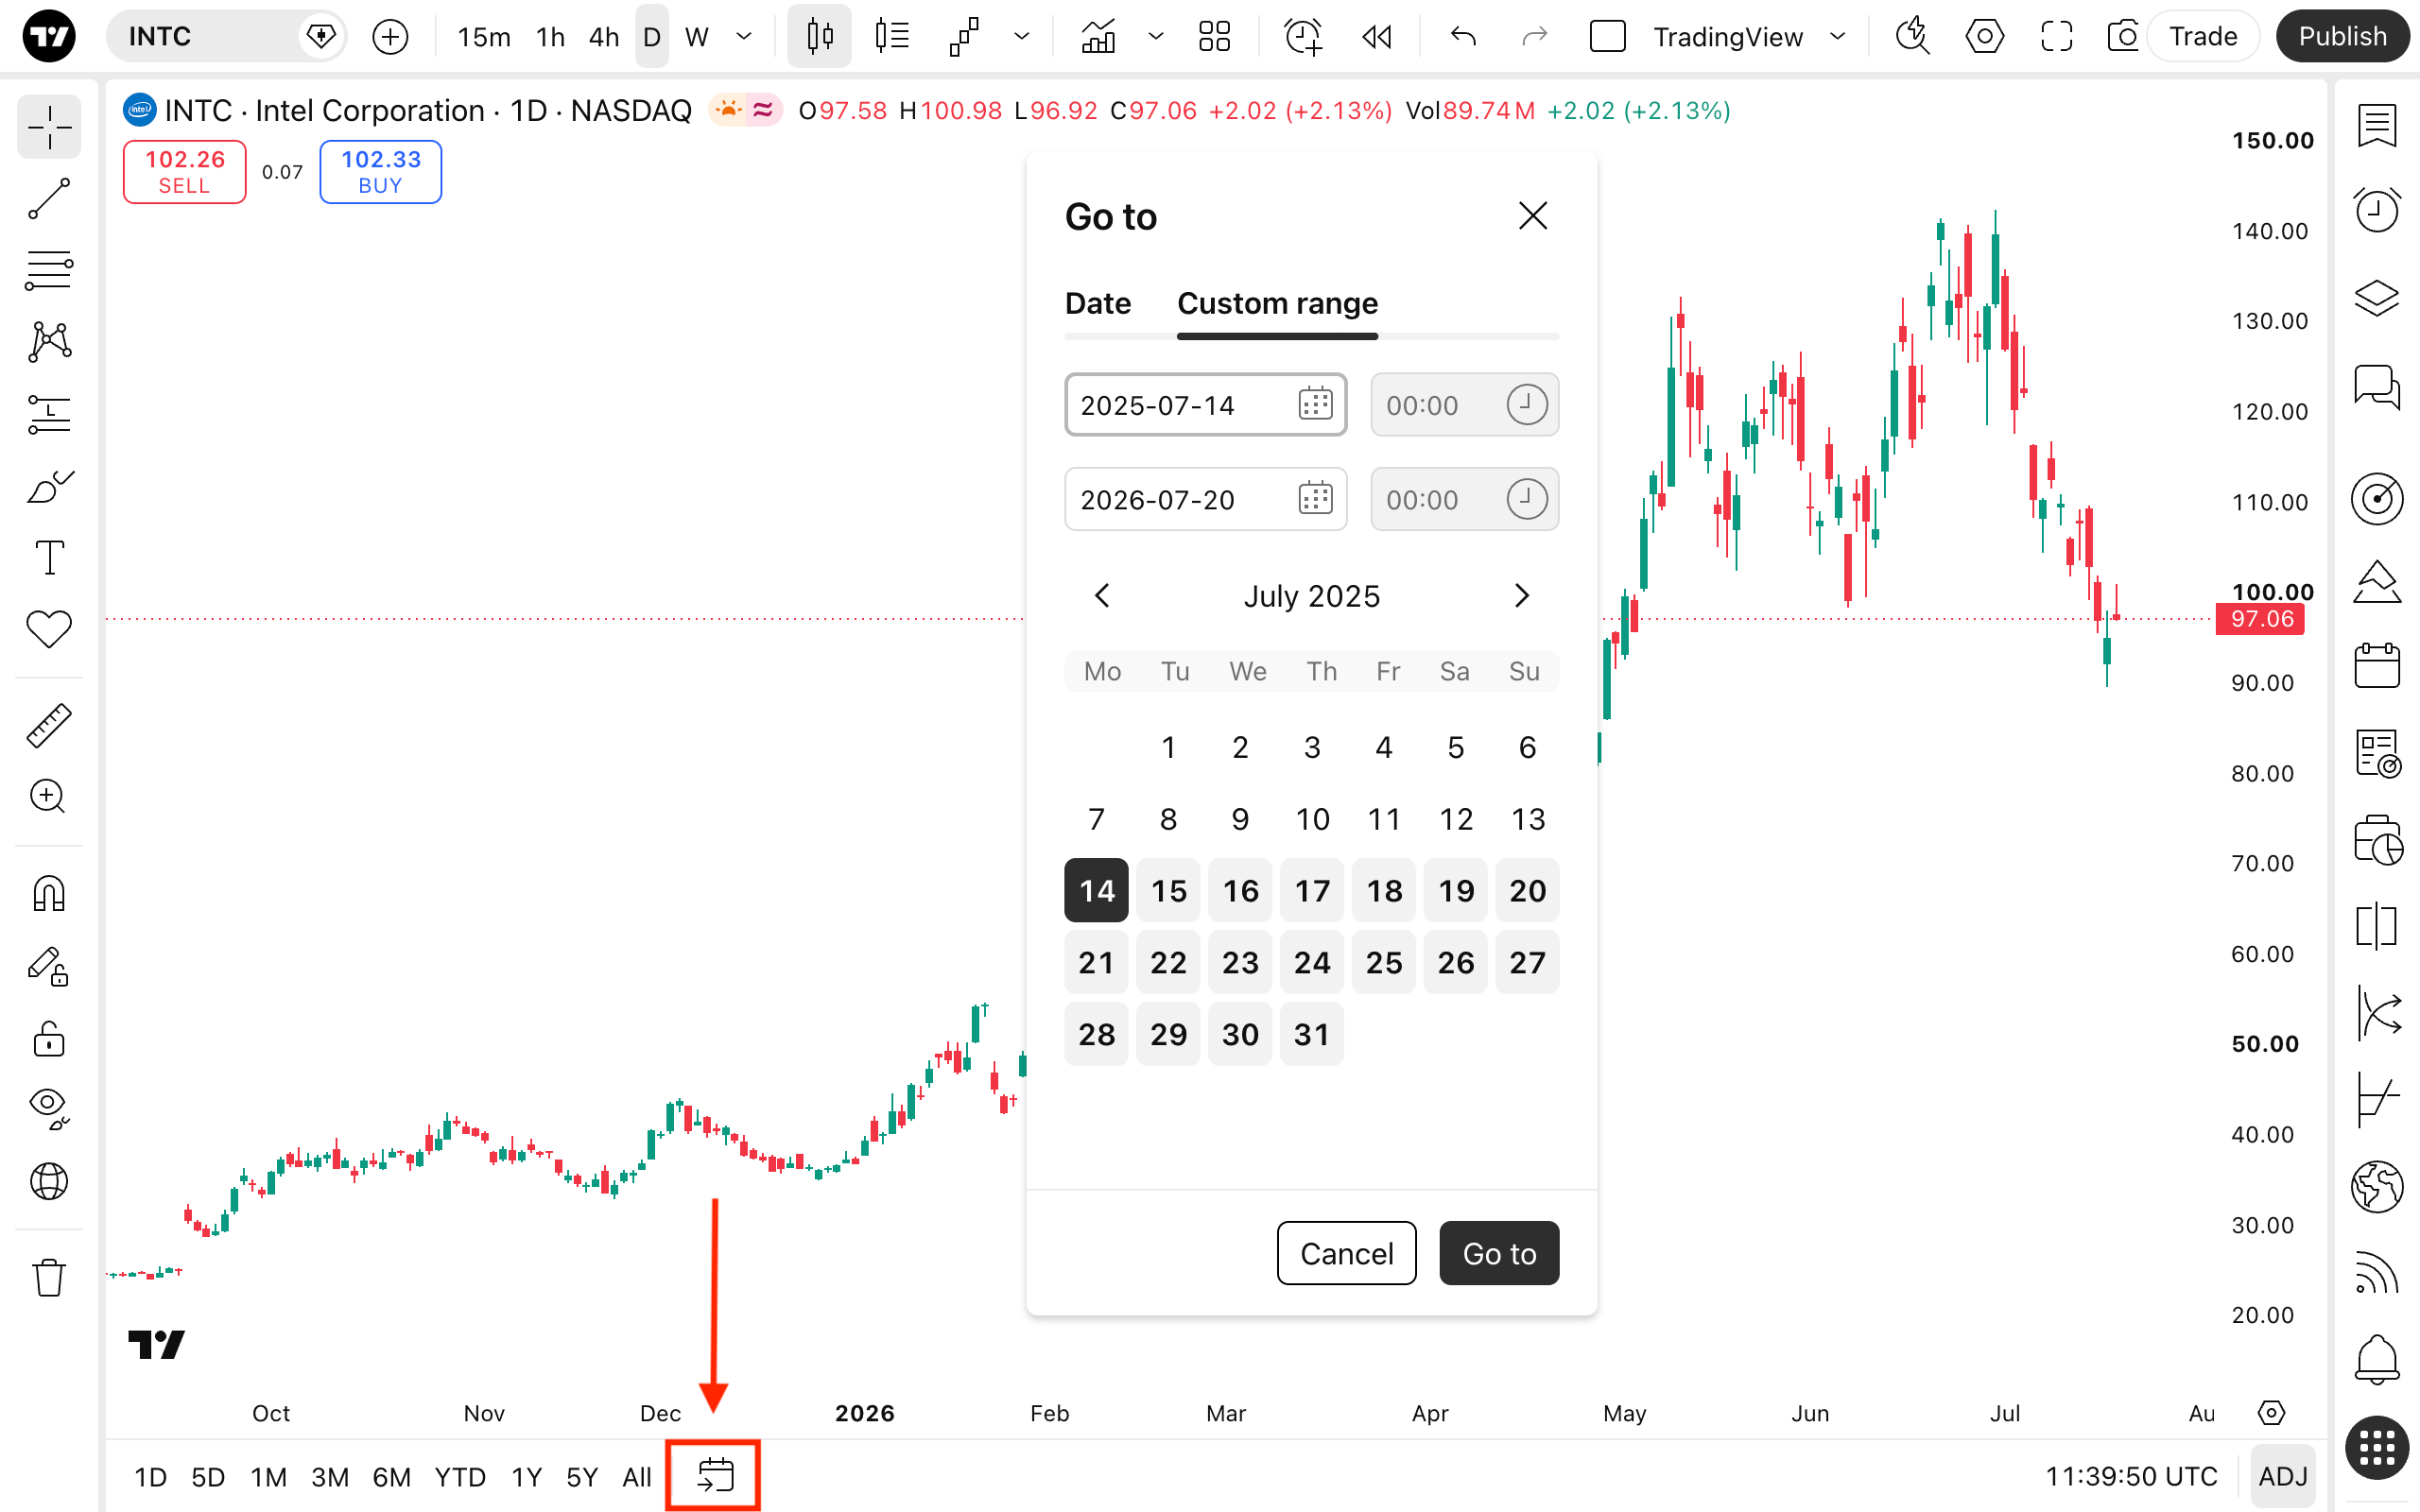
Under the time scale, you can find the preset intervals to fit your screen. Selecting 1D, for example, adjusts the chart to display one trading day using one-minute intervals. Pressing "All" displays all available historical data using monthly intervals. If none of the intervals suit you, you can go to a specific date or create a custom range in the "Go to" menu.
In Timezone settings to the right, you can choose which time is displayed on the chart. To match the time to the relevant trading exchange, select "Exchange."
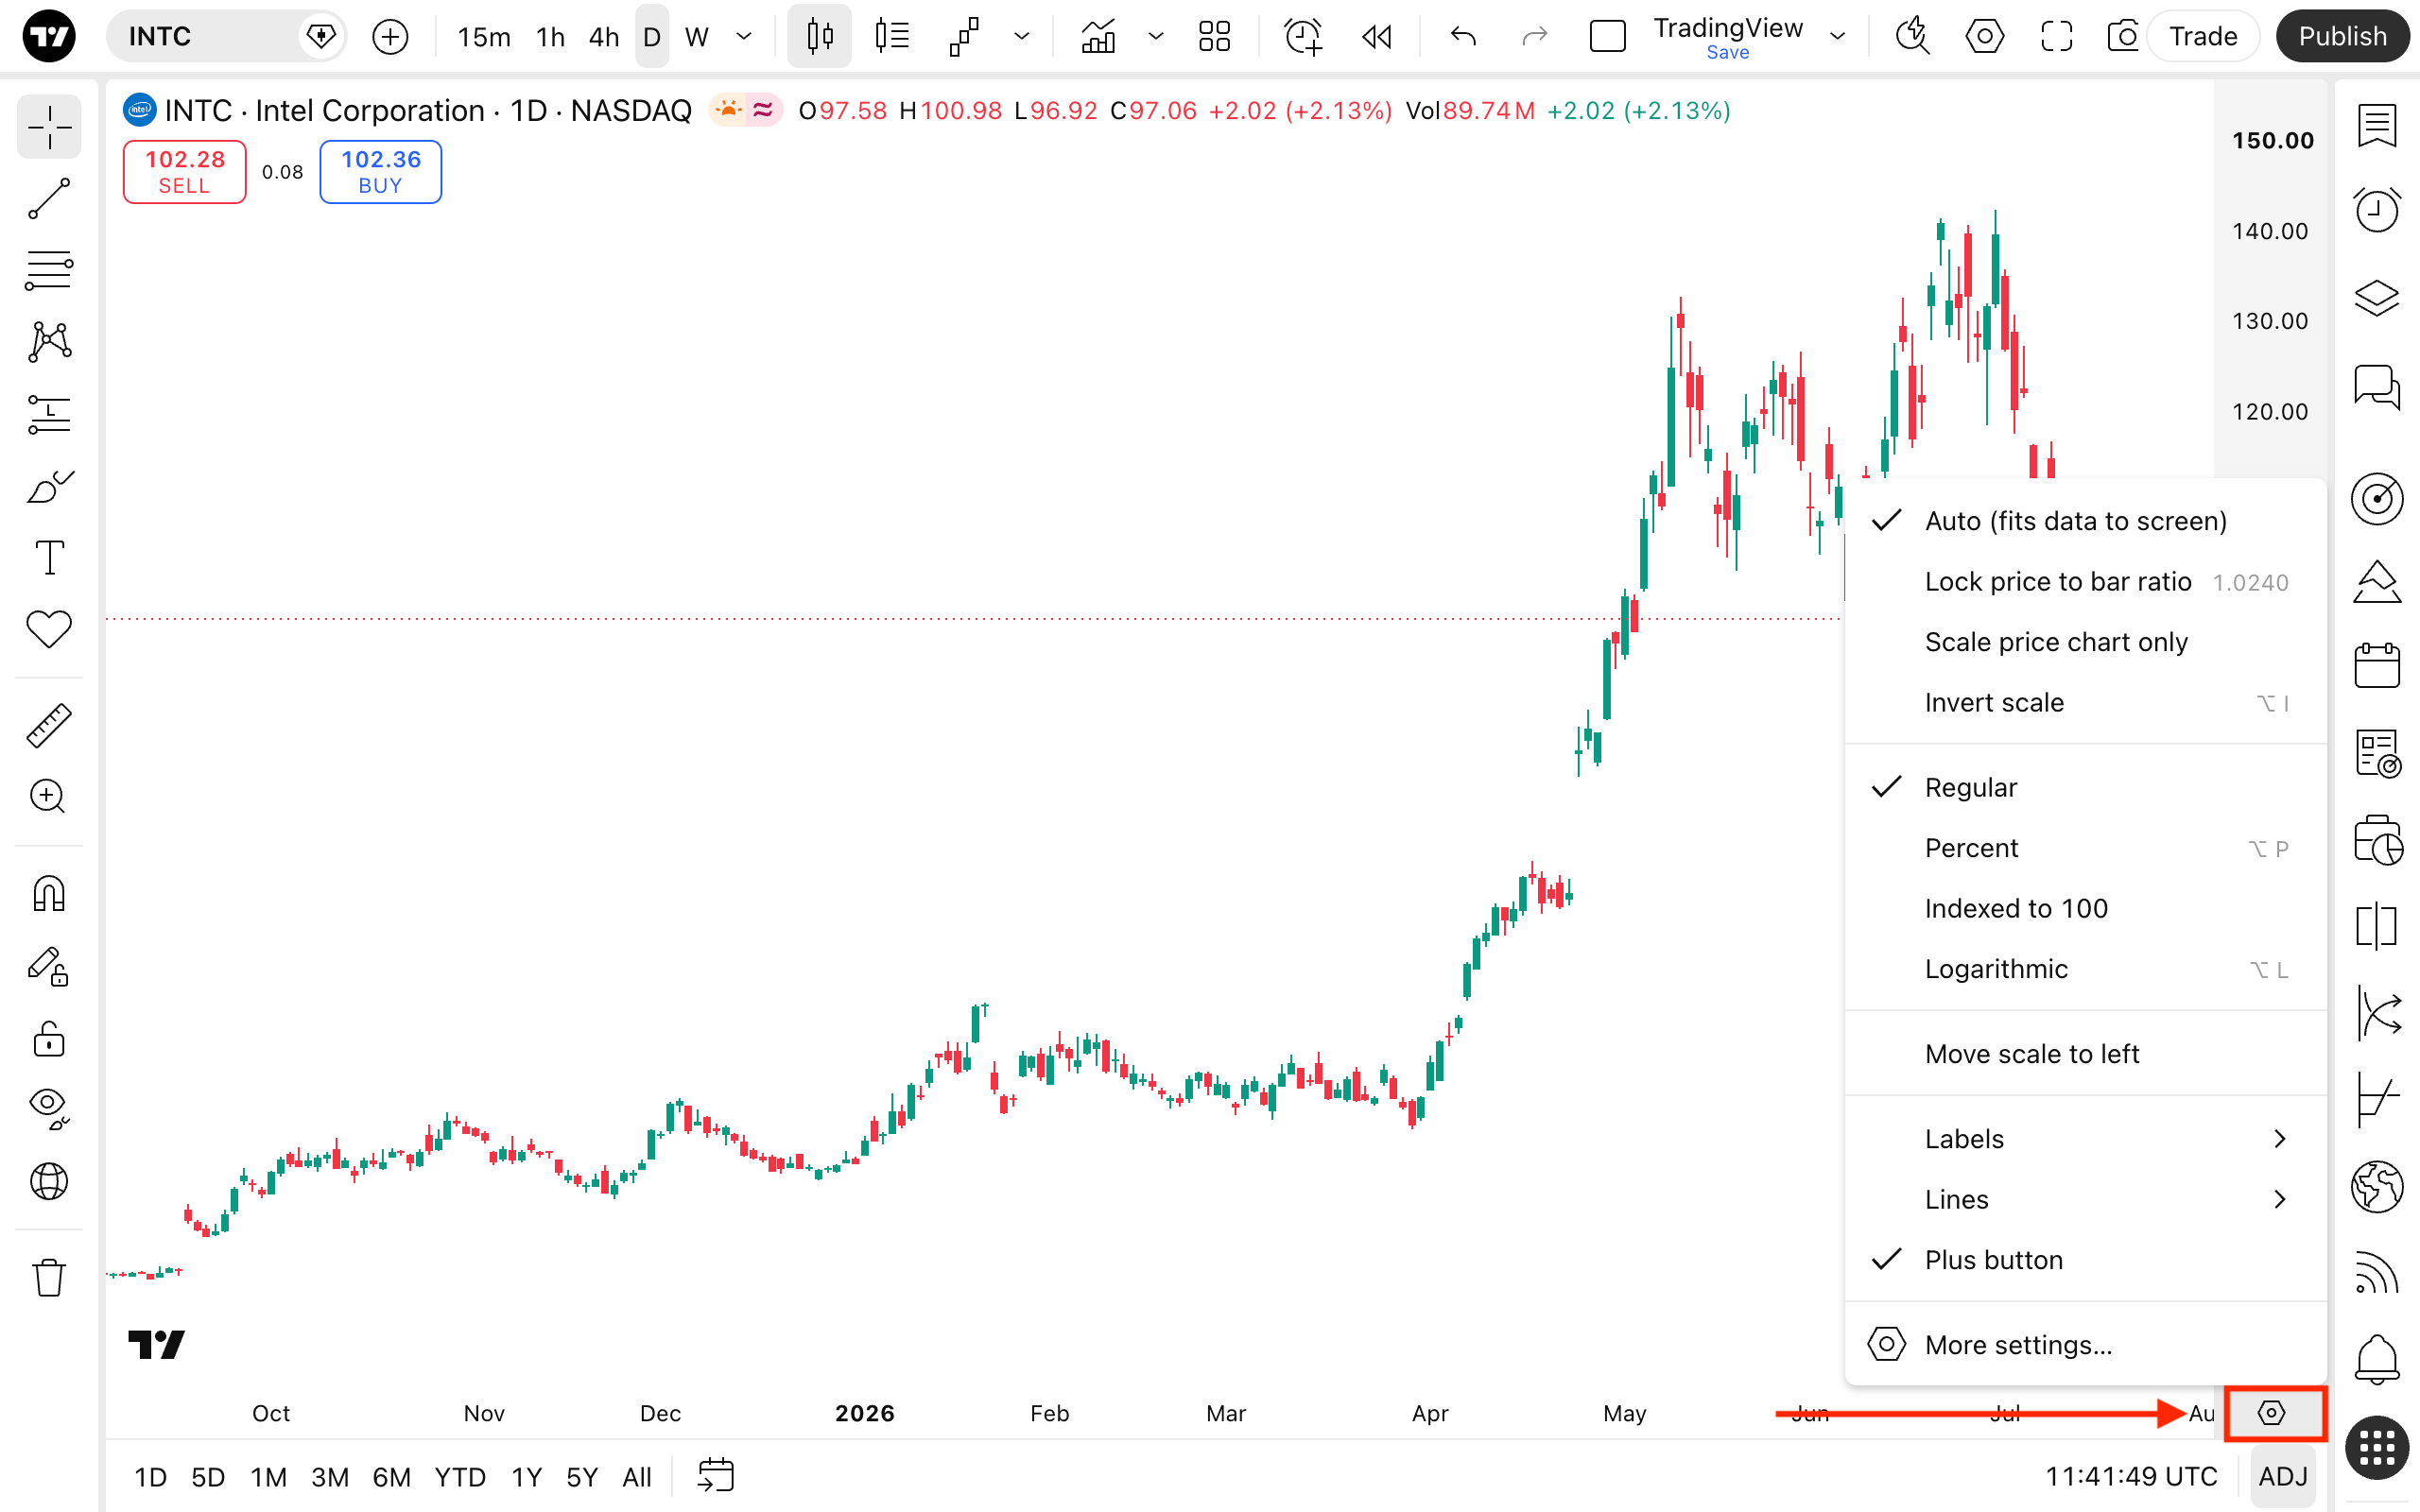
You will also find the gear button near the timezone setting. It opens the price scale settings, where you can set its mode, select what labels to display, and more.
Also read: