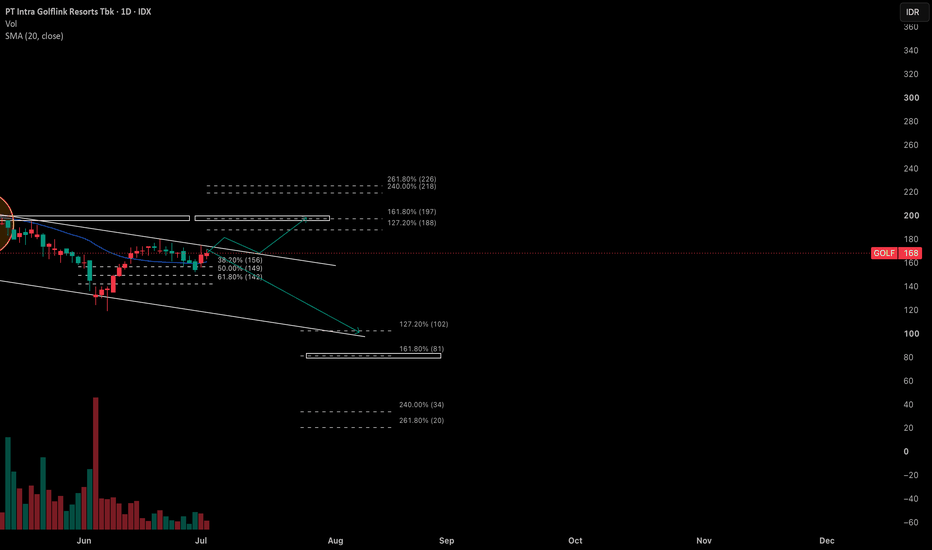
$GOLF: The Stock That's Worth to HighlightIDX:GOLF is worth to highlight among Indonesian stocks. It's potential to break the channel, and strengthen the reversal thesis.
I propose 2 thesis that might happen:
1. Reversal case:
If GOLF breaks the channel with high volume, the price will potentially go to IDR197. It's also a super resistance that has been a place of numerous pullbacks, rejections and bounches. Strategy: Buy on Breakout, Entry on Pullback
2. Trend Continuation case:
If the the price rejects at the resistance (which I am kinda sure because this rally is not along with adequate volume), the price potentially drops to the support or even lower at IDR81 (Fibonacci 161.8%)
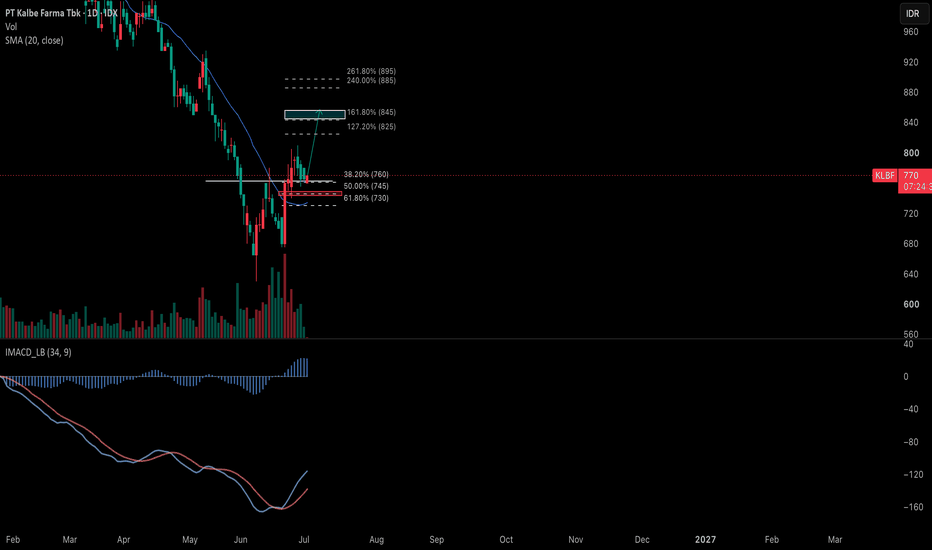
A Reversal Signal from KLBF?IDX:KLBF is showing a potential reversal from a long bearish trend after failing to form a new lower low.
The bearish trend formed in the middle of 2025, and it hasn't turned positive since. However, in the current stage, I saw a double bottom formed with a neck on IDR 760, implying a potential reversal trend. Currently, the price is testing the new support created from the neck. I believe this is a reliable support since it's on Fibonacci 38.20% as well. This reversal is also supported by momentum from MACD's Golden Cross, and the price has broken the MA20 dynamic resistance. If this circumstance continues, the price potentially rises to the Fibonacci target and the Double Bottom target (Green box).
Trading Strategy:
Buy: 770-780 after pullback rebound
TP: 845-855 | 9.7% - 11% (Green Box)
SL: 745 | -3.2% (Red Box)
Note: re-entry if it rebounds the Fibonacci 50% and 61.8%
A Very Very Very Long Waiting for GJTLIDX:GJTL is at its moment of determination in the weekly timeframe.
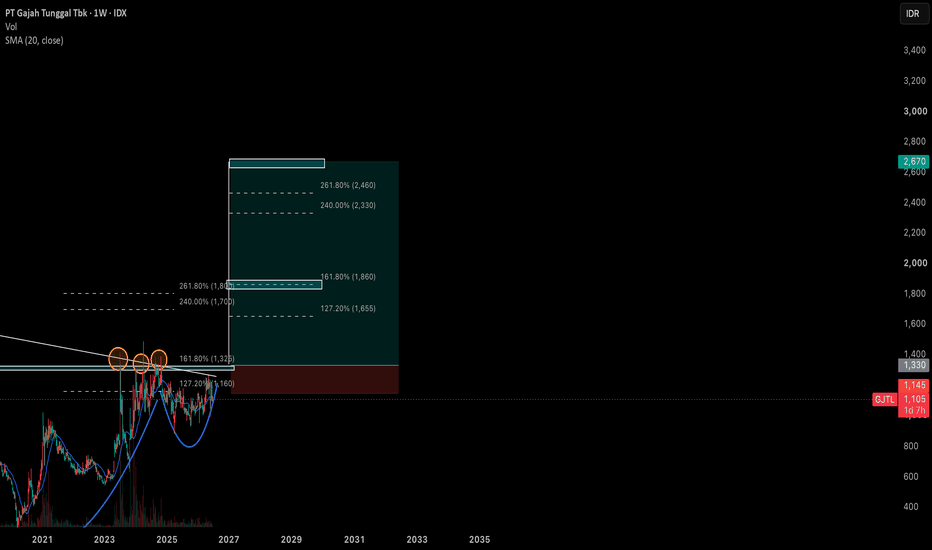
The huge inverted head-and-shoulders of GJTL that has been forming since 2014, more than 10 years of waiting, is about to break. Nevertheless, I argue that it won't be an easy path. The Fibonacci 161.8% from the head part has been a super solid demand and supply area. The orange circles are proof that this zone is extremely hard to break. It also undergoes the IHnS neck, which is placed close to the 161.8% area. This ticker will require a tungsten mentality to wait.
Trading Strategy:
Buy: Wait for a pullback if it breaks IDR 1325. Please be prepared to buy these shares in installments slowly.
TP1: IDR 1860 (New Fibonacci 161.8%)
TP 2: IDR 2670 (IHnS target)
SL: <IDR 1100
BBRI Outlook: Bearish Structure Toward Major DemandBBRI remains under strong bearish pressure on the weekly timeframe. Price structure continues to form a series of lower highs and has broken several key support levels, indicating that sellers are still dominant. The current price is around 2,740 after failing to hold the previous support area, so the overall movement still has potential to continue toward the lower demand zone.|
In conclusion, BBRI’s bias remains bearish. A stronger recovery scenario will only become more valid if price starts forming a higher low and reclaims the previous breakdown area.
AMRT: Classic Regular Bullish Divergence at Major Support Zone Bullish Divergence: This is the core of the thesis. As highlighted by the white trendlines on the chart, the price action recently printed a clear Lower Low (LL), dipping aggressively to sweep liquidity. However, if we look down at the oscillator, it is simultaneously printing a Higher Low (HL). This classic bullish divergence signals that the selling pressure is rapidly drying up and a trend reversal is highly probable.
Key Support / Demand Zone: The recent price drop drove AMRT directly into a major historical support block (highlighted in purple). The price was immediately rejected from this lower boundary, leaving a long lower wick.
Capitulation Volume: Notice the massive volume spike on the candle that pierced the support zone. This extreme volume often indicates panic selling (capitulation) being aggressively absorbed by institutional buyers, creating a local bottom.
Disclaimer: Always manage your risk, use proper position sizing, and stick to your stop losses!
MOLI - VCPMOLI - VCP (3T 24/7 10W)
(+)
1. Low risk entry point on a pivot level with VCP characteristic
2. Price has been above the MA 50 for over 10 weeks, 150, 200
3. Price is within 25% of its 52-week high.
7. Breakout with huge volume
8. GMMA meet criteria
(-)
1. Early stage
2. MA50 under MA150 and MA200
3. Price has been above the MA 50 under 10 weeks
4. Price is over 25% of its 52-week low
5. The 200-day MA has not been trending upwards for over a month.
BBRI forecastingBased on my analysis, BBRI's current price movement is still in a downtrend. By applying the Elliott Wave cycle, I observe that the final wave has formed. This is also supported by Fibonacci analysis to identify potential price movements before entering a long position.
Going 'long' here is a speculative trade, not a long-term hold. It should be noted that a long entry must only be executed if it is supported by candlestick patterns such as a bullish engulfing, a star, or a hammer.
However, I have also mapped out a worst-case scenario in case the price continues its decline back to the levels seen during the COVID pandemic. Traders must remain vigilant if this worst-case scenario unfolds.
BBCA Weekly AnalysisCurrent Price: ±6,100
BBCA is currently still in a medium-term bearish structure.
The key 6,400–6,500 support zone has already broken down. This area previously acted as a major institutional demand zone and has now turned into resistance.
As long as price remains below this zone, market pressure is still considered bearish.
---
# Market Structure
* Lower highs continue to form
* Selling pressure remains dominant
* No strong bullish reclaim yet
The recent decline also pushed price below the 1.618 Fibonacci extension area around 6,275, showing that the market is entering an overshoot phase.
However:
> oversold does not automatically mean reversal.
---
# Key Levels
## Support
* 5,900 → nearest support
* 5,400 → stronger long-term accumulation zone
* 4,800 → deep value area
## Resistance
* 6,400–6,500 → major resistance
* 7,275 → structural reclaim level
* 8,250 → bullish recovery confirmation
---
# Valuation Perspective
Fundamentally, BBCA remains one of Indonesia’s strongest banks with:
* strong CASA,
* high ROE,
* and premium institutional ownership.
The correction is mainly the market repricing its previously expensive valuation.
At current levels, BBCA is becoming more attractive for long-term investors, although technically the chart is still weak.
---
# Conclusion
Technically:
* trend remains bearish,
* key support already failed,
* and recovery has not been confirmed.
For long-term investors:
the more rational approach is gradual accumulation, not aggressive all-in positioning.
BBRI Weekly Analysis UpdateCurrent Price: ±3,120
Average Buy Position: 3,660
Focus of this analysis:
* support identification,
* Fibonacci structure,
* and the symmetrical triangle breakdown.
---
# Market Structure
BBRI remains under medium-term bearish pressure.
From the updated chart:
* the symmetrical triangle has already broken down,
* key horizontal support failed to hold,
* and price is now trading below my average buy position at 3,660.
The 3,660 area has now turned into:
* a psychological resistance,
* a supply zone,
* and a trapped buyer area.
As long as price stays below this level on a weekly closing basis, the market structure is still considered weak.
---
# Fibonacci Structure
Using the major swing:
* Low: 2,110
* High: 6,450
Key Fibonacci levels:
* 0.5 → 4,280
* 0.618 → 3,760
* 0.786 → 3,160
* 1.0 → 2,110
Current price has already broken below the 0.786 retracement level, which is often considered the final support zone before a medium-term bullish structure weakens significantly.
This suggests the market is entering a:
> distribution and valuation repricing phase.
---
# Symmetrical Triangle Breakdown
The previous structure formed:
* consistent lower highs,
* while buyers defended horizontal support,
* until the support finally broke.
Technically, a symmetrical triangle after a downtrend tends to act as a bearish continuation pattern.
That is currently what BBRI is showing.
---
# Key Support Areas
## Support 1 — 3,040
Nearest support zone.
Potential:
* short-term technical bounce,
* temporary reaction area.
However, if weekly closes remain below this level, downside risk increases further.
---
## Support 2 — 2,700
This is the first area that starts to look attractive for:
* long-term accumulation,
* gradual scaling,
* and investment positioning.
Why?
Because this area aligns with:
* historical support,
* Fibonacci extension confluence,
* and increasingly discounted valuation levels.
---
## Support 3 — 2,160
This is considered a deep value zone.
Such levels usually appear during:
* panic selling,
* major foreign outflows,
* or broader market risk-off conditions.
Ironically, these are often the zones where long-term institutional accumulation begins.
---
# Valuation Perspective
Fundamentally, BBRI is starting to look relatively cheap.
Current estimates:
* PER around 7–9x,
* PBV around 1.4–1.6x,
* both below historical averages.
Most analyst target prices still range around:
* 4,400–4,900.
This means the market is already pricing in a significant amount of fear and pessimism.
---
# Conclusion
Technically:
* the trend remains bearish,
* the triangle pattern has broken down,
* and key support levels have failed.
However, from a valuation perspective:
BBRI is gradually entering a more attractive zone for long-term investors.
The more rational approach right now is:
* avoid aggressive all-in buying,
* scale in gradually,
* and wait for structural reclaim confirmation for safer positioning.
As long as price remains below 3,660:
the market is still considered under pressure, and a full recovery has not yet been confirmed.
Applying technical analysis in multiple time frames: $TAPGM TF:
• Structure: a series of HH and HL – Uptrend
• MA:
- Price far > 18MA & 40MA – bullish location
- 18MA > 40MA and both are rising with wide separation – strong bullish trend
• MACD: > 0 line and MACD line is far > S line – strong bullish momentum
• Conclusion: Structure is uptrend and supported by strong bullish trend and momentum. Go to W TF for opportunity to go long
W TF:
• Structure: a series of HH and HL – Uptrend. However, there is reversal bar pattern at the top with huge volume.
• MA:
- Price > 18MA & 40MA – bullish location
- 18MA > 40MA and 18MA is separated from 40MA and both are rising and – bullish trend
• MACD: > 0 line and MACD line is far > S line – bullish momentum. However, the value dropped from 122 to 117; this is minor. MACD is still far above 0. This is a normal loss of momentum after a strong rally.
• Conclusion: Structure is uptrend and supported by bullish trend and momentum. Reversal bar pattern at the top is a warning. Go to D TF to see if this warning is confirmed (further weakness) or invalidated (price holds and recovers)
D TF:
• Structure: From ATH at 2300, price has dropped to 1850 – pullback. Price has broken the uptrend line but has not made a Lower Low (LL). The uptrend structure (HH/HL) is still intact. This is a sign of weakening momentum, not a confirmed reversal. A break below the last HL would create a bear alert. Until then, the uptrend structure remains intact
• MA: location is bearish with weakening bullish trend – a sign of in transition
- Price is below 18MA & 40MA – bearish location
- 18MA > 40MA but 18MA start to flatten (short term: start to weaken) but 40MA is still rising (long term: bullish) – a sign is weakening bullish structure
• MACD: > 0 line – bullish momentum but MACD has made DC and drifted toward 0 – weakening bullish momentum
• Conclusion: From ATH, structure is in pullback with weakening bullish momentum and MA shows in transition area. Warning since price has broken its uptrend line. Go to 1H TF for detail of the pullback
1H TF:
• Structure: D pullback is in presumptive downtrend.
• MA:
- Price is far below 18MA & 40MA – bearish location
- 18MA < 40MA and both are falling with wide separation – bearish trend
• MACD: < 0 line – bearish momentum and MACD line is far < S line – bearish momentum
• Conclusion: 1H structure is presumptive downtrend, but indicators already give bearish signal. No trade until 1H shows a Change in Trend — break of downtrend line, Higher Low (HL), and MACD confirmation.
Observation:
1. Monthly is bullish.
2. Weekly is bullish; warning – reversal bar pattern at the top
3. Daily is in a pullback with weakening momentum, but the uptrend is still intact; warning – price broke its uptrend line.
4. 1H is in a presumptive downtrend.
Overall conclusion: No trade. Wait until 1H shows a Change in Trend — break of downtrend line, Higher Low (HL), and MACD confirmation before acting
ANTM – Symmetrical Triangle Setup (1D Timeframe)ANTM is currently forming a compression structure between a descending resistance (red trendline) and an ascending support (green trendline), indicating a potential symmetrical triangle pattern.
Price is now approaching the apex zone, which typically leads to a breakout move.
🔍 Key Observations:
Lower highs → bearish pressure from sellers
Higher lows → buyers still defending support
Price hovering around key horizontal level (~3,600–3,700)
Volatility is decreasing → breakout incoming
📈 Bullish Scenario:
Break and close above 4,100 – 4,200
Confirmation with strong bullish candle & volume
Potential targets: 4,400 → 4,700
📉 Bearish Scenario:
Breakdown below 3,600 support
Opens downside toward 3,300 → 3,000 area
⚠️ Strategy:
Wait for clear breakout + retest confirmation
Avoid entering inside the triangle (fakeout risk is high)
Use tight risk management
💡 Conclusion: ANTM is in a decision phase. A breakout from this structure will likely determine the next major trend direction.
AADI - CUP WITH HANDLEIDX:AADI - CUP WITH HANDLE
1. Low risk entry point on a pivot level with VCP characteristic
2. Price has been above the MA 50 for over 10 weeks, MA50 > 150 > 200
3. Price is within 25% of its 52-week high.
4. Price is over 25% of its 52-week low if breakout
5. The 200-day MA has been trending upwards for over a month.
6. Showing strong relative strenght
7. Breakout with significant volume
8. GMMA meet criteria, the shorterm trend is looking good but the longterm is showing peak
(-)
1. There is a gap in 10450, I am not a big fan of the gap. But this stock has a history of not closing the gap.
FLMC - DTMIDX:FLMC - DTM
(+)
1. Low risk entry point on a pivot level with VCP characteristic
2. Price has been above the MA 50 for over 10 weeks, MA50 > 150 > 200
3. Price is within 25% of its 52-week high.
4. Price is over 25% of its 52-week low if breakout
5. The 200-day MA has been trending upwards for over a month.
6. Showing strong relative strenght
7. Breakout with huge volume
8. GMMA meet criteria
(-)
1. Early stage
BBRI.JK WILL END IT'S CORRECTION SOON?Based on Elliot Wave perspective, it's showing potential ending of correction, the 5th wave of C of ABC correction could be ended around this level, which is happened to be 78.6% fibo level as well.
I suggest to enter 50% of trading size now and wait for bullish confirmation/ rejection candle on daily to enter another 50%. The upward movement can be very sweet, i don't aim for 20-30%, it's 50% potential gain trade!
GOOD LUCK and CHEEERSS!!
IDX: BREN Trading Ideas [1D][1M] (Disc On)Several issuers in the High Shareholding Concentration (HSC) category are currently being monitored by the IDX. Meanwhile, MSCI is reviewing Indonesian issuers as part of its periodic assessment. As supporting factors, brokers recorded net buy positions, providing support to the technical aspects of the market.
BBCA WEEKLY OUTLOOKAs a bank, BBCA IJ is an outstanding company. Customers genuinely enjoy its products and appreciate the quality of its services. This private institution has consistently delivered value to its investors.
⚠️DISCLAIMER ON⚠️
However, from a technical perspective, there is a risk of a deeper correction despite the company’s strong fundamentals. The chart shows that BBCA IJ has reached one of its strongest support zones at Rp6,075–Rp6,000. If a meaningful rejection forms in this area, the stock could potentially transition back into a bullish trend.
On the other hand, if BBCA IJ breaks below this support, the price may decline further toward the next major support zone at Rp4,530–Rp4,440. Isn't it terrifying for us, Investors? Of course. But this is a long-term outlook that may only materialize around 2027. Let’s see. 😉