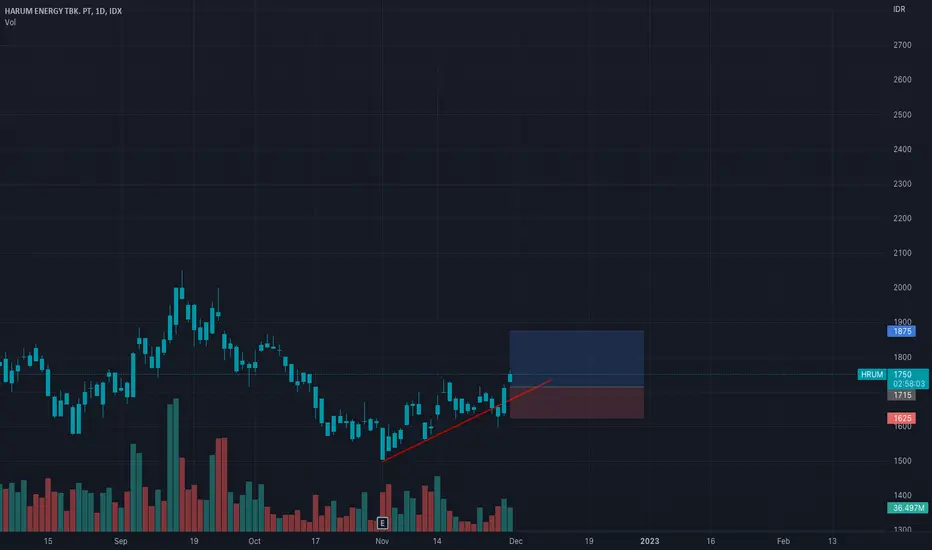
No idea just triying my skill and moneyyowassap.. i dont care about u hate comment.. but thank u for coming and reaction my trading plan setupby Liv-trader0
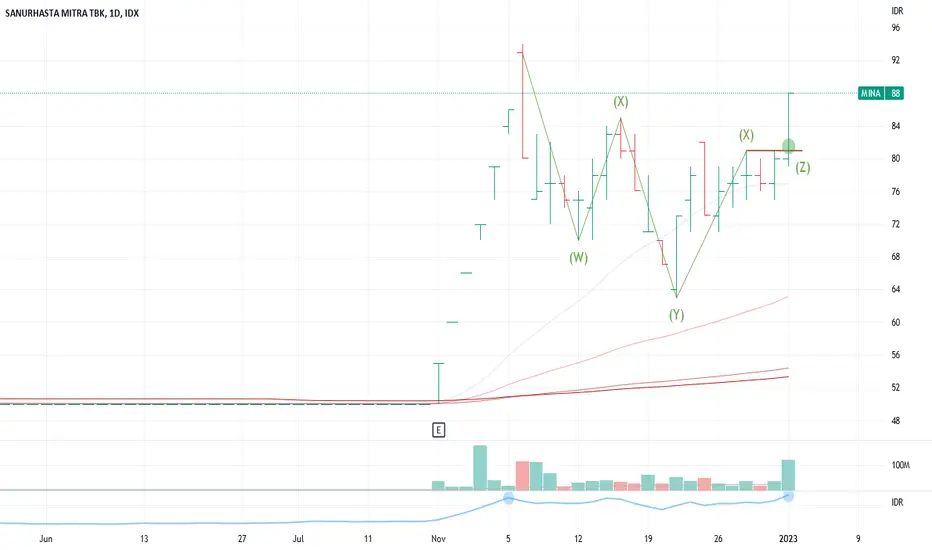
MINA - DOUBLE BOTTOMI bought my position today The reasons: 1. Low-risk entry 2. The stock has a classic double-bottom pattern 3. The second leg (Y) undercuts the first (W) 4. It has the handle offering the low-risk pivot area 5. Brokeout with huge volume Longby rifqonrUpdated 2
MIKA - CUP WITH HANDLEI bought positions today The reasons: 1. Low-risk entry 2. Long base, 31-week Cup and handle 3. Near all-time-high back to 2015 4. 7 years long base setup 5. VCP characteristics Flaws: 1. Bad fundamental standpoint 2. Lack of volume on the breakout If you draw a line back to 2015, you will see the line of supply near the all-time high. This is the main reason I bought this stock. Longby rifqonrUpdated 0
BINA (VCP - 42W 32/4 4T)I bought position today The reasons: 1. Low-risk entry 2. Long base VCP setup 3. The stock is in a confirmed stage 2 uptrend 4. Strong earnings. Longby rifqonrUpdated 3
BNGA (VCP - 29W 17/3 3T)I secured my positions today Why I bought the stock? 1. Low-risk entry 2. Long VCP setup 3. High relative strength 4. First base of confirmed stage 2 uptrend. The stock broke out today on a huge volume, I like to see if it can hold up and follow through in the upcoming days. Longby rifqonrUpdated 90
PMMP: Breakout With Volume Spike,Sign of Optimism in the Market?Hello Fellow Stock Global Trader/Investor! Price Action Analysis PMMP has broken out of the bearish channeling pattern. The breakout accompanies by the Volume Spike and Bullish Marubozu Candlestick. The MACD Indicator made a death cross, signifying a possible upside movement to the target area. Fundamental Drives 1. Indonesia Ended the Covid Restrictive Policy on December 2022 2. Indonesia's economy advanced by 5.72% YoY in Q3 of 2022, indicating a recovery from the pre-pandemic era. 3. PMLongby financialfreedomgoals101Updated 39
JPFA.JK MID-TERM INVESTMENT OUTLOOKIDX:JPFA JAPFA COMFEED VALUATION JPFA’s price/sales is 0.31. JPFA’s price/forward earnings is 7.18. JPFA’s price/book is 0.95. JAPFA COMFEED TECHNICAL BREAKDOWN Have a strong potential to continue the bullish movement, currently running in a bearish corrective movement Rp1,050-1,175 is expected to be the end of Wave E movement 1st Buy price around @Rp1,175 Average Down @Rp,1,025 Cut loss @Rp990 Bearish channel corrective movement should be traded cautiously Disclaimer Longby Mjolnir3143
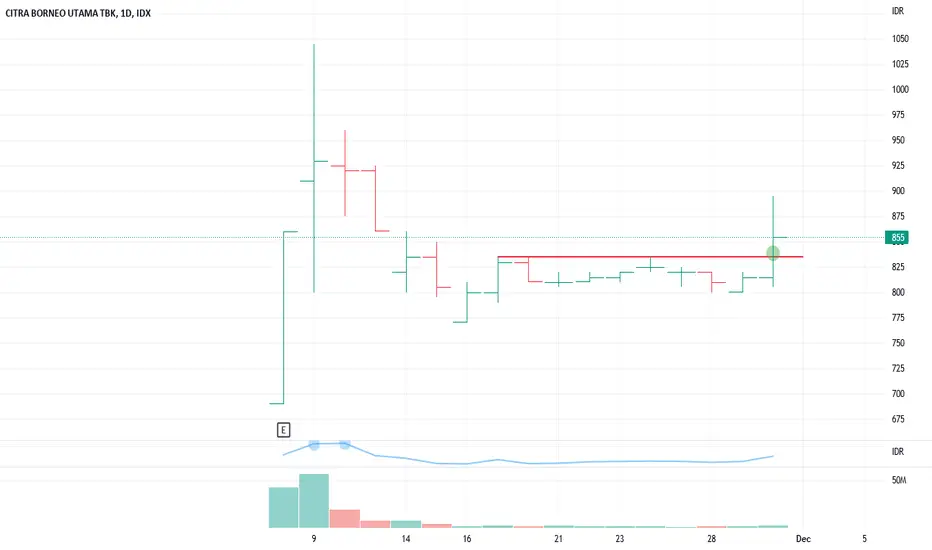
CBUT - PRIMARY BASEI secured my position today The reasons I bought the stock: 1. Low-risk entry 2. IPO base at a low cheat level 3. Consist of the double-bottom fractal, a small pattern within a base. The stock reminds me of Twitter's IPO in November 2013 and Murni Sadar Tbk (MTMH) in May 2022. Longby rifqonrUpdated 2
ICBP - CUP WITH HANDLEI have position today The stock breaks out of a textbook cup and handle pattern. 1. The stock is in a confirmed stage 2 uptrend 2. High volume breakout 3. High relative strength 4. Bought perfect at pivot level.Longby rifqonrUpdated 1
CPIN: Poultry and Consumer Defensive Stocks Possible Bull Run?Hello Fellow Stock Global Trader/Investor! Here's Technical Outlook on CPIN Chart Perspective CPIN is moving in the bullish continuation. The breakout of the bearish trendline and bullish flag indicated a potential bullish bias ahead. Furthermore, the momentum indicator made a golden cross, indicating a possible upside movement to the target area. All other explanations are presented on the chart. The roadmap will be invalid after reaching the target/support area. "Disclaimer: The outlook Longby financialfreedomgoals101Updated 28
Long Term Outlook about BBRI - BULLISH TREND# First of all, Disclaimer on. This is not advice to buy or sell the stock. Only sharing about my outlook point of view. Here, let me explain my long term analysis about BBRI banking stock in Indonesia in Technical Point of View. 1. So the first, I draw my support and resistance line based on candlestick on 12M or 1 Year timeframe. You can also look at the 12M timeframe. I put it in 5 line, there are 330, 750, 1410, 2380, and 4610 IDR. 2. Next step, I will predict the next resistance using aveLongby anugrahyogaprt3
BUAH - CUP WIH HANDLEI have the position today The why: 1. Low-risk entry 2. It forms a cup and handle pattern 3. High relative strength 4. Breakout today while the index declining quite big. Flaw: 1. Low volume supporting the breakout 2. Lots of failed C&H breakouts these days.Longby rifqonrUpdated 0
BBRI: a perfect time to buyThe candle formation is perfect. It is time to buy. An opportunity to continue its uptrend07:44by dearmara44
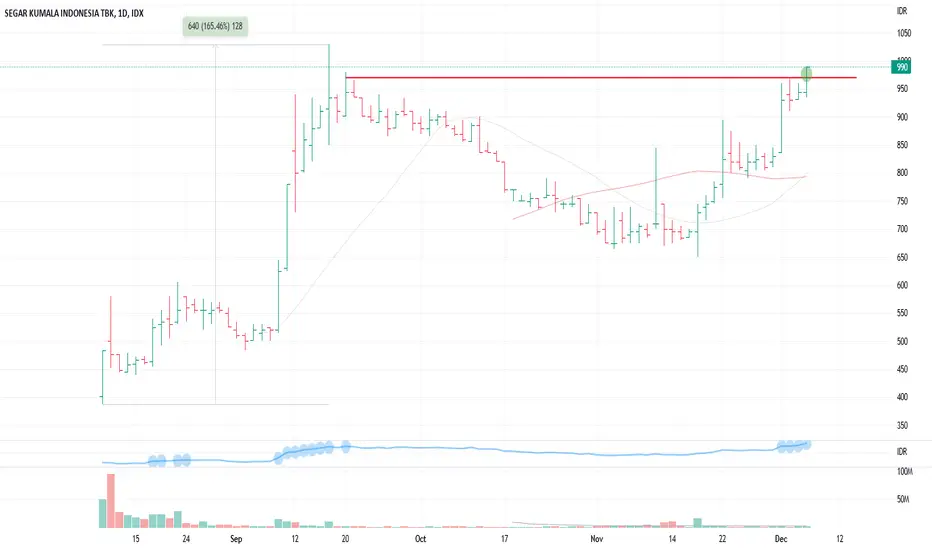
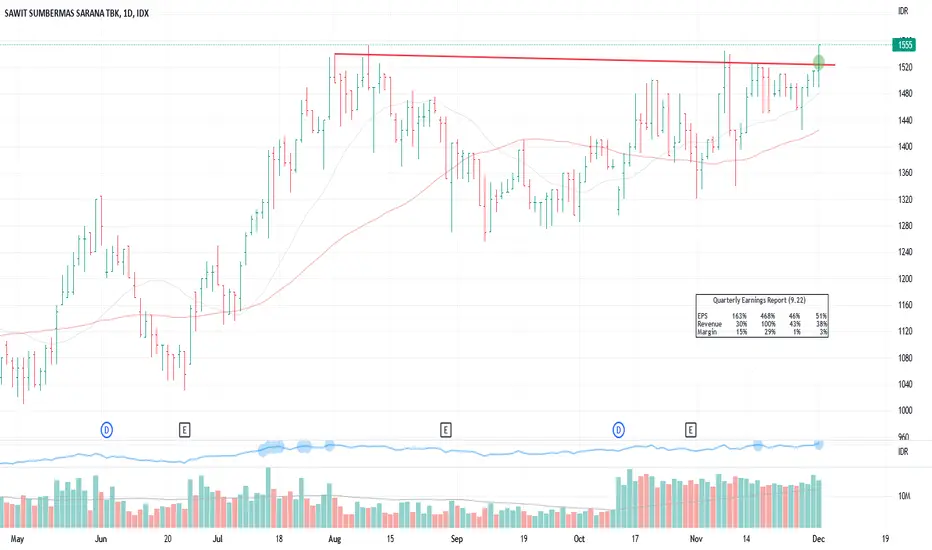
SSMS - CUP WITH HANDLEI bought a position today The why I bought the stock: 1. Low-risk entry 2. Long base Cup and handle pattern 3. A decent reported earnings 4. High relative strength 5. The stock has VCP characteristics. Longby rifqonrUpdated 1
JKON possible long positionJKON created a falling wedge pattern, in my opinion, yesterday they broke the upper trendline with a more significant volume than the average. Let's see if this can go to our target. Good luck and ride the wave! SL: 152 TP1: 200 TP2: 220-230 TP3: 250 *DYOR *Disclaimer: ONLongby dimasdanes09Updated 1
IDX : ERAA BREAKING THE HEAD N SHOULDER PATTERN !!ERAA weekly chart show us that there is Head and Shoulder pattern (Reversal Pattern From Bullish To Bearish) and already break the H n S neckline. Thats mean ERAA will going to the target area HnS at price 380-390 in the long game (Weekly). Stochastic indicator in weekly already Oversold, so there is a chance price will have a short Rebound to the Neckline Area. Disclaimer ON. Longby Aris_Sunandar93Updated 11
PWON Potential Upsidethe buyers is started rallying, and seller is responded with chopped response, there is potential upside of 4.17%Longby fathi3231720
MDKA Longusing smart money concept and signal, seller is slowing down, taking profit because the buyer is slowing down too, and they meet at supply and demand areaLongby fathi3231720
BBRI: Buying opportunity in couple days aheadIt is too far from the MA20 as of now. Let it go down a while until it is near Support or MA20. The opportunity will come shortly!Long04:15by dearmara3
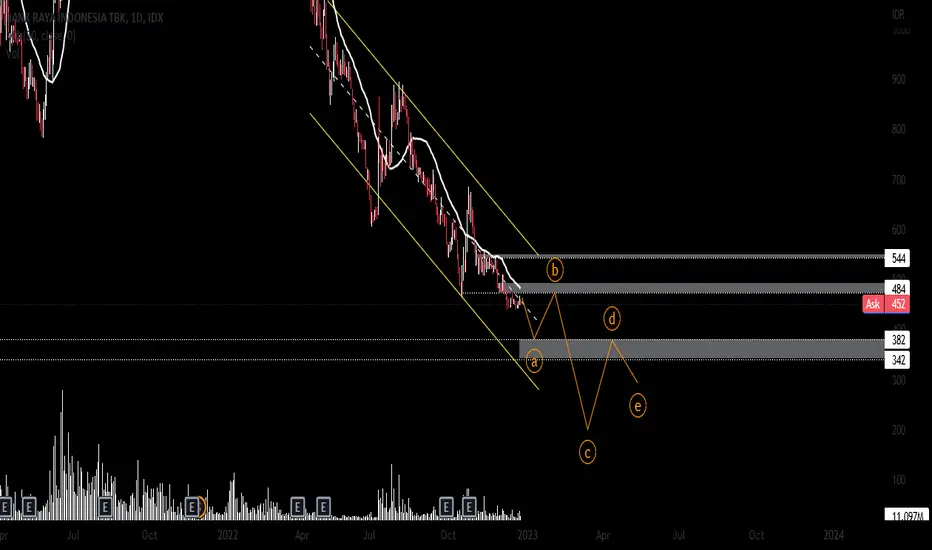
#GOTO breakout DownTrend Channel with TP 100#GOTO previously strengthened after reaching support at 183, but this time it seems unable to stem further decline. And now it has also breakout downtrend channel with a price target of 100. wait until it starts to approach 100 to consider a buy entry Shortby kafeinvestor3

 Long
 Long
 Long
 Long
 Long
 Long

 Long
 Long
 Long
 Long
 Long
 Long
 Long
 Long
 Long
 Long
 Long
 Long
 LongLong
 Short