 LongLong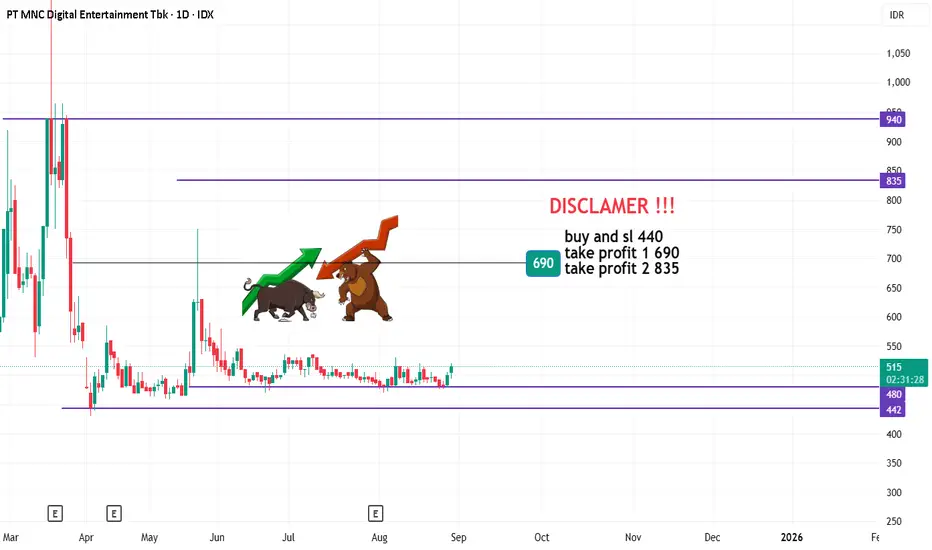
WINSDISCLAMER !!!!
buy now and
sl 350
buy long trem
buy on weekly
price take profit 565-720
long trem 880-1090
 Long
Long
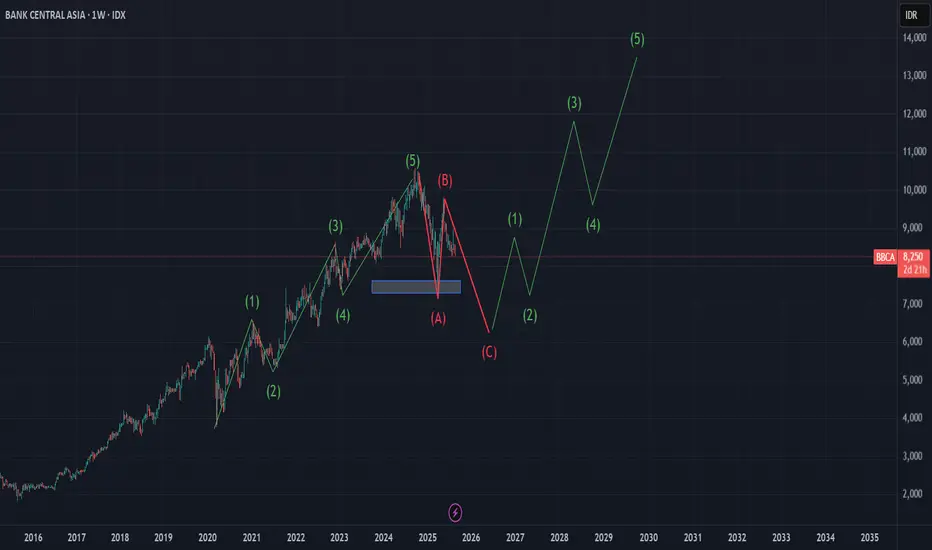
BBCA Elliott Wave Analysis: A Potential C-Wave Correction BeforeBased on a technical analysis using Elliott Wave Theory on the weekly timeframe, BBCA stock appears to have completed a significant 5-wave impulsive cycle (a major bullish run) since its 2020 lows. Currently, the price is in an A-B-C corrective phase, which is a natural occurrence after a strong uptrend. The projection suggests a potential for further downside to complete Wave C before initiating the next major bullish cycle.
Detailed Analysis
1. Completion of the Impulsive Cycle (Waves 1-5)
The chart shows a very clear 5-wave upward structure (marked with green numbers (1) through (5)), which peaked around early 2024. This indicates that BBCA's primary trend over the last few years has been exceptionally strong (super bullish).
Wave (1) & (2): The beginning of the uptrend.
Wave (3): The longest and strongest upward wave, reflecting high market optimism.
Wave (4): A healthy correction that did not fall below the peak of Wave (1).
Wave (5): The final push higher that created a new All-Time High, often accompanied by market euphoria.
2. The Current Corrective Phase (Waves A-B-C)
After a 5-wave impulse is complete, the market naturally enters a corrective phase, typically consisting of three waves (A-B-C).
Wave (A) : The initial sharp decline from the all-time high. This was the first signal that the uptrend is taking a "rest."
Wave (B) : A temporary rebound that failed to break the previous high (the peak of Wave (5)). This often acts as a bull trap, where the market appears to be resuming its uptrend but is actually just making an upward correction before continuing down.
Wave (C) : This is the final downward leg of the corrective phase. Based on the projection on the chart, Wave C has the potential to bring BBCA's price down further towards a strong support area.
3. Target Projection and the Next Cycle
Wave C Downside Target: The area marked by the blue rectangle represents a potential demand zone. Technically, this area aligns with the low of the previous Wave (4), which is in the price range of IDR 7,000 - IDR 7,500. However, a deeper projection as shown in the drawing (towards the IDR 6,000s) is also possible if selling pressure is strong enough.
The Next Bullish Cycle: Once this A-B-C correction is complete, Elliott Wave Theory suggests that BBCA is poised to begin a new 5-wave impulsive cycle to the upside. This opens up a very attractive long-term investment opportunity from a lower price point, with targets exceeding the previous all-time high in the coming years.
Key Levels to Watch
Strong Support (Potential Buy Zone): IDR 7,000 - IDR 7,500. Pay close attention to the price action if it enters this zone. Reversal signals such as bullish divergence or positive candlestick patterns could provide early confirmation that Wave C is ending.
Key Resistance (Scenario Invalidation): The peak of Wave (B) around IDR 9,800 - IDR 10,000. If the price manages to break above this level, this A-B-C corrective scenario would likely be invalidated or would have finished earlier than expected.
Conclusion
In the short term, investors and traders should be aware of the potential for further weakness in BBCA as it moves to complete Wave C. However, this weakness could present a golden opportunity for long-term investors to accumulate. Monitoring the price reaction in the key support zone will be a prudent strategy to potentially catch the beginning of the next major bullish trend.

Update of PANI This is my update of PANI, Indonesia stock. At the moment it is 15,050. My last post before this post, I mentioned the possibility of going all the way down. Based on the current market structure I dont think it's gonna happen soon. Cause at the moment it is dropping in form of consolidation, NOT impulsively. So if it head up again, it will target to break above 16,625 min, the best case above 16,900.
 Long
Long
INDYBUY now and SL 1,270, last support 885.
If it doesn't break 885, you can buy again.
TP1 2,200
TP2 3,250
if it reaches 2,200 you can hold until tp2
 Long
Long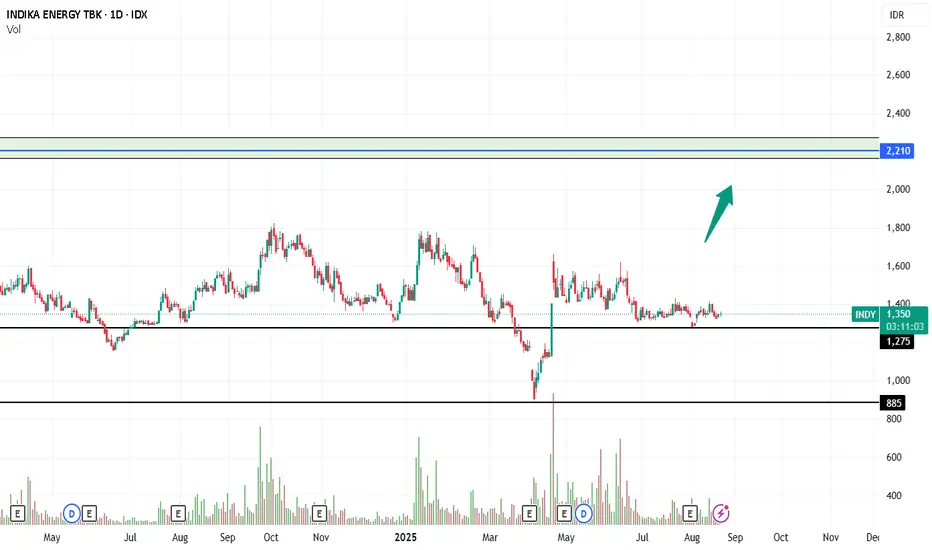
 Long
Long
 Long
Long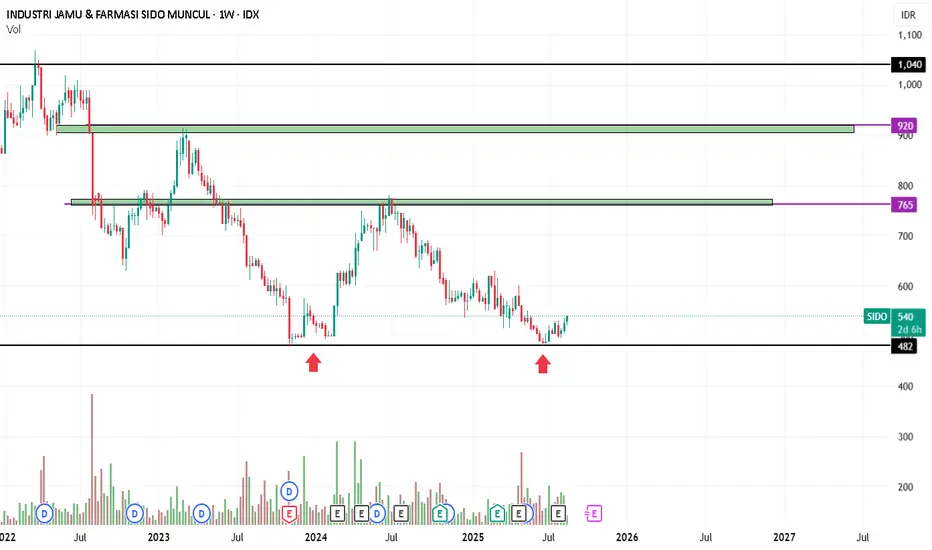
mapiDISCLAMER !!!!
buy
SL if the price is below 1.245, the last support is in the red box at 1.070
and take profit at 1.650
 Long
Long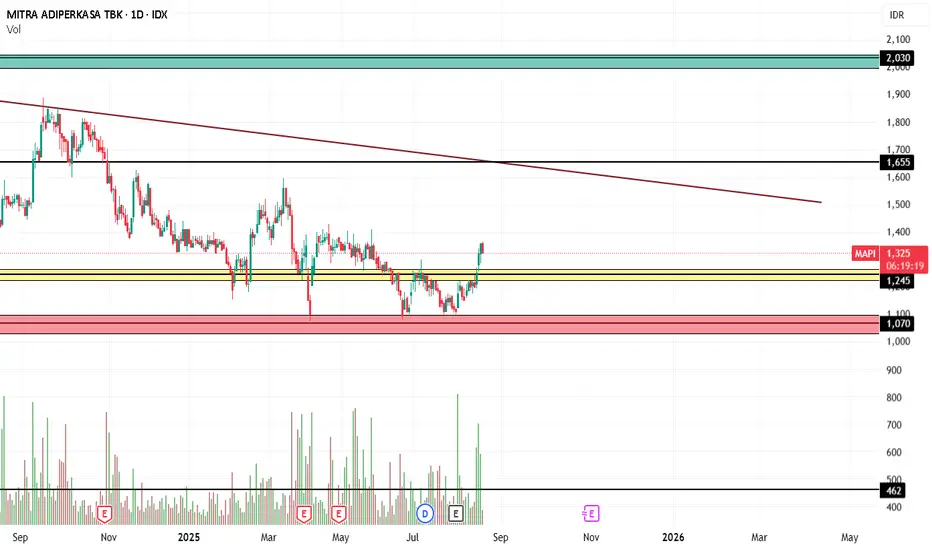
 Long
Long
THE ABC CORRECTION IS IN MAKING.. BUY ON DIP!Eventhough the C correction may be most likely is happening now, there are 2 possible scenarios could happen with the correction.
The ending target is still around 570-600 BUT THE LENGTH OF THE CORRECTION WILL BE THE MATTER.
SEE YOU @600!
 Long
Long
$CARE - CHEAT AREAIDX:CARE
Position Update: August 4, 2025
Key factors:
1. Low-risk entry point.
2. A rebase following a failed cup-and-handle formation, creating a potential cheat setup.
3. A confirmed Stage 2 uptrend, indicating upward continuation.
4. The stock is outperforming, rising even as the broader market trends lower.
5. Displays strong relative strength against the market and peers.
6. Volume dries up suggests less supply coming to the market.
7. Many stocks start showing traction based on my own stock continuum.
Considerations:
While the breakout was not accompanied by a significant volume surge, it is occurring in the early stages of what appears to be a new bull market cycle. This macro environment may support continued strength and follow-through.
I’ll be watching closely to see if it can hold up and follow through from here.
 Long
Long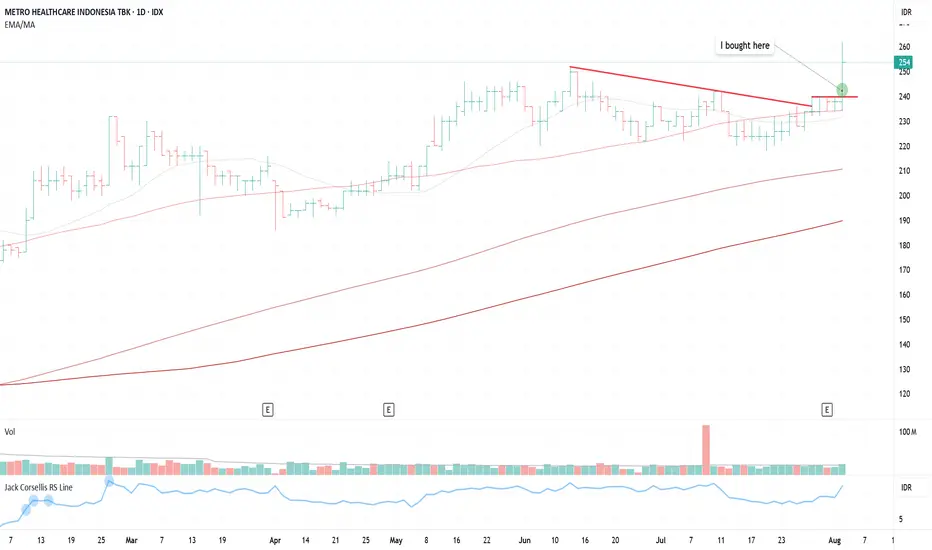
 Long
Long
 Long
Long
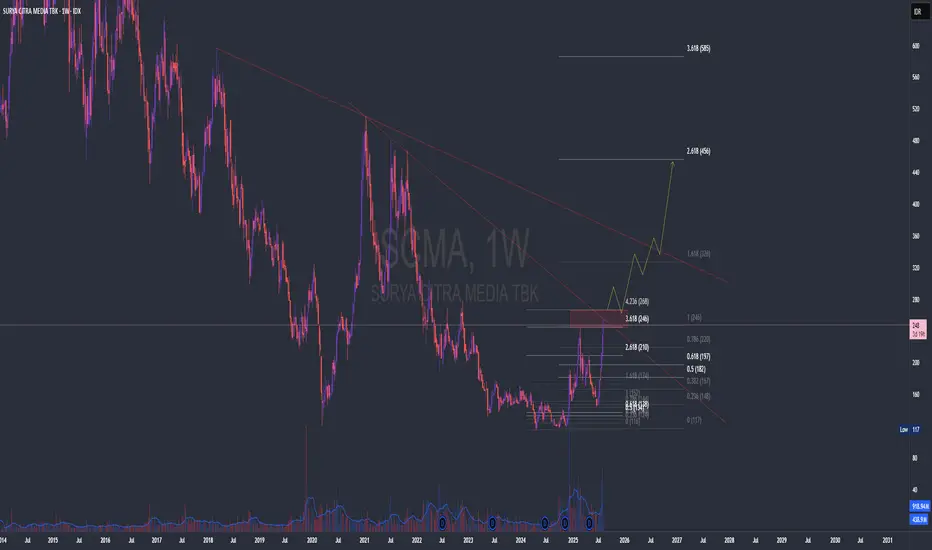
Do Not FOMOPrice is in a decisive position. On the thin line of dynamic resistance. If price successfully pass, it will have a great opportunity to continue again. If not, it is likely to retest support.
Structurally, the potential is quite high.
Action:
1. Don't be fomo, waiting for confirmation of the breakout is better.
2. If you want to go long, it is safer to wait in the support area, around 210-182
DYOR
Trade with your own decision

After Many Full Moons Have PassedAs subject, finally BTPS out from bearish structure.
Long
Target as fibo
DYOR
Trade with your own decision
 Long
Long
AMRT.. Looks GoodSimple and to the point, as subject...
Based TA : fibo, trendlines, candles
DYOR
Trade with your own decision
 Long
Long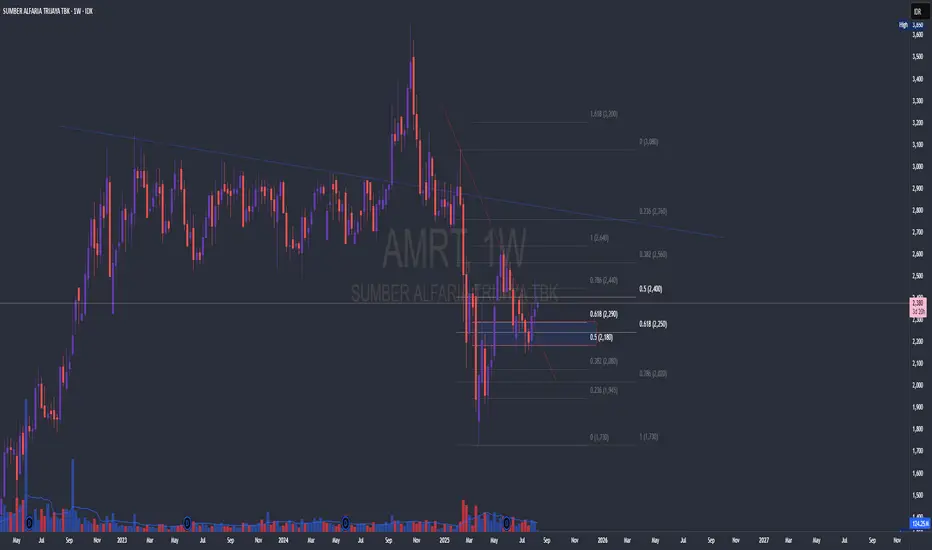
TLKM On the Rise? Probably NotI was tempted to buy into TLKM again last month, because it rose so fast and sounds awesome. So, I looked at the books and... did nothing.
TLKM buyback plans between 28 Mei 2025 - 27 Mei 2026 may provide supports, but nothing on its book tells me to buy it now. The company's first quarter performance was disappointing with reduced revenue and profits, probably due to increased competition in the industry. And I don't think they will launch new breakthrough projects anytime soon.
In my most optimistic eyes, TLKM will probably rise up to 3250 and that's that. But I strongly suspect it may fail to rise far beyond 3000-ish where it currently is. After all, it has touched the upper band of its multi-year downtrend channel.


SIDO On the Crossroads?SIDO was a VERY reliable asset on my portfolio since the pandemic. It fell in the aftermath, but we can always hope for a meaningful recovery as the company is pretty much perfect on the books. But it fell so hard since mid-2024.
I stopped buying SIDO since then, though I still keep it on my portfolio for the sake of dividends. Now, I am thinking of buying it again.
On June, SIDO has touched multi-year lows under 500. Then it slowly woke up to just slightly above 500 now. Sufficient reasons to think it may temporarily go sideways or rise till the next stopover at 600-ish.
Long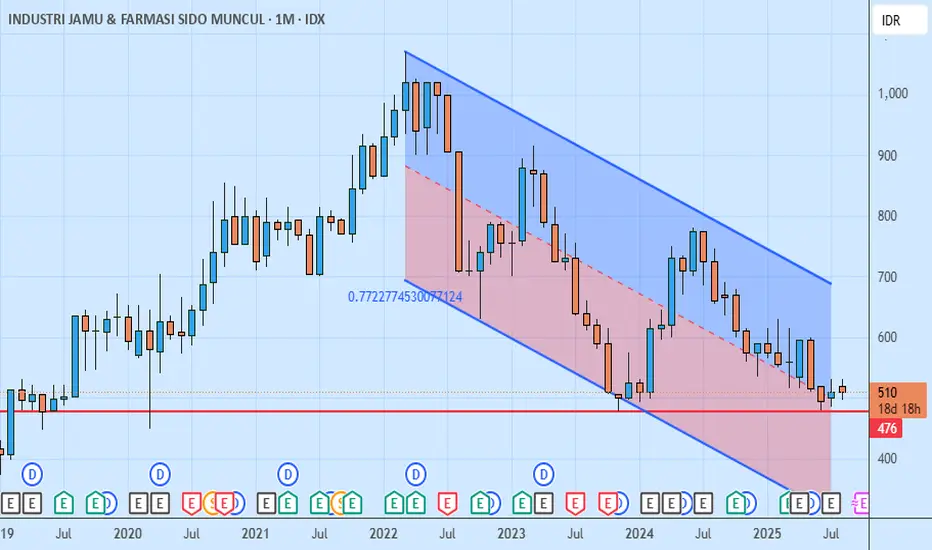
BJTM May Stay SidewaysBJTM stays on long-term downtrend. It probably will move sideways around 450-580 (February highs and lows) in the foreseeable future as it strives to create new supports.
Nothing particularly unfavorable can be seen on the books. BJTM grew moderately in the first quarter, and that's that. However, several corporate news have increased pressures on BJTM since 2024.
First, the controversial BEKS acquisition plan. Though it was probably arranged by the government, investors did not think it would be favorable for BJTM.
Second, suspected loan fraud. Earlier this year, Jakarta prosecutors detained three suspects on loan manipulation case in its Jakarta office. There are no reports of BJTM direct involvement, but the news soured our mood.
Third, Indonesian central bank most likely will cut rates again. Rate cut itself should not significantly impact BJTM as local government-affiliated bank, but slower growth is on the horizon.


Will This Wait End Soon?In April 2025 the price appears to be breaking away from dynamic resistance and there will be consolidation in the following weeks.
In the week of July 21, the price broke the consolidation area and tried again to break through the 96-100 resistance area.
Structurally, it is enough to give hope to those affected by harapan
But will those hopes be fulfilled?
It should be noted that the closing candle in the last week of July looked bad. However, there is a but, that the structure has not yet become invalid..
So there are several options:
1. The safest thing is to wait for confirmation of the price breakout from the 96-100 resistance area.
Only if this scenario occurs can you take buy action
2. Install a buy net in the 76-82 consolidation area to get a better RR ratio.
3. Buy speculation range area until 76. As usual, good averaging determines the results.
based : S/R, fibo, candles
DYOR
Trade with your own decision
 Long
Long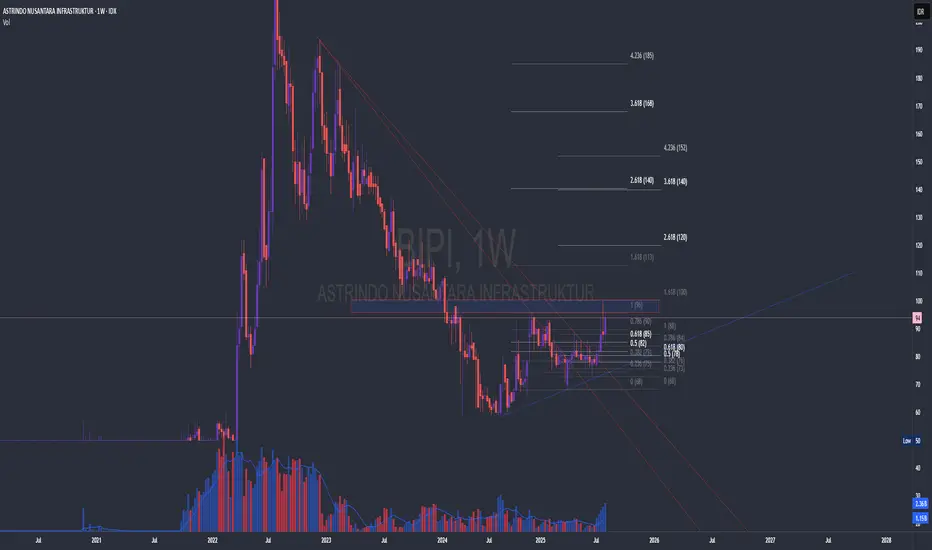
PGEO Technical Analysis:Long-Term Trend: From the chart, PGEO has been in a fairly strong uptrend since around May 2024. This is marked by the price consistently forming 'higher highs' and 'higher lows'.
Support and Resistance:
Strong Support: The main support area appears to be around the 1,480 - 1,500 price level. The price briefly corrected to this area and bounced back up. Another minor support is around 1,300.
Strong Resistance: The nearest resistance is around the 1,800 price area. This is the highest price level previously reached. The next stronger resistance appears to be around 1,950 - 2,000.
Volume: There was a significant increase in volume as the price started moving up since May 2024. This indicates strong buying interest from the market. However, in the last few days, trading volume has slightly decreased as the price corrected, which could be an indication of profit-taking or temporary consolidation.
Current Condition: Currently, the price of PGEO is in a consolidation phase after peaking around 1,800. The price is moving sideways between the 1,800 resistance and the 1,500 - 1,600 support.
 Long
Long
Needs ConfirmationJust to the point... The structure still looks bad but there is no invalid confirmation that it will continue to fall.
Weekly closed nya juga jelek
The action?
1. Speculation, buy now with averaging strategy There was demand in the previous candles. Invalid if the price drops below support
2. Waiting in the support area, in order to achieve a better RR ratio if the price drops until there.
3. Wait for the price to escape from dynamic resistance
DYOR
Trade with your own decision


INDF - VCP (13W 10/3 3T)IDX:INDF - VCP
+)
1. Low risk entry point on a pivot level.
2. Volume dries up.
3. Price has been above the MA 50 > 150 > 200
4. Price is within 25% of its 52-week high.
5. Price is over 25% of its 52-week low.
6. The 200-day MA has been trending upwards for over a month.
7. The RS Rating is above 70 (71).
EPS Growth:
a. Quarterly QoQ: -
b. Quarterly YoY: +11.20%.
c. TTM YoY: +32.14%.
d. Annual YoY: +6.07%.
(-)
1. There is no significant breakout with substantial volume.
 Long
Long