ANTMDISCLAMER !!!!
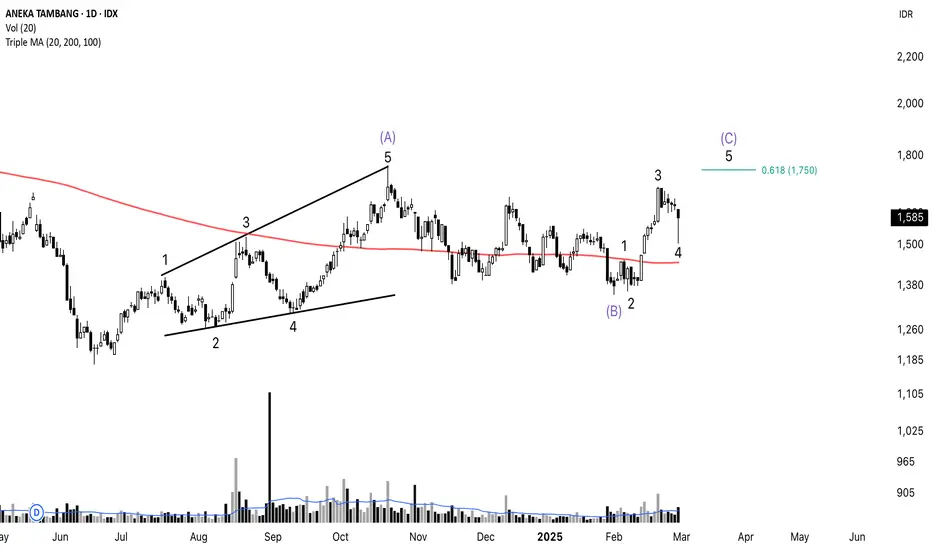
I WILL SHARE ANTAM'S IDEA IN 2 STAGES
STAGE 1
with a long term and installment purchase, don't go all in
buy from a price of 1,400-1,175
SL 1,100
TP 1 1,865
TP 2 2,080
TP 3 2,290
stage 2
wait and see first
wait for price breakout 1,690 then buy and
sl 1,595
tp 1 1,865
tp 2 2,080
tp 3 2,290
in the medium term antm is still bearish
sl is important, friends, don't forget sl to keep your money safe
 Short
Short
 Short
Short
 Long
Long
 Long
Long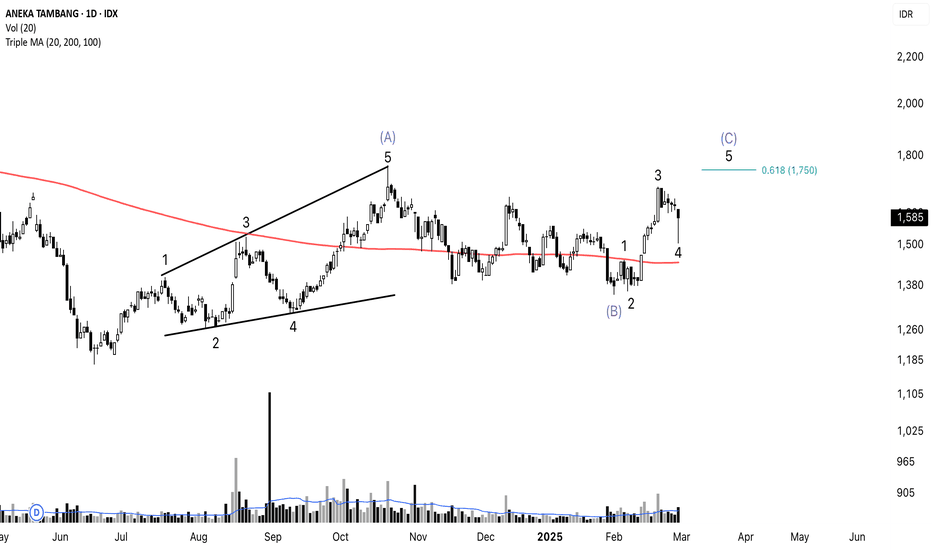
 Long
Long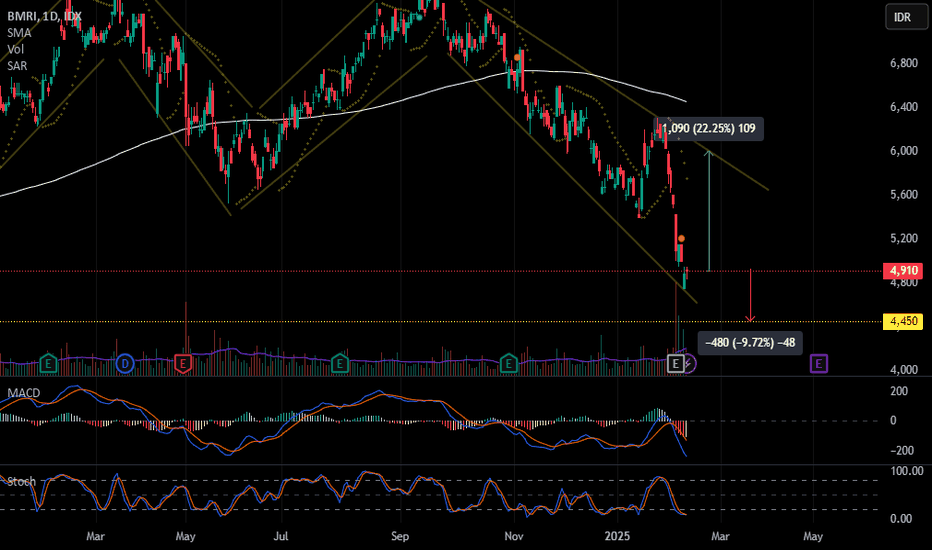
 Long
Long
 Long
Long
 Long
Long
WIFI: Bangkit dari Koreksi! Rebound atau Dead Cat Bounce?Trading langsung melalui TradingView x STAR!
Teknikal:
• Last: 1935
• Resist: 2170 : 2730
• Support: 1825 : 1550
• Cutloss: < 1550
Sales Note:
• WIFI through its brand Surge is a co providing internet connecticity through a fiber optic network along railroad tracks on Java island , partnering with local ISPs via revenue sharing system.
• Surge offers affordable (start from IDR100k/month), high quality and unlimited internet access to households located within 1-5km from KAI railroad – this has achieved so far an solid 90% take-up rate.
• WIFI owns 6,972km of fiber optic lines along railway tracks and highways in Java. As of 9M24, WIFI owner fixed assets in the form of project equipment worth IDR890bn and more than IDR800bn worth of fiber optic lines .
• In 9M24, Surged booked revenue growth of 46% y-y to IDR505bn. The company aims to roll out up to 40mn homepasses in 2025 – this coupled with a conservative 45% EBITDA margin, could translate to more than IDR250bn in profit .
• B/S is also manageable, with net gearing of 1.4x in 2024; with potentially increasing debt but reasonable given the exponential revenue growth.
• PT Investasi Sukses Bersama (ISB) owns 50.4% stake in WIFI, whereas around 45% of that is owned by PT Arsari Sentra Data (co owned by Hashim S Djojohadikusumo) .
• The stock trades at 7x EV/EBITDA 2025E , which is lower than global telco, especially fiber optic names avg of 8x.
Anthony Yunus
Head of Sales
PT Samuel Sekuritas Indonesia
__
Jika Anda memiliki pertanyaan, jangan ragu untuk menuliskannya kepada kami di kolom komentar di bawah.
PT Samuel Sekuritas Indonesia berizin dan diawasi oleh Otoritas Jasa Keuangan  Long
Long
BBNI: A potential tripple bottom, with theoretical target 5,225
Price rebound after a retracement from strong resistance through 4,880-4,750-4,700.
If breaks above 4,700, pattern since Jan2025 may become triple bottom.
MACD and Stochastic shows a divergence on this pattern, gives indication a possible bullish in progress.
This pattern theoretical target price if confirmed is around 5,250.
Prepare your risk management if price breaks below 4,350.
M. Alfatih, CFTe, CTA, CTAD, CSA, CIB
Trade for Indonesian Stocks with:
Samuel Sekuritas Indonesia
Technical Trading Course -batch9: April 2025 (daftar di star.id/go/ttc2025)
M. A  Long
Long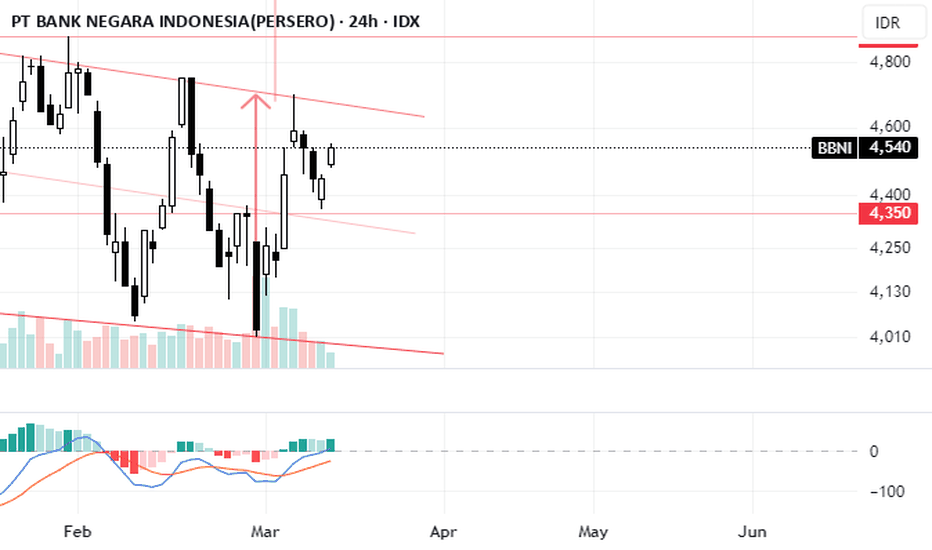
Long 
Forecasting & Trading Idea for PSAB Based on Support & ResistancCurrent Price Action Analysis
PSAB is trading at 262 IDR.
Key support levels: 248, 214, 197, 168, 145.
Key resistance levels: 282, 302, 336, 420.
The price is currently near 248 support, which has been tested before.
Trading Idea (Short-Term)
Bullish Scenario (Buy Setup)
Entry: Buy near 248 - 252 if price shows a bullish reversal.
Target: First target 282, second target 302.
Stop-Loss: Below 240 (to avoid fake breakdown)
Investment Perspective (Mid-Long Term)
If price stays above 248-250, it can accumulate and push toward 300+.
A strong breakout above 336 will confirm a long-term uptrend.
If price breaks below 214, caution is needed for long-term holding.
Conclusion
Short-Term Traders: Look for a buy setup at 248-252, targeting 282+.
Investors: Accumulate near support zones (214-248) with a target of 336-420.
Stop-Loss: Maintain a strict stop below 240 Golden Energy Mines TBK (GEMS.JK) Price ForecastAnalysis:
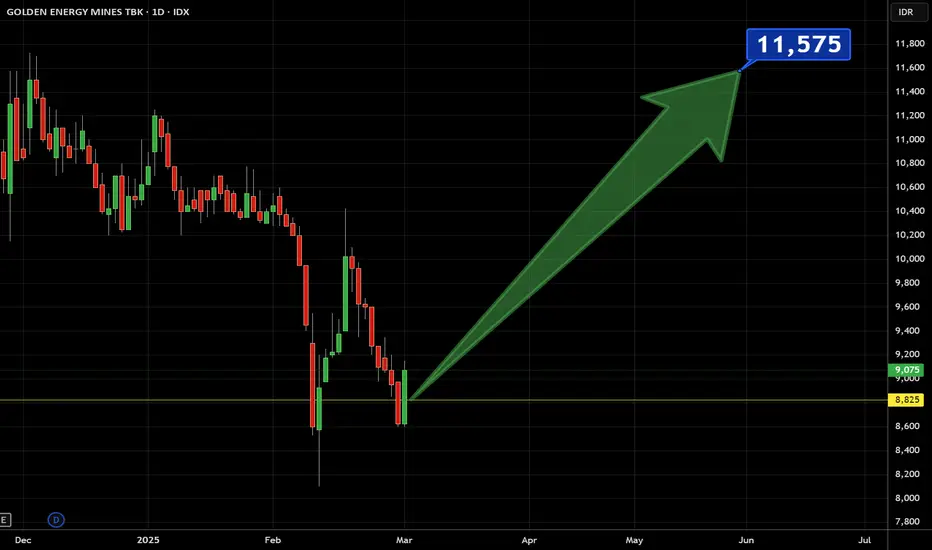
This chart, published on TradingView.com on March 4, 2025, depicts the daily price action of Golden Energy Mines TBK (GEMS.JK), an Indonesian stock listed on the IDX. The chart shows a significant price movement with a breakout pattern, followed by a projected target of 11,575, as indicated by the green arrow.
Price Trend and Breakout:
The chart captures the stock's price movement from late 2024 to early 2025. Initially, the price fluctuated between 9,000 and 10,000, showing a consolidation phase with several red and green candlesticks indicating volatility.
A sharp decline occurred around late January 2025, with the price dropping to a low of approximately 8,825, marking a significant support level.
Following this dip, the price began to recover, forming a series of higher lows and breaking above the previous resistance around the 9,000–9,200 range in early March. This breakout is a bullish signal, suggesting renewed buying interest and potential for further upside.
Price Target:
The green arrow points to a projected price target of 11,575, representing a potential increase of approximately 28% from the breakout level near 9,000.
The target appears to be derived using a technical analysis method, possibly a measured move or Fibonacci extension, though the exact methodology isn't specified. The target aligns with historical resistance levels seen around November 2024, where the price briefly touched 11,600 before pulling back.
Performance Metrics:
The chart notes a +450-point gain, equivalent to a 5.22% increase, likely referencing the price movement immediately following the breakout. This confirms the bullish momentum in the short term.
Support and Risk:
The 8,825 level, where the price bottomed out, acts as a key support zone. If the price fails to sustain its upward momentum, this level could be tested again.
The breakout above 9,200 is critical. A pullback below this level might invalidate the bullish setup, signaling a false breakout.
Market Context:
Golden Energy Mines operates in the coal mining sector, which can be influenced by global energy demand, commodity prices, and regional economic factors in Indonesia. The bullish breakout might reflect positive sentiment in the sector, such as rising coal prices or favorable government policies, though these factors aren't explicitly mentioned in the chart.
Conclusion:
The chart suggests a strong bullish outlook for GEMS.JK following its breakout above 9,200, with a target of 11,575. Traders should monitor the 9,200 level as a key support to confirm the continuation of this uptrend, while also keeping an eye on the broader market and sector-specific developments that could impact the stock's trajectory. If the price sustains above the breakout level, the projected target appears achievable based on historical price action and technical patterns. However, a drop below 9,200 could signal a reversal, with 8,825 as the next significant support.  Long
Long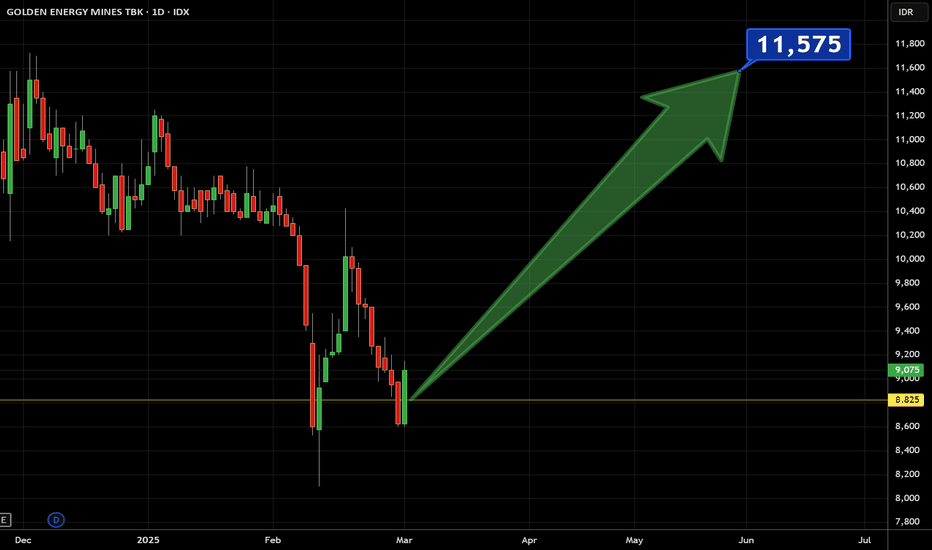
 Long
Long
Long 
 Long
Long