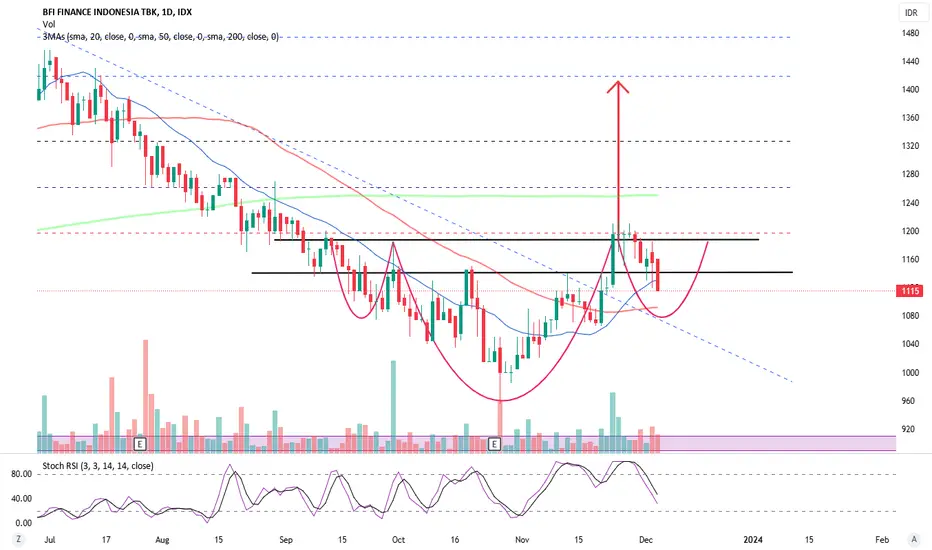
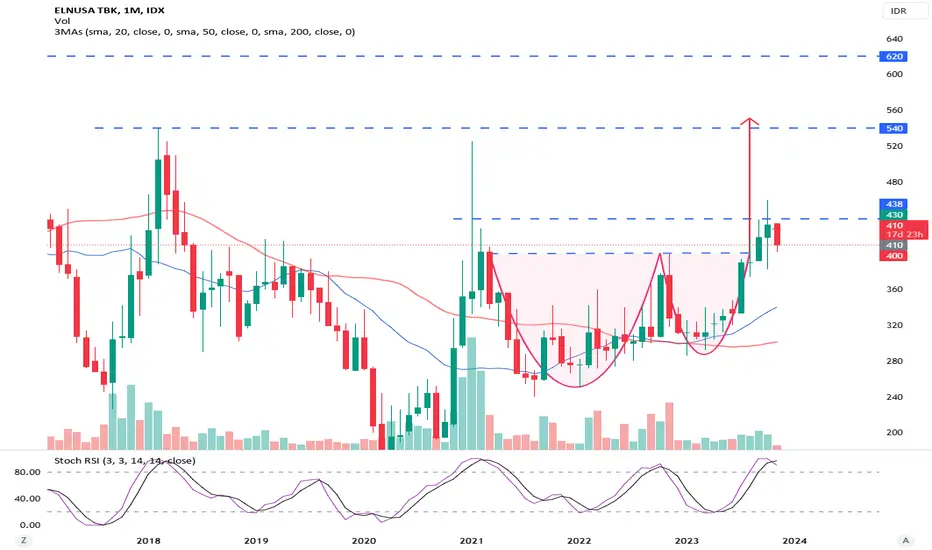
BSDE potential forming HnS confluence with Gartley PatternBSDE pullback from cup and handle neckline. Potential forming HnS pattern with pullback target (rough estimate only) confluence to Point C of Gartley Pattern.
If price pullback to Point C of Gartley and back up to HnS neckline, the HnS pattern will be completed and hopefully continue to the upside to complete the Gartley Pattern.
Finger Crossed !
BBRI (Bank Rakyat Indonesia)Intense Correction Underway for BRI with Support Zone at 3790-3510, Followed by Resurgence Towards 8000-8200 Range
BRI is currently amidst a pronounced correction phase, marked by robust downward momentum. The price is anticipated to sustain its descent, targeting the range of 3790 to 3510. This decline is propelled by significant selling pressure, potentially attributed to broader market sentiments or company-specific factors.
The forthcoming support zone of 3790-3510 holds critical importanc
BRIS (Bank Syariah Indonesia)Bullish Trend Continues for BRIS with Correction Towards 2050 Support
BRIS is currently in a bullish phase, characterized by a consistent uptrend. However, the stock is undergoing a corrective movement towards the 2050 price level. Notably, this level coincides with a robust demand zone, reinforced by the presence of the Fibonacci retracement of 61.8%. Additionally, the price is positioned above the 21, 34, and 90-period exponential moving averages (EMA), further enhancing the support at this c
ACES (VCP - 21W 25/4 4T)I have my positions
March 19, 2024
Reasons:
1. Low-risk entry point
2. Confirmed stage 2 uptrend
3. Has gone through a majority line of supply
4. A breakaway move, first breakout of a confirmed stage 2 uptrend
5. High relative strength
6. Volume dries up as less supply coming to the market
Flaws:
1. The market is still in a hard-penny environment, not much confirmation from the momentum stocks with only 25% of total stocks above the 200-day moving average
2. The index is moving higher but t
$BMRI - Is Bearish Coming?IDX:BMRI is developing a huge Falling Wedges (Weekly Chart).
The Uptrend Line has been tested a few times and finally broke down on early May.
The target from the Falling Wedges pattern is around 3700-3800, is it too far? We might think so.
Here it is some of the interesting point to watch:
1) Current support area between 6150 - 6225
2) EMA233 Support around 4625 - 4650, it is aligned with current flat Leading Span B
3) Weekly RSI has been showing a bearish divergence, indicating a
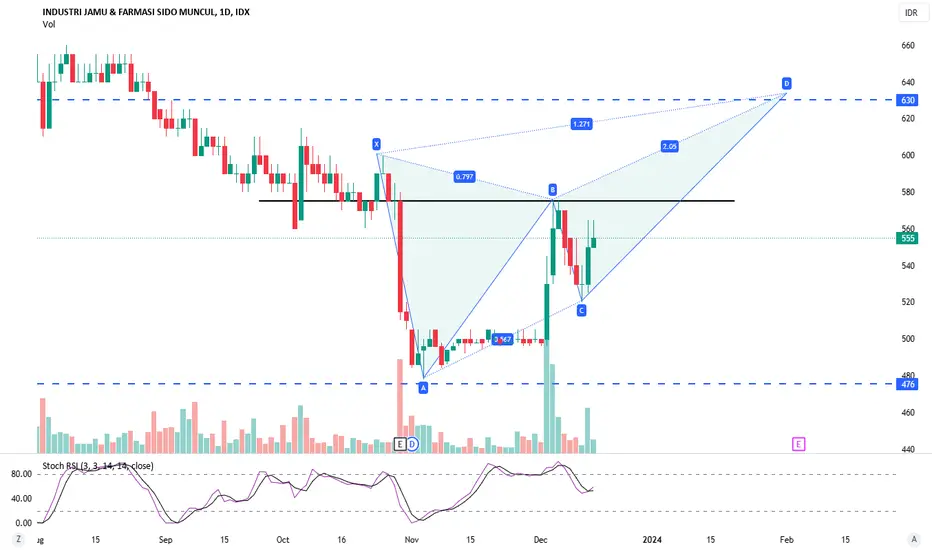
SIDO potential Butterfly Pattern and Cup&Handle (previous post)SIDO potential forming Butterfly pattern after successfully completed Point C and reverse to the upside.
Hopefully SIDO able to complete the pattern which is the next resistence and continue to reach the Cup&Handle pattern target (see previous post on Cup&Handle pattern)
BBRI 22 Apr overall risk:
the price already creating LL (orange) the risk is higher for me.
Strong support range 4830~ 4620 bottom purple box
but this is our chance to get discount price at LL / shadow MN. hoping it can reach the shoulder at minimum next month.
24Apr Earning & Revenue
Buy price:
-H4 fib & TL can be our buy range: 5100
-Also prepare for avg down if 24Apr report is red / under than estimate.
safety buy, wait D1 closed above 5350 then buy at retrace.
Target:
T1 5650
T2 5900
T3 as inve
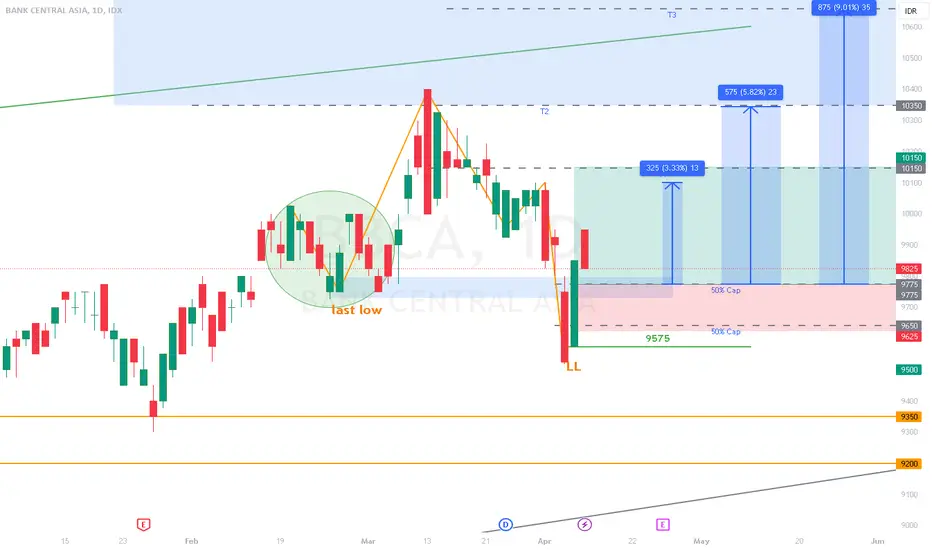
BBCA 5 APRthe last BBCA map already closed BEP (-0%)
yesterday price closed above 9775
this chart is 2nd try with new buy area.
remember that at this time, the wave already create new LowerLow means the risk is higher.. do your MM
or wait when the price near 9300 or above 10100 area if you dont want to take risk at current position.
Buy area 9775 ~ 9625
Price under 9575 = CL BEP or 9700
risk still the same, lower TL and SBR higher TF 9350 ~9200