Indra: the IRIS² contract reinforces its growth at highsBy Ion Jauregui – ActivTrades Analyst
Indra is back in investors’ focus after Hispasat secured the main contract for the ground networks of the European IRIS² programme, valued at more than €1.6 billion. The award strengthens the group’s exposure to the space business and adds visibility to an order book that is already at exceptional levels.
Indra closed the first half of 2026 with €3.179 billion in revenue, up 29.7% year-on-year, while EBITDA reached €456 million, up 72%. Net profit stood at €219 million.
The order book reached €20.533 billion, representing growth of 117% compared with the same period last year. This development provides high visibility for the coming years, although it also shifts the focus towards execution capacity: converting the contracted volume into revenue, profitability and cash generation.
Space gains prominence in the strategy
The IRIS² operation fits with Indra’s growing exposure to defence, space and strategic technology. Increased European defence spending and the pursuit of greater technological autonomy are creating opportunities in sectors where communications, surveillance and space-system capabilities are becoming increasingly important.
For Hispasat and Indra, the contract strengthens their position within this value chain. For investors, the main attraction lies in the possibility that this activity could help diversify and expand the company’s sources of growth over the coming years.
The challenge will be maintaining profitability as the size of projects and the order book increases.
Technical analysis maintains a bullish bias
From a technical perspective, the long-term trend remains bullish. The share price currently stands at €64.90, very close to the March high of €66.16.
The behaviour of the channel is also relevant. At the end of July, the price structure narrowed, but during August the channel has once again expanded, indicating that the trading range is increasing again in the direction of the prevailing trend.
The main resistance is therefore concentrated at €66.16. A breakout and consolidation above this level would allow the stock to surpass its March high and enter a new phase of price discovery.
However, the indicators call for some caution. The RSI stands at 76.30, reflecting a high level of overbought conditions. The MACD maintains a positive configuration, with the moving average and signal line above the histogram and a favourable structure that has remained in place for approximately one and a half months. This confirms the strength of the momentum, although it also indicates that the move has already covered considerable ground.
In the event of a correction, the market could find intermediate reference levels before reaching structurally significant areas. The Point of Control (POC) of the price distribution stands at €48.94, an area that concentrates significant traded volume and represents a much more distant, but meaningful, reference for assessing the medium- and long-term structure.
Conclusion
The combination of operational growth, an order book of more than €20.5 billion and greater exposure to defence and space maintains a positive fundamental outlook for Indra. The IRIS² contract reinforces this trajectory and adds visibility to a business considered strategic for Europe.
In the stock market, the underlying trend remains bullish, but the proximity to the €66.16 high places the share at a decisive level. Breaking above this level would confirm the strength of the move and could open the door to new highs.
The elevated overbought conditions, with an RSI of 76.30, suggest that strength should not be confused with an absence of risk: a consolidation would remain compatible with the prevailing trend as long as the price maintains its bullish structure.
Ultimately, Indra is approaching its highs with solid fundamentals and positive momentum, but it needs to convert the current buying pressure into a breakout above €66.16 to initiate a new bullish phase.
*******************************************************************************************
The information provided does not constitute investment research. The material has not been prepared in accordance with the legal requirements designed to promote the independence of investment research and such should be considered a marketing communication.
All information has been prepared by ActivTrades ("AT"). The information does not contain a record of AT's prices, or an offer of or solicitation for a transaction in any financial instrument. No representation or warranty is given as to the accuracy or completeness of this information.
Any material provided does not have regard to the specific investment objective and financial situation of any person who may receive it. Past performance and forecasting are not a synonym of a reliable indicator of future performance. AT provides an execution-only service. Consequently, any person acting on the information provided does so at their own risk. Political risk is unpredictable. Central bank actions can vary. Platform tools do not guarantee success.
Buy Candidate: Banco de Sabadell SA (SAB)Idea sourced via technical screener.
Banco de Sabadell SA engages in the provision of banking and financial services. It operates through the following segments: Business Banking in Spain, Asset Transformation, Banking Business in the United Kingdom, and Banking Business in America. The Business Banking in Spain segment covers commercial banking, corporate banking, and markets and private banking. The Asset Transformation segment comprehensively manages abnormal risk and real estate exposure, and sets out and implements the strategy of real estate investees, such as Solvia. The Banking Business in the United Kingdom segment corresponds to TSB Banking Group PLC which offers current and savings accounts, personal loans, cards, and mortgages. The Banking Business in America segment is made up of a number of business units, affiliates, and representative offices that are involved in corporate banking, private banking, and commercial banking activities related to finance. The company was founded on December 31, 1881 and is headquartered in Alicante, Spain.
Strength within a range, looking to break out.  Long
Long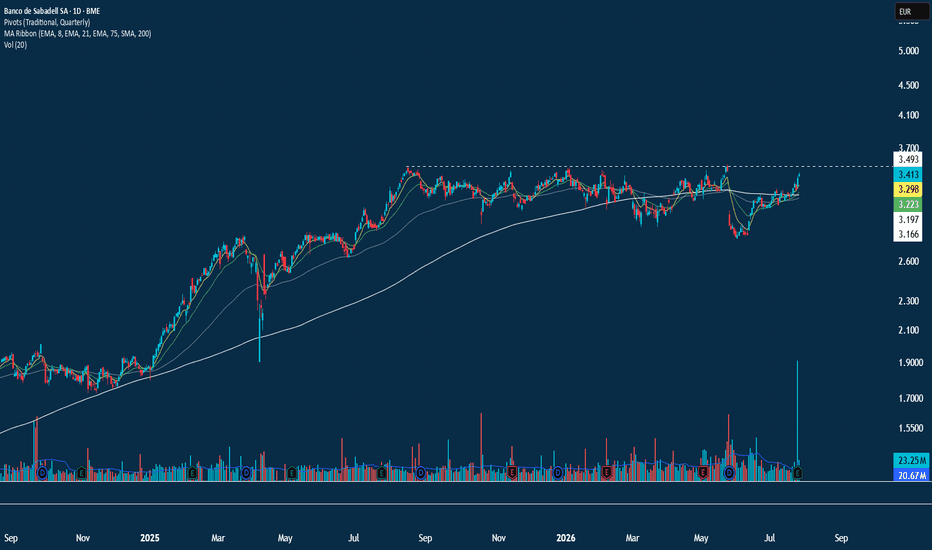
 Long
Long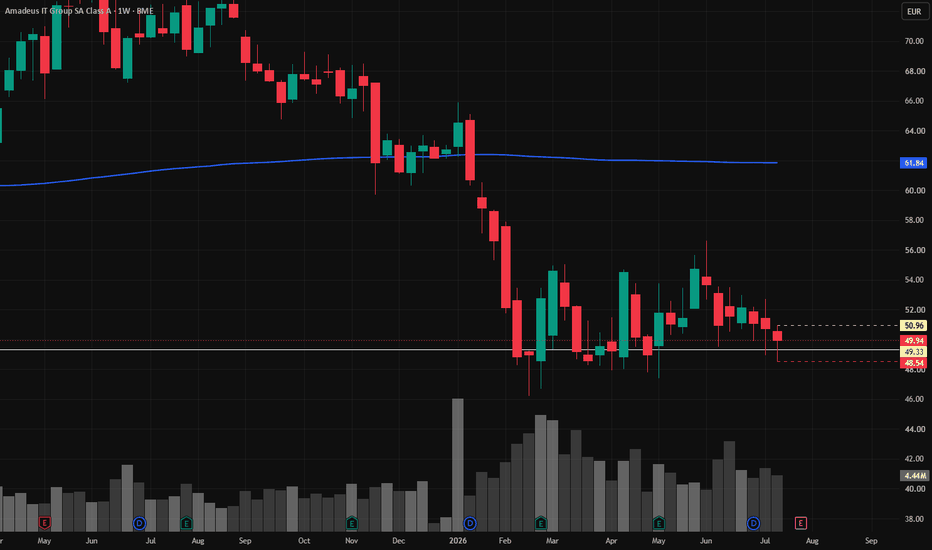
Repsol falls on easing Middle East tensionsRepsol falls as the market prices in an easing of tensions in the Middle East
By Ion Jauregui – Analyst at ActivTrades
Repsol shares recorded a decline of around 2.8% this Wednesday, clearly diverging from the positive tone of the IBEX 35, in a session marked by market optimism over a possible diplomatic breakthrough between the United States and Iran.
The Spanish oil company was pressured by a common movement within the energy sector: any expectation of geopolitical easing in the Middle East usually translates into downward pressure on oil prices, thus reducing expectations of extraordinary revenues for companies linked to exploration, production and refining.
The market is beginning to price in a scenario in which the risk of disruptions in the Strait of Hormuz gradually decreases. This strategic enclave channels approximately 20% of global crude oil trade, meaning that any improvement in relations between Washington and Tehran automatically reduces the geopolitical premium embedded in Brent prices.
In this context, Brent crude retreated toward the $97 area, moving away from the recent highs reached during the weeks of heightened regional tensions. Reuters highlighted that investors were reacting to growing expectations of progress in talks between both powers, triggering selling pressure across the European oil sector.
Fundamentals: solid results, but sensitive to crude oil prices
From a fundamental perspective, Repsol continues to show a solid financial structure and strong cash generation capacity, although the market is aware that a large part of its recent results has been supported by an extraordinarily favorable energy environment.
The company posted adjusted net profit close to 873 million euros during the first quarter of 2026, mainly driven by the strong performance of its industrial business and still elevated refining margins. In addition, the company maintains controlled net debt and an attractive shareholder remuneration policy through dividends and share buybacks.
However, the main risk for the stock price remains the evolution of oil prices. If Brent continues correcting and the market begins to anticipate lasting geopolitical stabilization, refining margins could compress significantly over the coming quarters, directly affecting one of the segments that has contributed the most to the company’s recent results.
Technical analysis: key support at the 100-session moving average
From a technical perspective, Repsol maintains a still constructive medium-term structure, although the short term shows clear signs of exhaustion after the latest corrections.
The price continues to hold above the previous consolidation range located between 19.45 and 21.30 euros. However, following the exhaustion of the latest upward impulse that led to the highs recorded on May 19 at 23.53 euros, the stock has developed a corrective phase that has pushed the share price toward the current area around 21.88 euros.
Bearish pressure has pushed the stock below the 50-session moving average, reflecting a loss of bullish momentum in the short term. Even so, the 100-session moving average continues to act as dynamic support, preventing for now a deeper correction and maintaining the medium-term bullish structure intact.
Should the stock lose the 21.30 euro area, the market could begin pricing in a broader corrective movement toward lower levels. Conversely, a recovery above 23.53 euros would improve the technical bias once again and shift the focus back toward the recent highs of March 19, when the stock reached 24.90 euros per share.
The evolution of Brent crude will remain the main catalyst for Repsol in the coming sessions, especially if the market continues adjusting positions in anticipation of a scenario of lower geopolitical tensions in the Middle East.
*******************************************************************************************
The information provided does not constitute investment research. The material has not been prepared in accordance with the legal requirements designed to promote the independence of investment research and such should be considered a marketing communication.
All information has been prepared by ActivTrades ("AT"). The information does not contain a record of AT's prices, or an offer of or solicitation for a transaction in any financial instrument. No representation or warranty is given as to the accuracy or completeness of this information.
Any material provided does not have regard to the specific investment objective and financial situation of any person who may receive it. Past performance and forecasting are not a synonym of a reliable indicator of future performance. AT provides an execution-only service. Consequently, any person acting on the information provided does so at their own risk. Political risk is unpredictable. Central bank actions can vary. Platform tools do not guarantee success.
*Enagás raises H2Med to €6.7 billion and strengthens the H3!Enagás raises H2Med to €6.7 billion and strengthens its shift toward hydrogen
By Ion Jauregui – Analyst at ActivTrades
Enagás estimates at €6.7 billion the investment required to develop the hydrogen backbone network in Spain and the European H2Med corridor, a key project to connect the Iberian Peninsula with France and Germany within the EU energy strategy.
The BarMar subsea section, between Barcelona and Marseille, will span around 400 kilometers and have capacity to transport 2 million tons of hydrogen annually. The consortium is composed of Enagás together with NaTran and Teréga. Total investment includes around €4.170 billion for the backbone network and €2.5 billion for H2Med, with operating costs estimated at €150 million per year.
The project strengthens Enagás’ transition toward hydrogen as a new business core amid the decline of natural gas. The initiative could generate around 19,000 jobs and contribute nearly €980 million in tax revenues in Spain, although the market continues to monitor the high capex and the future profitability of green hydrogen.
Technical analysis Enagás (Ticker AT: ENG)
Enagás maintains a bullish bias in the medium and long term, with a sideways bias in the short term. Since the bullish gap on March 27, the price structure has formed a new channel between the highs at €17.37 and the latest double support around €16.39. The current price of €16.98 is slightly above the mid-range. The 50-period moving average is supporting the current move, suggesting that the ongoing moving average expansion could push the price to retest the new ceiling formed on April 8 near the highs. Immediate support below the range lies at €15.47 and €14.74, with the previous range high acting as a third support at €14. If the resistance at the highs is broken, an advance toward €18.50 could be seen as the first psychological target. If not, the price would likely retest the lower bound of the range. As long as the 100-period moving average is not broken to the downside and price does not fall below the first support, Enagás can be considered to maintain a lateral-bullish bias. A breakout to the upside would consolidate momentum linked to interest in European energy infrastructure.
Green transition extends
H2Med consolidates Enagás’ positioning in the hydrogen transition, enhancing its strategic profile within European energy infrastructure.
The market will remain focused on project execution and on the ability to convert long-term investment into stable returns, in an environment where hydrogen monetization remains uncertain.
*******************************************************************************************
The information provided does not constitute investment research. The material has not been prepared in accordance with the legal requirements designed to promote the independence of investment research and such should be considered a marketing communication.
All information has been prepared by ActivTrades ("AT"). The information does not contain a record of AT's prices, or an offer of or solicitation for a transaction in any financial instrument. No representation or warranty is given as to the accuracy or completeness of this information.
Any material provided does not have regard to the specific investment objective and financial situation of any person who may receive it. Past performance and forecasting are not a synonym of a reliable indicator of future performance. AT provides an execution-only service. Consequently, any person acting on the information provided does so at their own risk. Political risk is unpredictable. Central bank actions can vary. Platform tools do not guarantee success.
Inditex falls to annual lows despite earnings outlookBy Ion Jauregui – Analyst at ActivTrades
Shares of Inditex are undergoing a correction phase in 2026 after declining more than 13% since the start of the escalation of the war between Iran and Israel. The stock has reached annual lows around €49 per share, in a context marked by geopolitical uncertainty and fears of a slowdown in global consumption. Pressure is especially visible in the retail sector, which is highly sensitive to the economic cycle and rising energy costs.
Middle East pressures the share price but does not alter the fundamental outlook
The recent weakness is mainly driven by rising geopolitical risk and its potential impact on consumption, as well as the indirect effect of higher oil prices on global demand. Although the Middle East represents approximately 8% of Inditex’s store network under a franchise model, its contribution to consolidated sales is below 5%, which limits the direct impact of the conflict on group results.
Beyond short-term noise, the company’s structural advantages remain intact. Its business model, based on fast inventory turnover, global distribution and logistical flexibility, allows it to reallocate products across regions within the same season, reducing the risk of overstock and dependence on specific markets.
In this context, the conflict has not led to any significant downward revisions in forecasts. Market consensus still expects net profit of around €6.8 billion in 2026, above the record highs reached in 2025, with projections exceeding €8.7 billion in 2027.
The market continues to trust European retail
The European discretionary consumer sector maintains expectations of a gradual recovery in the coming years, supported by the normalization of earnings-per-share growth after several years of adjustment. Within this environment, Inditex continues to stand out as one of the highest-quality defensive names in the sector, thanks to its geographic diversification, cash generation and operational efficiency.
The upcoming results release in early June will be key to determining whether the recent correction is driven solely by exogenous factors—such as geopolitics—or whether it begins to reflect a more structural slowdown in global consumption.
Technical analysis of Inditex
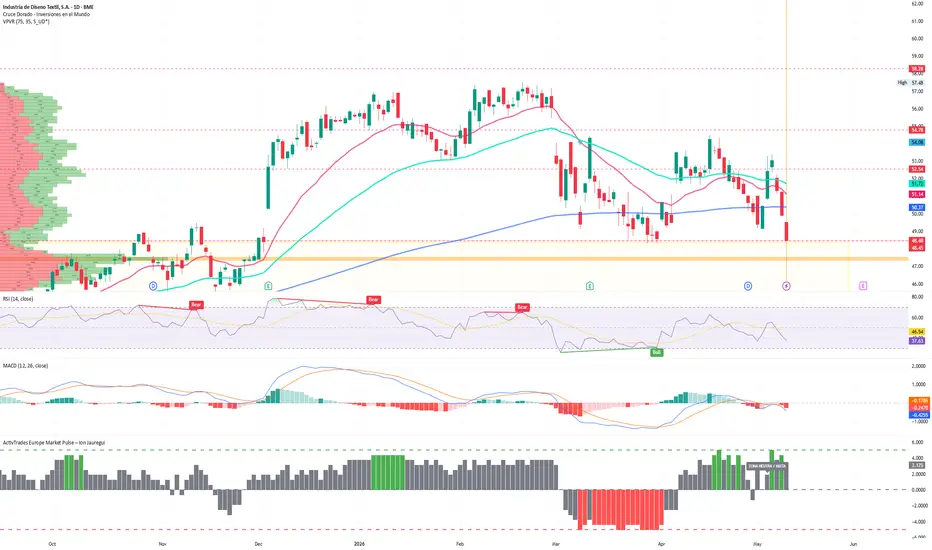
From a technical perspective, the stock has tested a key support zone around €49, a level that coincides with annual lows and an important reference within the previous consolidation range.
If this support holds, the most likely scenario points to a technical rebound towards the €52–53 range (point of control of the range), with further extension towards resistance at €54–55 in a second phase. A sustained close above this level would open the door to a recovery towards all-time highs at €57.48. Conversely, a clear break below current support would increase downside pressure towards levels close to €45.4.
Short-term moving averages (50- and 100-day) remain in a bearish configuration, while the 200-day moving average has recently been tested without confirmation of a sustained breakout. Momentum indicators show oversold conditions, with the RSI around 37%, suggesting a possible exhaustion phase of the downward move. The MACD continues to reflect selling pressure, although with a declining slope.
Overall, the market is in an unstable equilibrium phase, with moving average compression and a narrowing range, which could precede a directional move in the coming weeks.
Despite the short-term technical deterioration, analyst consensus maintains a constructive outlook. The average price target stands at around €58.7, implying upside potential of approximately 17.5% from current levels, with mostly positive recommendations, suggesting the stock is clearly oversold and undervalued at current prices.
The divergence between geopolitical risk and underlying fundamentals continues to drive price action, which is why part of the market views the current correction as an accumulation phase rather than a structural trend reversal.
*******************************************************************************************
The information provided does not constitute investment research. The material has not been prepared in accordance with the legal requirements designed to promote the independence of investment research and such should be considered a marketing communication.
All information has been prepared by ActivTrades ("AT"). The information does not contain a record of AT's prices, or an offer of or solicitation for a transaction in any financial instrument. No representation or warranty is given as to the accuracy or completeness of this information.
Any material provided does not have regard to the specific investment objective and financial situation of any person who may receive it. Past performance and forecasting are not a synonym of a reliable indicator of future performance. AT provides an execution-only service. Consequently, any person acting on the information provided does so at their own risk. Political risk is unpredictable. Central bank actions can vary. Platform tools do not guarantee success.
Grifols shifts toward value diagnosticsBy Ion Jauregui – Analyst at ActivTrades
Strategic break with QuidelOrtho and new stage in diagnostics
The Spanish company Grifols has ended its more than four-decade alliance with QuidelOrtho for the production of antigens, in a move that marks a turning point in its diagnostics strategy. As part of the agreement, it will receive 65 million dollars (around 55.5 million euros) in payments through 2028, although both companies will maintain an exclusive supply contract. Grifols will continue manufacturing for its former partner and for clients such as Abbott Laboratories, Siemens and OraSure Technologies, while gaining autonomy to develop new higher value-added products.
Fundamental impact: improved flexibility and business transition
From a fundamental perspective, the impact is moderately positive. The cash injection improves short-term financial visibility, relevant in a context of high indebtedness, but the real change lies in strategic flexibility.
The diagnostics division —which represents around 8.5% of the business— recorded 640 million euros in revenue in 2025, with a 0.8% decline affected by currency effects. In parallel, the transition toward more advanced solutions, including those approved by the Food and Drug Administration, points to a gradual improvement in margins, supported by dynamic segments such as blood typing, which grew 6.6%.
In addition, there is the stability of relevant contracts such as the agreement signed with Abbott in 2015 for 700 million dollars, which continues to provide visibility to the unit.
Grifols SA (TICKER AT: GRF) consolidation after corrective phase
In technical terms, Grifols SA is in a consolidation phase after recent volatility that pushed the price from 11.7 euros to yearly lows at 8.432 euros.
Currently, the stock trades in a narrow range between 9 and 10 euros, standing around 9.19 euros, reflecting a sideways structure after the corrective move.
Key resistance is located at 10.409 euros, a level that coincides with the 200-day moving average and acts as a relevant dynamic barrier. Above that, the next targets are 11.165 and 11.7 euros. On the downside, supports are located at 8.432 euros, followed by 7.934 and lows at 7.282 euros.
The stock remains conditioned by the “death cross” recorded on March 6, whose invalidation would require a clear consolidation above the 200-day moving average. A break below 8.432 euros would reactivate downside pressure toward 7.282 euros lows, while an upward breakout with volume would strengthen a potential structural trend reversal.
Technical indicators remain mixed: RSI stands around 45 in neutral territory, MACD remains negative but with decreasing bearish momentum, and moving averages still do not confirm a solid bullish reversal.
Greater autonomy, key to the stock narrative
The break with QuidelOrtho does not materially change the short-term outlook, but it reinforces Grifols’ strategic reconfiguration toward a more independent, efficient model focused on added value. The market will now assess whether this greater autonomy translates into sustainable margin improvement and the consolidation of a medium-term trend reversal.
*******************************************************************************************
The information provided does not constitute investment research. The material has not been prepared in accordance with the legal requirements designed to promote the independence of investment research and such should be considered a marketing communication.
All information has been prepared by ActivTrades ("AT"). The information does not contain a record of AT's prices, or an offer of or solicitation for a transaction in any financial instrument. No representation or warranty is given as to the accuracy or completeness of this information.
Any material provided does not have regard to the specific investment objective and financial situation of any person who may receive it. Past performance and forecasting are not a synonym of a reliable indicator of future performance. AT provides an execution-only service. Consequently, any person acting on the information provided does so at their own risk. Political risk is unpredictable. Central bank actions can vary. Platform tools do not guarantee success.
Rheinmetall and Indra Lead European Defense
By Ion Jauregui – Analyst at ActivTrades
European rearmament is experiencing its most intense moment since the Cold War. European Union member states spent €381 billion on defense in 2025, 11% more than the previous year and 63% above 2020 levels, according to the European Defence Agency. The figure is equivalent to nearly 2% of the bloc’s GDP and reflects the growing perception that Europe must have its own military capabilities in an increasingly unstable world.
Conflicts such as the war in Iran and friction with the United States have pushed governments to strengthen their defense industry. Brussels has reinforced this trend with the “ReArm Europe / Readiness 2030” plan, which foresees mobilizing up to €800 billion in military investment by 2030, with funds allocated to systems acquisition, technological development, and support for defense innovation.
In this context, companies like Rheinmetall and Indra have become key players in the new European arms cycle.
Rheinmetall: the Land Giant
Rheinmetall closed 2025 with revenues of €9.9 billion, a 29% increase compared to the previous year, driven by demand for armored vehicles and ammunition. The company projects sales of between €14 and €14.5 billion in 2026.
Despite strong results, the market demands execution: its margin and cash flow guidance fell short of expectations, causing stock declines of around 8%. Analysts note that the company benefits from a record backlog of €63.8 billion but must demonstrate production and delivery capacity.
Rheinmetall actively participates in several key European defense projects. The company leads the production and modernization of armored vehicles, including the Leopard 2E tank, providing combat systems, fire controls, and electronic components in collaboration with Indra. It is also part of the European MARTE consortium, dedicated to developing the next-generation main battle tank, and recently signed a memorandum of understanding with Indra to create a joint venture in Spain to compete for contracts to supply up to 3,000 military trucks and tactical vehicles, thereby strengthening its industrial and logistical presence in Europe.
Catalysts: European contracts, backlog expansion, potential acquisitions.
Risks: production bottlenecks and sensitivity to political changes.
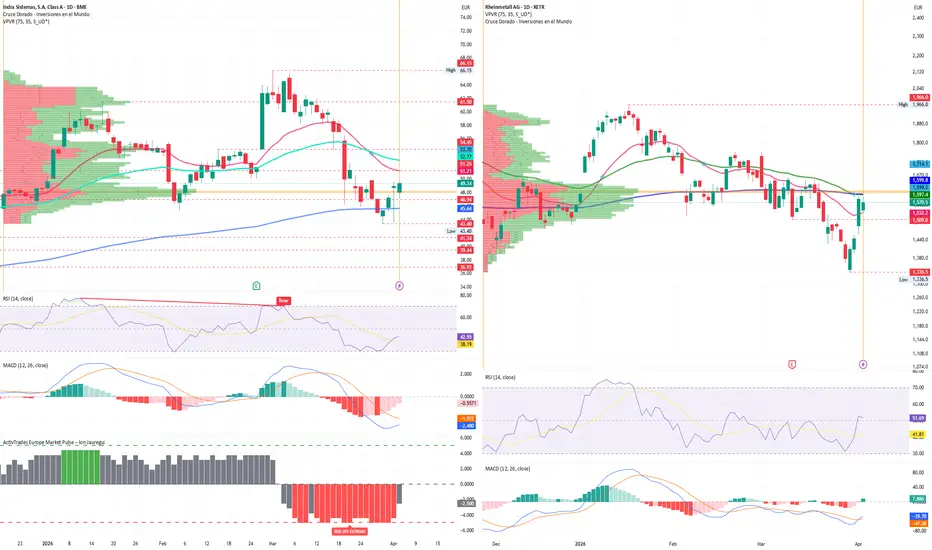
Technical analysis: Over the past three sessions, the stock has advanced, recovering the control point area around €1,568. On Friday, the candle closed above the 50-day moving average, indicating a new upward movement that could recover the 100 and 200-day averages. If resistance levels at €1,714 and €1,780 are surpassed, a new search for highs could occur. Currently, RSI is in a neutral zone after recovery, and MACD is bullish in recovery. If the price fails to hold, declines to the €1,336.5 low zone are possible.
Indra: the Technological Bet
Indra has gained weight in electronic systems, cybersecurity, and military digitization. The company is part of strategic alliances with Rheinmetall and other European groups to develop military vehicles and participate in major public contracts.
The short term, however, is marked by uncertainty: the departure of its president and the halt of a key operation have generated stock pressure, with declines of around 23% over the last month. Nevertheless, Indra maintains exposure to European and NATO projects, with medium-term growth opportunities.
Indra focuses on electronics, digitization, and command and control systems for defense. The company co-develops the Leopard 2E combat and C4I systems with Rheinmetall and participates in the European MARTE project as an industrial partner, providing technological integration expertise. Indra also leads projects such as the advanced RALOFI counter-battery radar and has received preliminary design contracts for future main battle tanks (MBT/PAMOV). Its participation in the joint venture with Rheinmetall expands its exposure to military vehicles and logistical trucks, consolidating its position in European strategic programs.
Catalysts: governance normalization, alliance execution, European funds.
Risks: political interference and dependence on public contracts.
Technical analysis: Over the past three sessions, the stock has advanced with a bullish session last Friday. RSI is slightly oversold in recovery, MACD maintains a downward average with a recovering histogram, indicating the contraction has not fully reversed. The price currently rests on the 200-day moving average, so if it surpasses the €53.45 control point area, it would recover the short-term bearish correction. Otherwise, a drop to €43.30 lows is possible.
The ActivTrades Europe Market Pulse indicator has shown capital outflows and extreme risk-off sentiment; the April Friday session was the first to show a slight reversal, suggesting a potential increase in neutral sessions with upward entries.
An Expanding Sector Under Scrutiny
The European defense sector combines structural growth and revenue visibility, but investors are beginning to differentiate between companies with solid execution and those with corporate or political risk. Rheinmetall represents growth with execution pressure; Indra, strategic potential with short-term uncertainty. In both cases, the bet is clear: Europe is investing in defense, and these companies are at the center of the historic continental rearmament boom.
*******************************************************************************************
The information provided does not constitute investment research. The material has not been prepared in accordance with the legal requirements designed to promote the independence of investment research and such should be considered a marketing communication.
All information has been prepared by ActivTrades ("AT"). The information does not contain a record of AT's prices, or an offer of or solicitation for a transaction in any financial instrument. No representation or warranty is given as to the accuracy or completeness of this information.
Any material provided does not have regard to the specific investment objective and financial situation of any person who may receive it. Past performance and forecasting are not a synonym of a reliable indicator of future performance. AT provides an execution-only service. Consequently, any person acting on the information provided does so at their own risk. Political risk is unpredictable. Central bank actions can vary. Platform tools do not guarantee success.
Inditex reaches luxury-level profitability&targets record margin
By Ion Jauregui – Analyst at ActivTrades
Inditex has consolidated its position as one of the most profitable groups in the global textile sector, achieving a net margin of 15.6% in 2025, outperforming direct competitors such as H&M and Gap, and even surpassing luxury giants like LVMH and Kering.
The group reported revenues of €39.864 billion and net profit of €6.22 billion, driven by a strategy focused on cost control and a gradual shift toward more premium segments. This approach has enabled the company to expand margins in an environment marked by competitive pressure from low-cost platforms such as Shein and Temu.
At an operational level, Inditex maintains record-high ratios, with an EBITDA margin of 28.2% and an EBIT margin of 20.1%, reflecting sustained improvements in efficiency and pricing power. Market consensus expects stability in 2026, with potential net margin expansion to 15.9% by 2028.
In contrast, the luxury sector is showing signs of slowdown, with recent declines in revenues and profits among some of its key players, affected by weaker demand in Asia.
In equity markets, Inditex shares remain close to all-time highs, trading around €49.24 at the open, within a long-term bullish structure that remains intact for now. From a technical perspective, the price has undergone a controlled correction after reaching highs, pulling back toward the value area or point of control around €48. This level coincides with a key support zone, previously a consolidation range and the base of the latest bullish leg. Holding this level is crucial to maintaining the broader positive structure.
In terms of moving averages, the recent short-term bearish crossover (50-day moving average falling below the 100-day) should be interpreted as a technical adjustment following the March 11 earnings release, more related to profit-taking than to any structural deterioration.
However, the price has temporarily broken below the 200-day moving average, introducing an element of tactical weakness. That said, momentum indicators such as RSI and MACD are in oversold territory, suggesting selling pressure may be exhausted and opening the door to potential technical rebounds.
This behavior is further confirmed by the ActivTrades Europe Market Pulse indicator, which signals an Extreme Risk-off environment. This reflects broader risk aversion across European markets, driven by macro factors such as geopolitical tensions in the Middle East and rising oil prices, which have triggered sustained institutional outflows over recent sessions.
In this context, as long as the €48 level holds as support, the underlying bias remains constructive. A bullish reactivation signal would be confirmed by a sustained recovery above the 200-day moving average, accompanied by increased volume, potentially paving the way for a renewed attempt at all-time highs.
Recent performance reinforces Inditex’s positioning as a hybrid player between fast fashion and luxury, with the capacity to sustain profitable growth in an uncertain macroeconomic environment.
*******************************************************************************************
The information provided does not constitute investment research. The material has not been prepared in accordance with the legal requirements designed to promote the independence of investment research and such should be considered a marketing communication.
All information has been prepared by ActivTrades ("AT"). The information does not contain a record of AT's prices, or an offer of or solicitation for a transaction in any financial instrument. No representation or warranty is given as to the accuracy or completeness of this information.
Any material provided does not have regard to the specific investment objective and financial situation of any person who may receive it. Past performance and forecasting are not a synonym of a reliable indicator of future performance. AT provides an execution-only service. Consequently, any person acting on the information provided does so at their own risk. Political risk is unpredictable. Central bank actions can vary. Platform tools do not guarantee success.
Madrid, Epicenter of the “European Bizum”: Who Benefits from it?Madrid, Epicenter of the “European Bizum”: Who Benefits from the New Era of Payments
Ion Jauregui – Analyst at ActivTrades
Madrid is preparing to become the capital of a structural change in the European financial system. The headquarters of the future pan-European instant payment system, backed by the European Payments Initiative (EPI), aims to integrate national platforms such as Bizum in Spain, Bancomat in Italy, or Blik in Poland into a common infrastructure capable of competing with US giants like Visa and Mastercard. Beyond the technology, this is a bet on European financial sovereignty, reducing dependence on external actors in a critical area such as digital payments.
The main beneficiaries of this initiative are the European banks driving the project. Institutions such as Banco Santander, BBVA, and BNP Paribas consolidate their role in the payments value chain, recovering margins on fees that until now flowed to global intermediaries. For Santander, with its broad geographic diversification and strong presence in Europe and Latin America, this integration strengthens its digital strategy and could translate into increased fee income and stronger customer engagement. BBVA, with its historic focus on digitalization, sees in this initiative an opportunity to accelerate the adoption of instant payments and embedded financial services, improving operational efficiency. For BNP Paribas, a leader in corporate payments and transactional banking, the project offers the chance to expand its market share in Europe and strengthen its financial services division.
It is not only the banks that see opportunities. Infrastructure and fintech companies, such as Worldline, Nexi, or Adyen, emerge as strategic players to build and operate the platform that will connect the various national networks. The expansion of this ecosystem will also indirectly benefit European e-commerce, which will be able to reduce acceptance costs and improve margins, as well as consumers, who will have access to homogeneous instant payments across countries without changing applications.
Technical Analysis
Banco Santander (Ticker: SAN)
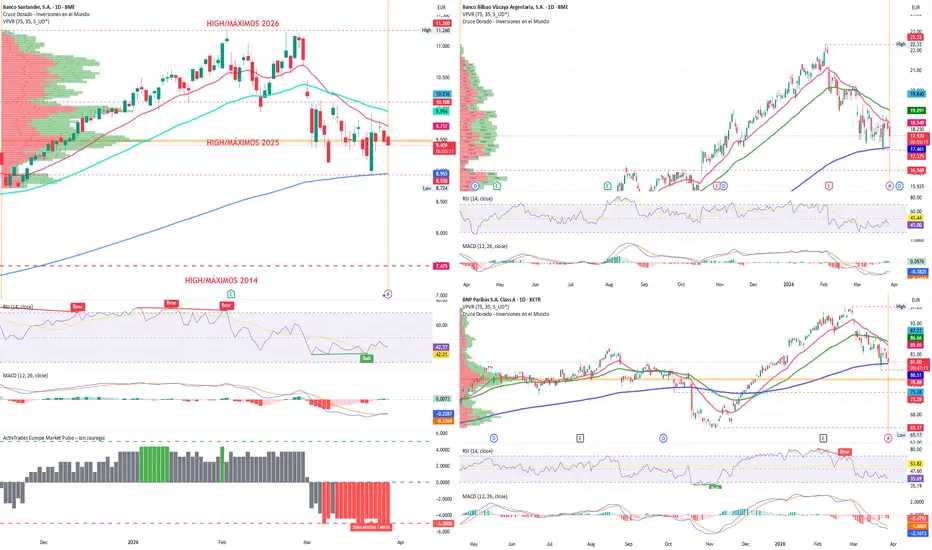
Santander shares have corrected from the 11.26-euro highs reached in February, testing in March a support zone around 8.938 euros, coinciding with the 200-day moving average. After losing the 50- and 100-day averages at the beginning of the month, the price has shown a strong rebound. The RSI, which reached oversold levels, has partially recovered to 42.71%, while the MACD remains bearish, though with an increasing histogram. A consolidation above 10 euros could open the door to a move toward the control point at 10.712 euros, whereas a rejection in this zone could lead to a retest of the monthly lows.
BBVA (Ticker: BBVA)
The stock has returned to November 2025 levels around 17.462 euros, with the current price stabilizing around 18 euros. After losing the 50- and 100-day averages, the price rebounded in mid-March, lateralizing above the support at 17.375 euros and the 200-day moving average. The RSI has corrected from oversold to 41.55%, and the MACD shows a growing histogram, though still below the average. If the price holds this support and surpasses the 50-day average at 18.544 euros, it could aim for 19 euros and previous highs. Otherwise, a failure to hold the support could push prices toward 16.735 euros.
BNP Paribas (Ticker: BNP)
After reaching historic highs of 97.25 euros at the end of February, BNP Paribas corrected down to the August 2025 highs, finding support. Despite the recent death cross, the price remains above the 200-day moving average. The RSI indicates oversold at 35.50%, and the MACD continues bearish. If the current support holds, a rebound toward 87 euros is possible; otherwise, an additional correction could push the price down to 73.28 euros, consolidating the bearish pressure.
Finally, the ActivTrades Europe Market Pulse indicator points to an excessive Risk-Off in recent sessions, which has driven investors’ corrections out of the market, slowing the sector’s upward momentum.
The impact of this project goes beyond financial operations. Europe seeks to consolidate a real alternative to the dominant global networks, repositioning its banking and technology sectors. If widespread adoption occurs, the “European Bizum” could become a continental standard, gradually displacing foreign intermediaries and creating a value flow centered on local banks and fintechs. Madrid, for its part, not only becomes the administrative headquarters: it consolidates as the epicenter of European financial innovation, attracting talent and strengthening Spain’s strategic presence in the sector.
*******************************************************************************************
The information provided does not constitute investment research. The material has not been prepared in accordance with the legal requirements designed to promote the independence of investment research and such should be considered a marketing communication.
All information has been prepared by ActivTrades ("AT"). The information does not contain a record of AT's prices, or an offer of or solicitation for a transaction in any financial instrument. No representation or warranty is given as to the accuracy or completeness of this information.
Any material provided does not have regard to the specific investment objective and financial situation of any person who may receive it. Past performance and forecasting are not a synonym of a reliable indicator of future performance. AT provides an execution-only service. Consequently, any person acting on the information provided does so at their own risk. Political risk is unpredictable. Central bank actions can vary. Platform tools do not guarantee success.
 Long
Long
Telefónica balance sheet cleanup & strengthens Spain&BrazilTelefónica cleans up its balance sheet and strengthens Spain and Brazil despite accounting losses in 2025
Ion Jauregui – Analyst at ActivTrades
Telefónica closed 2025 with net losses of 4.318 billion euros, a result conditioned by extraordinary items linked to the ERE in Spain, the impairment of assets in Hispanoamérica (Hispam), and the negative impact of currencies. Without these non-recurring effects, profit would have stood at 2.122 billion euros, confirming that the deterioration responds more to a clean-up process than to a structural weakening of the business.
From an operational standpoint, the figures reflect a company that accelerated in the fourth quarter and consolidated its recovery in its key markets. Revenues grew by 1.5% to 35.120 billion euros, while adjusted EBITDA reached 11.918 billion, with 2% organic growth. Operating cash flow increased by 5.7%, showing strength in resource generation.
Spain and Brazil once again acted as growth engines. The Spanish subsidiary recorded its best financial year since 2008, with revenues of 13.012 billion euros (+1.7%) and EBITDA growth of 1.1%. Brazil, meanwhile, maintained solid commercial momentum and growth in local currency. In contrast, Germany and the United Kingdom showed greater competitive pressure and margin adjustments.
In financial terms, net debt was reduced to 26.824 billion euros, supported by free cash flow generation. The company maintains its dividend of 0.15 euros per share, reinforcing its commitment to shareholder remuneration in a context of financial discipline.
Technical Analysis Telefónica (Ticker AT: TEF)
Looking at the chart, the stock maintains a medium-term recovery structure, while the long-term movement remains a range fluctuating between 4.430 and 3.535 euros, with the area of greatest confluence located around the point of control in the lower zone at 3.745 euros, slightly above the current price.
As long as the share preserves the key supports it has recovered, with the 50- and 100-period moving averages turning positive above the lower end of the range and seeking to regain the 200-session moving average, the bias could be considered constructive. A recovery of 3.930 euros could mark a turning point in the bullish evolution, opening the door to a new upward leg, with the market now focused on organic improvement and the gradual reduction of leverage.
Indicator analysis shows that RSI still maintains some overbought inertia at 61.59%, while MACD signals a bullish bias. Projecting the evolution of the European market through the ActivTrades Europe Market Pulse, we can observe that it stands in a neutral/mixed zone with a tendency toward risk-on.
New Year, Clean Balance Sheet
Telefónica faces 2026 with a cleaner balance sheet and with Spain and Brazil as strategic pillars. The key will be to transform accounting clean-up into sustainable growth.
*******************************************************************************************
The information provided does not constitute investment research. The material has not been prepared in accordance with the legal requirements designed to promote the independence of investment research and such should be considered a marketing communication.
All information has been prepared by ActivTrades ("AT"). The information does not contain a record of AT's prices, or an offer of or solicitation for a transaction in any financial instrument. No representation or warranty is given as to the accuracy or completeness of this information.
Any material provided does not have regard to the specific investment objective and financial situation of any person who may receive it. Past performance and forecasting are not a synonym of a reliable indicator of future performance. AT provides an execution-only service. Consequently, any person acting on the information provided does so at their own risk. Political risk is unpredictable. Central bank actions can vary. Platform tools do not guarantee success.
ACS - Housing in Spain: Regulatory Pressure and RisksHousing in Spain: Regulatory Pressure and Risks for Listed Companies
Ion Jauregui – Analyst at ActivTrades
The rental housing market in Spain is at a critical juncture. While authorities announce new allocations for the National Housing Plan and other stimulus measures, developers are warning of an immediate problem: public tenders of insufficient scale, rigid urban planning, and financial structures that hinder the viability of affordable housing. It is even estimated that up to 40,000 rental units could disappear from the market in the coming years. The imbalance is not in demand. Demographic pressure and concentration in major urban centers maintain a structural need for housing. The real bottleneck lies in supply, and above all, in regulatory uncertainty.
The Build to Rent (BTR) model, key to expanding the rental housing stock, faces an increasingly complex equation: construction costs have risen from €900 to €1,300 per square meter in a few years, target yields hover around 4%-4.25%, and VAT on rental projects is non-deductible. Under these conditions, many developments barely cover debt, limiting their attractiveness to institutional capital.
In this context, listed companies such as Neinor Homes and Aedas Homes rely on legal stability and larger tenders to maintain their strategy linked to institutional investors. Metrovacesa is particularly exposed to urban planning timelines and the effective transformation of land. For groups like ACS or Sacyr, a shift toward large-scale public-private concessions could have a significantly positive impact.
ACS Hits Record Highs and Maintains Uptrend (Ticker: ACS)
ACS shares continued their upward trajectory, reaching €107.7 this Friday, a record high following a consolidation phase between €91.65 and €97.45 during the quarterly dividend payment. The stock demonstrates the strength of a long-term uptrend, supported by key technical indicators.
The 50-, 100-, and 200-period moving averages support the price and are expanding, confirming that the momentum is not temporary. The MACD maintains a positive bias, while the RSI, at 68.9%, indicates there is still room to move higher before entering overbought territory.
Key reference levels include supports at €100.7 and €97.45, critical for maintaining the trend. Immediate resistance lies at the current highs, where consolidation is likely before the stock attempts new levels.
From an operational perspective, ACS maintains a solid technical structure, with signals of continuing upward momentum favorable for medium- and long-term investors. According to the ActivTrades Europe Market Pulse, risk remains neutral, though Risk-on is rising slightly, supporting interest in momentum-driven stocks.
With strong fundamentals — net profit of €655 million over nine months in 2025 and revenues of €36,753 million — the stock combines robust fundamentals with technical strength pointing upward. In short, ACS consolidates as one of the strongest Ibex 35 stocks, with clear support levels protecting positions and momentum favoring the continuation of the uptrend.
Market Outlook
The sector faces two contrasting scenarios: regulatory simplification and increased public investment — which would reduce risk premiums — or intervention and administrative delays, which would pressure margins and valuations. In 2026, the determining factor will not be demand, but the institutional capacity to unlock land, capital, and legal certainty.
*******************************************************************************************
The information provided does not constitute investment research. The material has not been prepared in accordance with the legal requirements designed to promote the independence of investment research and such should be considered a marketing communication.
All information has been prepared by ActivTrades ("AT"). The information does not contain a record of AT's prices, or an offer of or solicitation for a transaction in any financial instrument. No representation or warranty is given as to the accuracy or completeness of this information.
Any material provided does not have regard to the specific investment objective and financial situation of any person who may receive it. Past performance and forecasting are not a synonym of a reliable indicator of future performance. AT provides an execution-only service. Consequently, any person acting on the information provided does so at their own risk. Political risk is unpredictable. Central bank actions can vary. Platform tools do not guarantee success.
 Long
Long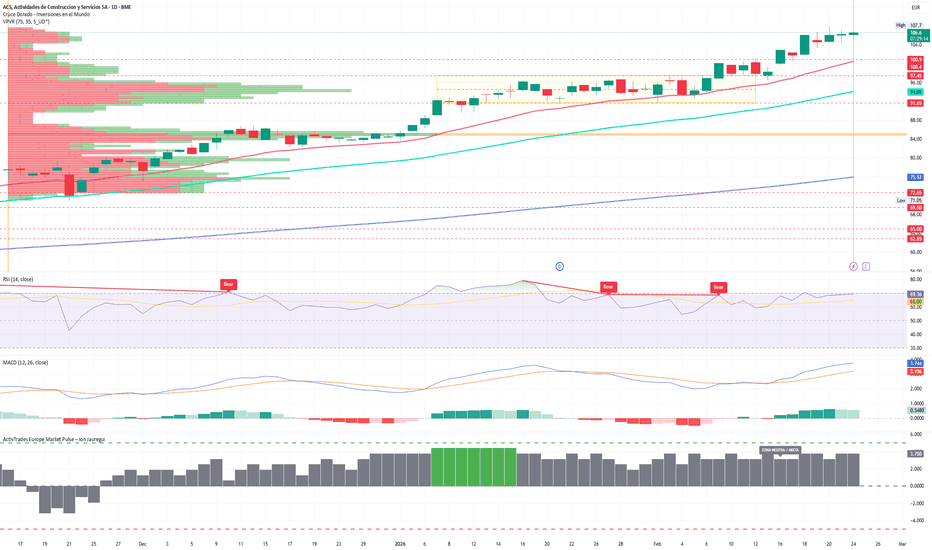
 Long
Long
Repsol closes with solid performance seting higher 2026 dividendRepsol closes the year with solid performance and sets a higher dividend for 2026
Ion Jauregui - Analyst at ActivTrades
Repsol closed 2025 with a net profit of €1.899 billion, up 8% from 2024, demonstrating resilience in a year marked by lower crude prices, elevated energy volatility and an uncertain geopolitical environment.
Adjusted net income — the company’s key metric to measure underlying business performance — reached €2.568 billion, down 15% year-on-year, mainly reflecting the impact of an average Brent price of $69.1 per barrel (-14.5%) and weaker margins in certain industrial segments.
The broader interpretation is not one of structural deterioration, but rather a normalization of the energy cycle following the extraordinary years that followed the global supply crisis.
Stable upstream, pressured downstream
The Exploration & Production division contributed €957 million in adjusted net income, with average production of 548,000 barrels of oil equivalent per day, in line with company guidance. The start-up of the León Castilla field in the Gulf of Mexico and progress in assets in Bolivia and Trinidad and Tobago reinforce geographic diversification and production stability.
In contrast, the Industrial division reported €963 million (-33%), affected by raw material volatility and weaker chemical margins. However, the fourth quarter showed a significant recovery in refining, generating €423 million (+66% year-on-year), pointing to a progressive improvement in margins toward year-end.
Customer and Low-Carbon Generation: the transformation axis
The Customer division continues to consolidate its position as one of the group’s core pillars, delivering €754 million in adjusted net income (+17%) and EBITDA of €1.423 billion (+20%). The company surpassed 3 million electricity and gas customers in Spain and Portugal after adding more than 500,000 new contracts during the year, while digital customers reached 10.8 million.
This growth is strategically relevant: it progressively reduces dependence on crude price cycles and strengthens recurring cash flow generation.
In Low-Carbon Generation, adjusted net income amounted to €53 million, improving by €77 million versus 2024. During the year, 2,200 MW were brought online, raising total installed capacity to 5,900 MW. Although its contribution to consolidated earnings remains limited, the growth trajectory is clear and strategically aligned with the energy transition.
Financial discipline and a growing dividend
One of the most relevant messages from the year is shareholder remuneration. In 2025, Repsol distributed €0.975 gross per share (+8.3%) and executed share buybacks and cancellations totaling €700 million.
For 2026, the company plans to increase the dividend to €1.051 per share (+7.8%) and allocate around €1.9 billion to total shareholder remuneration, including a new buyback program of up to €350 million. Repsol is therefore reinforcing a clear shareholder-return profile.
The balance sheet remains solid, with €10.271 billion in liquidity and net debt of €4.487 billion under the new segment reporting model, adopted to enhance international comparability and better reflect the growing weight of joint ventures and minority interests.
Technical Analysis – Repsol (Ticker AT: REP)
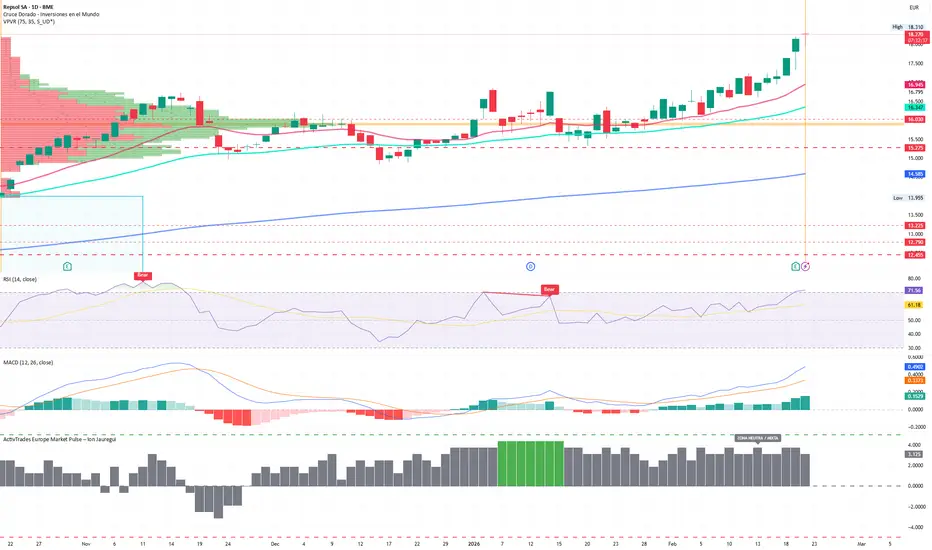
Since late January, the stock has developed a clearly bullish structure, breaking above the key resistance level at €16.795 and extending the move to recent highs of €18.310. The technical breakout has been structurally clean, although the latest bullish session occurred on relatively lower volume, suggesting some short-term loss of buying intensity.
From an indicator perspective:
RSI (14) at 71.11%: in overbought territory, increasing the probability of a short-term pause or consolidation.
MACD: maintains a positive crossover and upward slope, confirming ongoing bullish momentum.
This setup suggests that, while the primary trend remains bullish, the stock may enter a digestion or sideways phase before attempting a further extension.
The previous range’s Point of Control (POC) is located around €15.9, a former equilibrium area that now acts as a key structural support. As long as price remains above the former breakout level (€16.795), the technical bias remains constructive.
The stock is currently in a technical “blue-sky breakout” situation, with no relevant horizontal resistance levels above. In this context, the market is likely to attempt to build a new acceptance area above the former resistance. Should buying flow weaken, the most reasonable corrective scenario would be a technical pullback toward the breakout zone to validate it as support.
Meanwhile, the ActivTrades Europe Market Pulse indicator signals a neutral risk environment in equities, albeit with a slight tilt toward an unconfirmed risk-off bias. This macro sentiment backdrop reinforces the view that any deterioration in risk appetite could accelerate profit-taking in technically overbought assets such as this one.
In conclusion, the structure remains bullish, but short-term consolidation signals are emerging before any potential continuation of the trend.
Looking ahead to 2026–2028
Production guidance for 2026 stands between 560,000 and 570,000 barrels of oil equivalent per day. Even more relevant will be the strategic update scheduled for the March Capital Markets Day, where the market will seek greater visibility on the renewables business and the potential “liquidity event” in this segment.
In a more moderate energy price environment, the key question will be whether growth in the Customer and Low-Carbon Generation divisions can structurally offset industrial and upstream volatility.
Repsol enters 2026 with a dividend already above €1 per share, a solid balance sheet and a more diversified business structure. The market will now assess whether this energy transition strategy begins to translate into a structural premium versus companies more dependent on the crude cycle.
*******************************************************************************************
The information provided does not constitute investment research. The material has not been prepared in accordance with the legal requirements designed to promote the independence of investment research and such should be considered a marketing communication.
All information has been prepared by ActivTrades ("AT"). The information does not contain a record of AT's prices, or an offer of or solicitation for a transaction in any financial instrument. No representation or warranty is given as to the accuracy or completeness of this information.
Any material provided does not have regard to the specific investment objective and financial situation of any person who may receive it. Past performance and forecasting are not a synonym of a reliable indicator of future performance. AT provides an execution-only service. Consequently, any person acting on the information provided does so at their own risk. Political risk is unpredictable. Central bank actions can vary. Platform tools do not guarantee success.
Inditex joins the pressure against Shein and TemuIon Jauregui — Analyst at ActivTrades
Inditex, together with Mango and other major players in the textile sector, has joined El Corte Inglés and Carrefour in calling on national governments and the European Commission to take urgent action against what they consider unfair competition from platforms such as Shein and Temu. This initiative is being channelled through the industry association Arte, which represents Europe’s leading textile companies.
The core of the complaint lies in the asymmetry in compliance with tax, labour, and product safety regulations. According to Arte, the rapid growth of Asian e-commerce—driven by the massive inflow of low-value shipments—has overwhelmed the control capacity of European authorities. This situation not only undermines the competitiveness of local companies but also poses direct risks to consumer safety and health.
The figures support these concerns. In 2024, 4.6 billion low-value shipments entered the European Union, with a 36% year-on-year increase in the number of consumers using these platforms. The association argues that a significant portion of these products enters the EU market without adequate controls or effective compliance with European standards.
In response, the sector is calling for a set of concrete measures:
Effective enforcement of existing regulations before introducing new ones.
Stronger customs controls and traceability, supported by technological solutions.
The introduction of fees on low-value imports, such as the €3 per package charge that the EU plans to apply from 1 July to shipments below €150.
Sanctions and market access restrictions for platforms that repeatedly fail to comply with regulations.
Implications for Inditex
From a competitive standpoint, this initiative has important implications for Inditex. The group operates under a model focused on quality control, traceability, logistical efficiency, and strict regulatory compliance. As such, stricter enforcement of the rules does not represent an operational disadvantage. On the contrary, it could help rebalance the market against business models based purely on volume and low cost, supported by regulatory loopholes.
While this is not an immediate catalyst for earnings, it represents a positive structural factor in the medium term—particularly if the European Union moves toward more effective customs controls and more consistent enforcement of regulations across all 27 Member States.
Technical analysis of Inditex (Ticker: ITX.ES)
From a technical perspective, Inditex maintains a long-term primary uptrend. The price is trading above the 50- and 100-day moving averages, confirming underlying strength. After reaching all-time highs at €58.07, the stock has entered a phase of orderly consolidation.
The RSI stands around 63.5%, showing no signs of overbought conditions or bearish divergences, while the MACD remains in positive territory, supporting trend continuation. A key support area is located around €53.77, coinciding with the 50-day moving average and the zone from which the last bullish impulse began.
If the price clearly breaks above recent highs, the technical outlook points to a potential extension toward the €60 level. Otherwise, a further correction could lead to a retest of support, with the next relevant level at €52.21. For now, there are no clear signs of exhaustion, and the most likely scenario remains one of continued upside.
Conclusion
The pressure from European commerce against Shein and Temu is not an isolated episode, but rather a coordinated effort to correct regulatory imbalances that have intensified in recent years. In this context, Inditex starts from a solid position, both fundamentally and technically, within a competitive environment that could evolve more favourably over the coming quarters.
*******************************************************************************************
The information provided does not constitute investment research. The material has not been prepared in accordance with the legal requirements designed to promote the independence of investment research and such should be considered a marketing communication.
All information has been prepared by ActivTrades ("AT"). The information does not contain a record of AT's prices, or an offer of or solicitation for a transaction in any financial instrument. No representation or warranty is given as to the accuracy or completeness of this information.
Any material provided does not have regard to the specific investment objective and financial situation of any person who may receive it. Past performance and forecasting are not a synonym of a reliable indicator of future performance. AT provides an execution-only service. Consequently, any person acting on the information provided does so at their own risk. Political risk is unpredictable. Central bank actions can vary. Platform tools do not guarantee success.
Santander distances itself from European acquiring WebsterSantander distances itself from European banking with the acquisition of Webster in the U.S.
By Ion Jauregui – Analyst at ActivTrades
Banco Santander has taken a decisive step in its international growth strategy with the acquisition of Webster Bank for €10.3 billion, one of the largest cross-border banking transactions of the last decade. According to LSEG data, the transaction ranks as the third largest since 2016, surpassed only by BMO’s acquisition of Bank of the West and HSBC’s purchase of Hang Seng Bank, highlighting the scale and ambition of the move.
The transaction becomes even more relevant when viewed within the sectoral context. In recent years, several European banks have chosen to scale back from the U.S. market due to intense competition and capital requirements. BNP Paribas, BBVA, and HSBC itself reduced or sold their U.S. retail businesses, prioritizing balance sheet optimization and short-term profitability. Santander, however, adopts a countercyclical strategy, betting on scale, geographic diversification, and structural profitability in the world’s largest economy.
From an operational standpoint, Webster fits strategically into the group’s model, allowing a rebalancing of the credit portfolio: a lower weight in consumer lending and greater exposure to corporate banking and the mortgage segment, traditionally more stable and with a better risk–return profile. This acquisition is part of a broader roadmap designed by Ana Botín—together with the acquisition of TSB and the sale of the Polish subsidiary—aimed at achieving a RoTE of 20% by 2028.
From a market perspective, the initial reaction is usually contained. The rebound in cross-border banking M&A in the first weeks of the year, already exceeding $13 billion, contrasts with a particularly active 2024, which explains a more selective investor reading of large-scale transactions.
Technical analysis of Banco Santander (Ticker: SAN)
From a technical perspective, the stock maintains a long-term bullish structure, although in the short term it has entered a corrective phase toward the 50-day moving average, after marking historical highs this month supported by strong corporate results. The price is currently respecting the key support area around €10.12, the origin of the last bullish impulse.
The most likely short-term scenario is a sideways movement, allowing the market to digest both the earnings results and the Webster acquisition before resuming the primary trend. The volume profile shows a relevant point of control around €8.80, while the next reference areas are located at €9.60–€9.90 (2025 highs) and €10.48, a high-volume area close to the current price.
Regarding indicators, the RSI has corrected the recent strong overbought condition and now sits at neutral levels, while the MACD reflects a loss of bullish momentum, consistent with a consolidation process. A sustained break above historical highs would confirm the continuation of the long-term move, while a clear loss of key supports would open the door to corrections toward the previously mentioned price areas. The ActivTrades Europe Market Pulse indicator signals an increase in risk, although still within a mixed zone, partially linking the stock’s evolution to the broader European equity market tone.
A countercyclical bet in a transforming sector
While a large part of European banking opts for caution and international retrenchment, Santander chooses to grow where others withdraw. In an environment of economic slowdown in Europe, regulatory pressure, and tighter margins, the bet on the United States reflects a long-term structural growth vision, supported by scale, diversification, and operational efficiency.
In the short term, the market will continue to assess integration risks and capital consumption. However, in the medium and long term, the transaction strengthens Santander’s strategic profile in an increasingly concentrated global banking sector, where only institutions with size, international presence, and adaptability will be able to sustain high levels of profitability.
*******************************************************************************************
The information provided does not constitute investment research. The material has not been prepared in accordance with the legal requirements designed to promote the independence of investment research and such should be considered a marketing communication.
All information has been prepared by ActivTrades ("AT"). The information does not contain a record of AT's prices, or an offer of or solicitation for a transaction in any financial instrument. No representation or warranty is given as to the accuracy or completeness of this information.
Any material provided does not have regard to the specific investment objective and financial situation of any person who may receive it. Past performance and forecasting are not a synonym of a reliable indicator of future performance. AT provides an execution-only service. Consequently, any person acting on the information provided does so at their own risk. Political risk is unpredictable. Central bank actions can vary. Platform tools do not guarantee success.
 Long
Long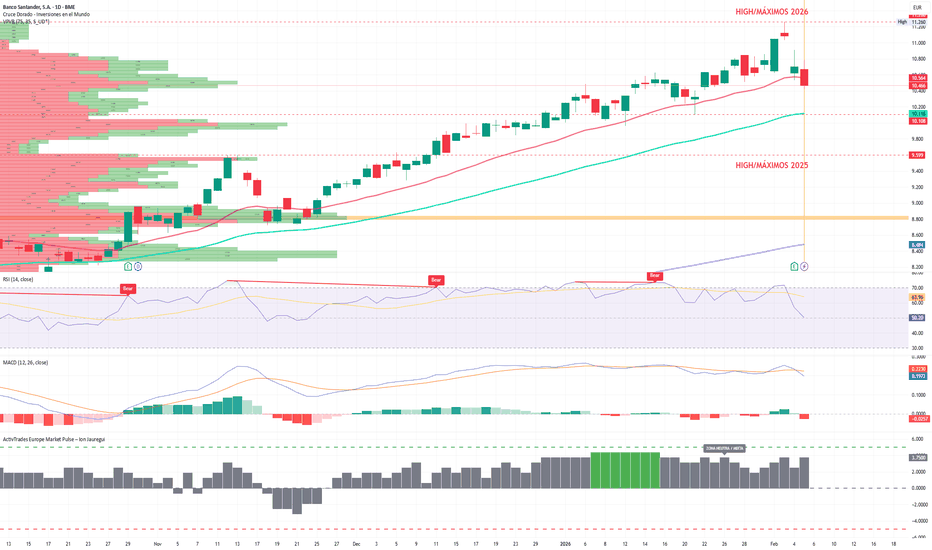
Naturgy, the Strategic Shift Following BlackRocks DivestmentBy Ion Jauregui – Analyst at ActivTrades
Movements within Naturgy’s shareholder structure are once again attracting market attention—and with good reason. BlackRock, through GIP, has decided to sell 7.1% of its stake via an accelerated bookbuild valued at approximately €1.7 billion. This operation not only closes a chapter for the fund but also opens a significant transition phase for the company itself.
GIP entered Naturgy a decade ago, paying €19 per share. Now, after years of dividends and with an exit price expected to be close to €26, BlackRock will crystallize a substantial capital gain. The fund has also committed to a 90-day lock-up period on further sales, providing a short-term buffer of stability as the shareholder base is reshaped.
This adjustment has clear implications: it reduces the chances of a new player—such as the Emirati company Taqa—entering the capital structure, while facilitating a potential exit by CVC, which has been evaluating options for some time. Board changes are also expected, as GIP currently holds three seats and will likely have to relinquish one.
These developments come at a particularly sensitive moment for Naturgy. The company is approaching the start of a new regulatory period for natural gas assets—an area that will significantly influence its future profitability. Moreover, this year Naturgy regained its position in MSCI indices after increasing its free float, a key requirement for attracting institutional capital.
Operationally, Naturgy is performing well. During the first nine months of the year, the company posted a net profit of €1,668 million, 5.6% higher than in 2024. EBITDA remains near historic highs at €4,214 million, and the expected dividend for the fiscal year stands at €1.70 per share, reinforcing Naturgy’s commitment to shareholders.
Technical Analysis (Ticker: NTGY)
From a technical perspective, the stock has shown solid performance throughout the year, even reaching all-time highs at €27.74, which has acted as a natural ceiling. Support within the current range sits around the 200-day moving average near €25.18, while the base of the April bullish impulse is at €22.24.
A shoulder-type formation has driven the 50-day moving average below the 100-day, a pattern that may indicate a potential downward correction over the coming week and even in today’s session. Trading opened with rising volume, an oversold RSI at 27.81%, and a MACD below a negative histogram.
Looking at the medium-term structure, the outlook remains constructive—provided the market absorbs the BlackRock stake placement smoothly. In that scenario, Naturgy could resume its upward trend toward the €28–30 range. However, if the price is once again rejected near €27, a corrective move back toward the lower bound of the channel would not be surprising, especially given the still-uncertain regulatory context.
The Exit Should Not Weaken the Company
BlackRock’s partial divestment should not weaken Naturgy; if anything, it may mark the beginning of a new chapter for the company—one in which shareholder rebalancing coincides with regulatory developments that will directly influence its valuation. With a solid business, strong cash-generation capacity, and an attractive dividend policy, Naturgy remains a stock worth monitoring closely.
The coming months will be decisive. The key will lie in how the company manages the balance between shareholder transition, regulatory pressures, and strategic ambition. What is clear is that Naturgy, once again, finds itself at a turning point.
*******************************************************************************************
The information provided does not constitute investment research. The material has not been prepared in accordance with the legal requirements designed to promote the independence of investment research and such should be considered a marketing communication.
All information has been prepared by ActivTrades ("AT"). The information does not contain a record of AT's prices, or an offer of or solicitation for a transaction in any financial instrument. No representation or warranty is given as to the accuracy or completeness of this information.
Any material provided does not have regard to the specific investment objective and financial situation of any person who may receive it. Past performance and forecasting are not a synonym of a reliable indicator of future performance. AT provides an execution-only service. Consequently, any person acting on the information provided does so at their own risk. Political risk is unpredictable. Central bank actions can vary. Platform tools do not guarantee success.
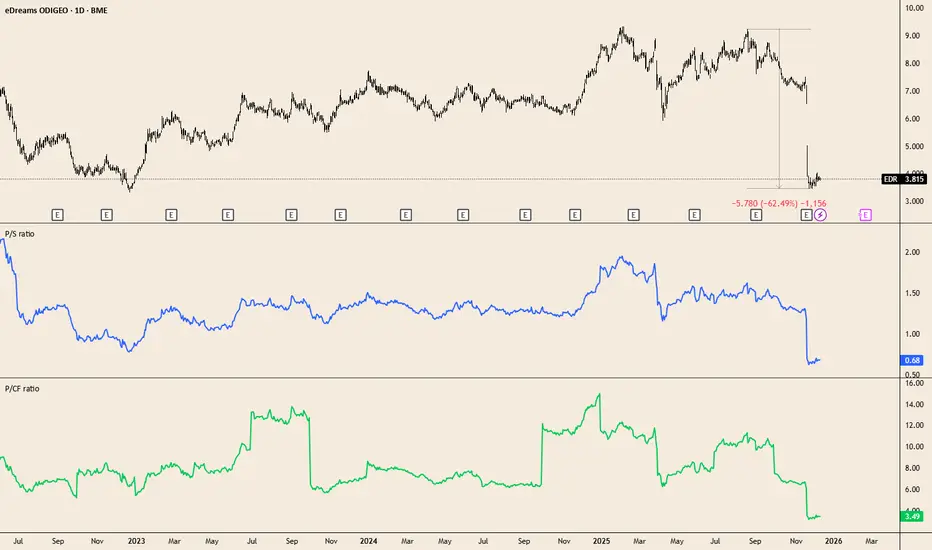
eDreams: A 60% Crash That Multiples Alone Can’t ExplainThe selloff in $BME:EDRis one of the sharpest valuation resets in European mid-caps this year. What makes it notable is that the collapse wasn’t driven by weakening fundamentals, but by a sudden shift in how the market interprets the subscription model.
After announcing the move from annual upfront Prime payments to monthly/quarterly instalments, investors didn’t just trim guidance — they repriced the entire model. The effect on valuation is clear:
• P/S falls to 0.68, back to deep-value territory
• P/CF drops to 3.49, driven by cash-timing effects, not weaker operations
• The stock is down 60%+ from the highs as the narrative flips to “execution risk”
Meanwhile, the fundamentals are moving in the opposite direction:
• Prime members up +18% YoY to 7.7M
• H1 Cash EBITDA up +16%
• FY26 Adjusted EBITDA guided to +29%, reaching €172.9M (record level)
• Strong capital returns with €100M in buybacks planned
The disconnect is striking:
the business continues to scale, but the narrative has collapsed.
The setup now becomes a valuation dilemma:
• If instalment payments are purely a timing shift, today’s multiples imply significant mispricing
• If execution challenges persist (Ryanair blocking, product diversification, international scaling), the discount may be justified
The chart highlights it clearly: price has imploded far more violently than the company’s fundamentals.
Is the market overreacting to optics — or correctly pricing a tougher road ahead?
#EDR #Equities #SpainStocks #TravelTech #Valuation #Markets  Long
Long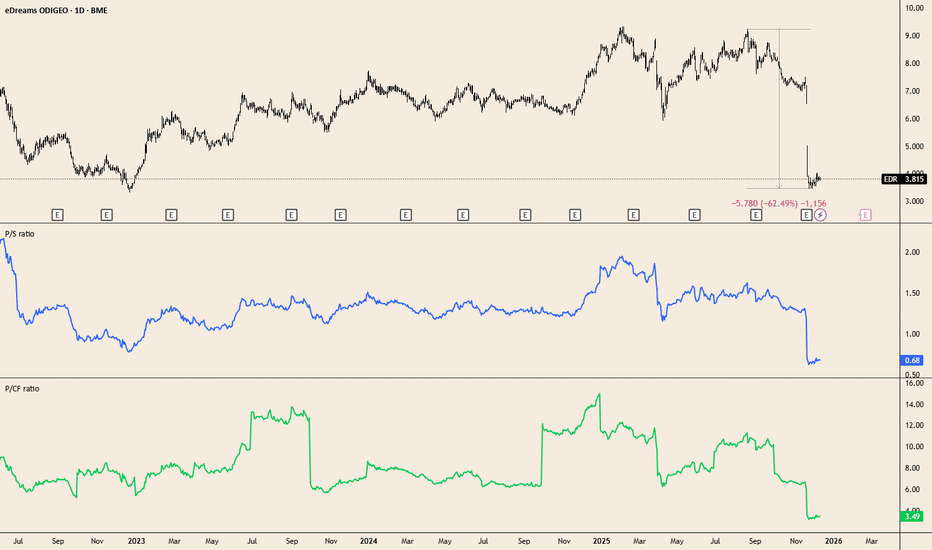
Iberdrola: Doubts over electricity bill reduction Iberdrola: Doubts over electricity bill reduction shape the sector’s outlook for 2026
The Government’s forecast of a 4.66% reduction in household electricity bills in 2026 has raised skepticism among major utilities. The Executive’s estimate is based on a drop in wholesale prices reflected in OMIP futures (56.7 €/MWh), but the sector anticipates higher figures: Astral Energie projects 61 €/MWh, while Ecoflow places it between 65–85 €/MWh.
Adding to this divergence is a significant rise in regulated charges and tariffs: almost €1.6 billion more in 2026, including a 4.1% increase in network remuneration and a 10.5% rise in renewable energy charges. This increase in fixed costs clearly limits any reduction in the final bill.
The system continues to operate in reinforced mode, generating nearly €5 billion in management costs and renewable curtailments, directly affecting the performance of Iberdrola’s solar and wind assets.
Fundamental Analysis
For Iberdrola, 2026 appears as a bullish year, with a rise of nearly 40% reaching historic highs in November, trading up to €18.28, with some natural corrections along the way. Recent adjustments have occurred naturally following developments reflected in its latest quarterly report.
Positive: Increased network remuneration — its most stable business — and international diversification, which cushions local risks.
Negative: Regulatory pressure, renewable curtailments reducing margins, and gas prices that could keep marginal costs high.
The group maintains a solid foundation, but its renewable business in Spain faces a reduced profitability environment if reinforced mode operations and new charges are consolidated.
Technical Analysis
The stock maintains a bullish bias as long as it stays above €14.75. It closed Friday near €17.94.
Resistance: Historic high at €18.28, with a target of €18.5.
Key support: €16.8, marking the resistance of the previous sideways range; a breakdown could trigger a corrective phase toward the control point at €15.67.
With the price supported by the 50-day moving average and trading above the 100- and 200-day averages, Iberdrola maintains positive momentum, though conditioned by regulatory uncertainty. According to the ActivTrades Europe Market Pulse, Risk On has started to rise gradually, though it remains in neutral territory, suggesting potential investor appetite in the coming rally weeks.
*******************************************************************************************
The information provided does not constitute investment research. The material has not been prepared in accordance with the legal requirements designed to promote the independence of investment research and such should be considered a marketing communication.
All information has been prepared by ActivTrades ("AT"). The information does not contain a record of AT's prices, or an offer of or solicitation for a transaction in any financial instrument. No representation or warranty is given as to the accuracy or completeness of this information.
Any material provided does not have regard to the specific investment objective and financial situation of any person who may receive it. Past performance and forecasting are not a synonym of a reliable indicator of future performance. AT provides an execution-only service. Consequently, any person acting on the information provided does so at their own risk. Political risk is unpredictable. Central bank actions can vary. Platform tools do not guarantee success.
 Long
Long
Inditex leads gains in Europe after a strong start to the winterInditex leads gains in Europe after a strong start to the winter sales
Ion Jauregui – Analyst at ActivTrades
European stock markets closed yesterday, Wednesday, practically flat, but Inditex captured all the market’s attention with a rise of 8.9%, the biggest gain in the STOXX 600 and enough to lift the Spanish index by 0.7% compared with the mixed tone across the rest of the continent. The Galician group, parent company of Zara, reached almost one-year highs after presenting a solid start to the fourth quarter. According to company data, sales at constant currency grew 10.6% in November, a month that includes the Black Friday weekend, one of the periods of highest commercial activity of the year. The figure comfortably exceeded market estimates and offered an early reading of a more resilient-than-expected level of consumption within the European retail sector.
In parallel, business activity in the eurozone reached its highest level in two and a half years, with a composite PMI rising from 52.5 to 52.8 points, supported by the services sector. This macro context contributed to improving investor sentiment, although the session was marked by declines in banking and gains in technology and defense.
Fundamental: Inditex strengthens its leadership
The strong growth in November confirms Inditex’s good operating momentum. Its integrated design, logistics, and sales model—one of the most agile in the sector—allows it to adjust collections quickly and maintain competitive margins even during discount periods. The company thus once again positions itself as a global fast-fashion reference and faces the Christmas season with solid demand.
Technical: resistance breakout and bullish signal
On the technical side, the share yesterday clearly managed to break, with a fast engulfing pattern, the November resistance zone that had limited gains in recent weeks. The move was accompanied by significant volume, and today’s session opened with a positive candle that reached the resistance areas from last December, on exactly the same day of the year. If this former resistance is pierced and becomes a relevant support, we could see an upward move with a clearly bullish bias in the short term, targeting 60 euros per share. Looking at sentiment indicators, the RSI at 77.27% is in clear overbought territory, and the MACD is in a positive movement cycle. Meanwhile, the moving average crossovers support the bullish development of the last two days, reinforcing the latest push above the 50-day moving average around the last resistance above 50 euros. If this evolution is halted in the coming sessions, we could see another corrective move similar to that of 2024, which could drive the share back towards 52 euros.
On the other hand, the ActivTrades Europe Market Pulse indicator shows that risk is in neutral territory but with a slight increase in speculative volatility.
Conclusion
Inditex begins the session as a clear benchmark in the European market, supported by solid sales and convincing technical momentum. Although the share faces resistances that could trigger some consolidation, the bias remains bullish, keeping the company among the strongest stocks at this end of the year.
*******************************************************************************************
The information provided does not constitute investment research. The material has not been prepared in accordance with the legal requirements designed to promote the independence of investment research and such should be considered a marketing communication.
All information has been prepared by ActivTrades ("AT"). The information does not contain a record of AT's prices, or an offer of or solicitation for a transaction in any financial instrument. No representation or warranty is given as to the accuracy or completeness of this information.
Any material provided does not have regard to the specific investment objective and financial situation of any person who may receive it. Past performance and forecasting are not a synonym of a reliable indicator of future performance. AT provides an execution-only service. Consequently, any person acting on the information provided does so at their own risk. Political risk is unpredictable. Central bank actions can vary. Platform tools do not guarantee success.
 Long
Long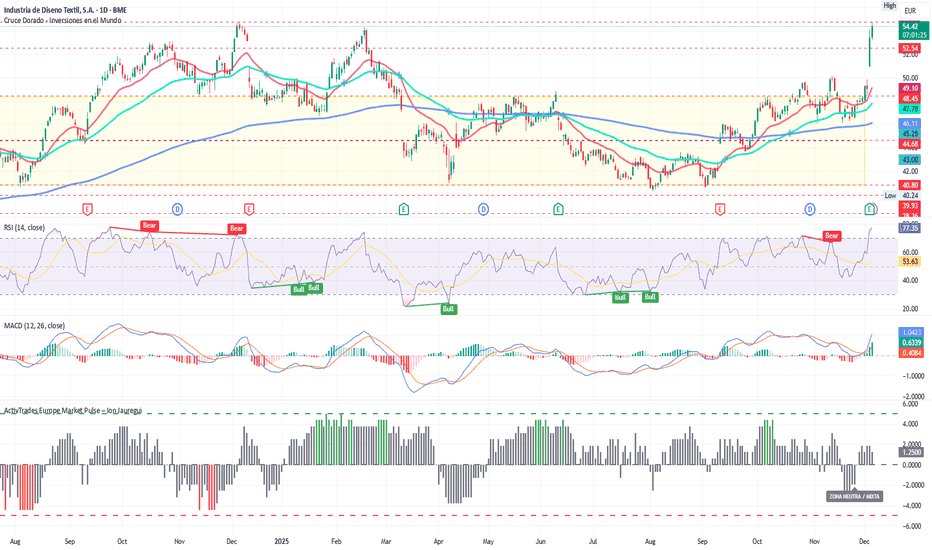
Understanding Bull & Bear Flags: A Practical Guide for TradersUnderstanding Bull & Bear Flags: A Practical Guide for Traders
1. What Are Bull and Bear Flags?
Bull and bear flags are continuation patterns.
A bull flag forms after a strong upward impulse. Price pauses, drifts slightly downward or sideways, and builds a controlled consolidation channel. When it breaks upward again, the trend continues.
A bear flag is the opposite. After a sharp downward leg, price retraces upward inside a tight rising channel. When it breaks down again, the downtrend resumes.
Both structures show the same market behavior:
A temporary pause before the dominant trend returns with force.
Most traders know bull flags. Far fewer pay real attention to bear flags, but only professionals identify & trade them properly.
2. How to Spot Them (and My Checklist to Validate Them)
Spotting them is simple once you know the key ingredients:
A strong pole: a clear previous directional move with momentum. As previous examples.
Two parallel lines: price consolidates inside a small channel.
At least 2–3 touches on each boundary. This is a MUST ! One of the most famous guides for Bull/Bears flag fail to check this pointthat , so any movement of the market is a potential Flag! So, teaches you to trade FAKE patterns.
Volume contraction during the flag. Not a must, but interesting to check.
A decisive breakout: ideally supported by volume expansion.
My Bull/Bear Flag Checklist:
✔ Strong impulsive move (clean pole)
✔ Tight consolidation (not messy, not sloppy)
✔ Clear parallel lines
✔ A minimum of 4–6 total contact points
✔ Breakout candle with strength
✔ Retest (pullback) optional, but if it appears, even better
✔ Risk clearly defined below/above the flag (easy, the pattern always offer you a place for SL)
If all of these align, probabilities rise dramatically. Let's see an example:
3. How Much Can I Make With a Bull Flag?
Traders often underestimate the power of this pattern.
A bull flag’s measured target is usually:
Height of the pole → projected from the breakout point. This is the classic projection, but deciding the height of the pole is imposible, there are so many possibilities.
I do prefer to project the height of the channel, much clearer.
In strong momentum markets, price often exceeds the projection of 100% and you can see 161,8% or more.
This is because the flag is essentially a pause in trend, not a reversal attempt. When buyers regain control, they push aggressively.
Typical outcomes:
Conservative target: 1× the channel
Aggressive target: 1.5–2× the channel
In exceptional momentum: 3× or more
And remember: momentum breakouts rarely return inside the flag.
Once it runs, it runs.
4. When Should I Trade Them?
The best moment is:
A. On the breakout
Clean, simple, momentum-based entry. Stop-loss goes just outside the flag.
B. On the retest or pullback (if it happens)
Often the safest entry. Not always available.
C. Never before the breakout
Trading “inside the flag” is gambling. Wait for confirmation. Let the market show its hand. You want to hunt, not to be HUNTED.
5. Real Case: Inditex and Its Three Bull/Bear Flags
Inditex offered a fantastic real-world example.
During August and early September, the market had mixed opinions:
Growth was slowing.
FX conditions were challenging.
Analysts doubted Inditex could maintain 2024-style strength.
Conservative guidance overall. Investors expected nothing spectacular for early autumn.
Not bearish, maybe unimpressed.
The market was forming a Bull and a Bear flag at the same time!
A bigger bull flag showing that in the long term the feeling with BME:ITX was bullish but a short term bear flag showing doubts for the upcoming weeks.
What Happened in September? The Surprise
Inditex published unexpectedly strong numbers and suddenly, sentiment among investors flipped.
And exactly when the fundamentals turned, the chart delivered a CLEAR AND CLEAN decision:
Flag #1 – A break of the big bull flag meaning that investors where ready to start a new bull cycle in Inditex.
Flag #2 – A break of a BEAR flag in the opposite direction. This is perfectly possible , and even though we call it a BEAR flag, if it breaks in the opposite direction it means that all the doubts suggesting lower prices were completely obliterated.
This is a perfect educational example of technical and fundamental alignment.
6. Recent Case: AAPL Bull Flag
NASDAQ:AAPL has recently formed a textbook bull flag and compliance with the checklist.
Strong upward pole
Clear, parallel consolidation
Multiple touch points
Tight structure
Powerful Breakout
I’ve published a full idea on this setup, you can see more here:
🚀 If you liked this post, feel free to find more educational content in my firm! I share chart patterns, case studies, and real trading setups every week for free.
Have you ever traded bull flags before? Education