Redeia (REE) blackout and market reactionBy Ion Jauregui – ActivTrades Analyst
Redeia (REE), operator of the Spanish electricity system and a member of the Ibex 35, has returned to the media and regulatory spotlight following the recent blackout that affected much of the southwestern part of the country. Although the government praised Red Eléctrica’s technical management during the event, everything points to a planning error in the electricity mix that left the system without sufficient response capacity during a period of high renewable energy production.
The incident occurred with more than 70% of the energy mix generated by renewable sources, particularly solar and wind, which lack the inertia provided by conventional technologies such as hydro or thermal. The absence of sufficient synchronous capacity and effective storage systems made it difficult to maintain frequency and voltage balance, triggering a preventive disconnection of part of the grid. This has reopened the debate on the urgent need for investment in technologies that can provide system stability, such as batteries and hybrid generation.
Solid fundamentals, but under closer scrutiny
Despite the episode, Redeia’s financial fundamentals remain strong. In its latest quarterly report, covering the end of 2024, the company reported:
• Revenue: €2.17 billion (+3.2% year-on-year)
• EBITDA: €1.65 billion
• Net profit: €680 million (+1.7%)
• Net debt: €4.9 billion, with a stable debt/EBITDA ratio of 3x
The company maintains a stable shareholder remuneration policy, with a dividend of €1 per share expected in 2025, representing a dividend yield of around 5.5% at current prices.
Additionally, Redeia continues with its 2021–2026 strategic plan, which includes a total investment of €4.4 billion, 75% of which is allocated to grid modernization, renewable integration, and storage systems. The company has reinforced its role as a facilitator of the energy transition, but incidents such as the recent blackout highlight that operational planning and technical capabilities must evolve in step with renewable growth.
Market reaction
Following the blackout, Redeia’s share price corrected by 2.3% over two sessions, settling around €18.10, although it still shows positive performance year-to-date. Volatility has slightly increased, reflecting uncertainty about potential regulatory consequences or adjustments to oversight mechanisms. Nonetheless, a moderately positive view of the stock remains, given its defensive profile, low correlation with the economic cycle, and ability to generate stable cash flows.
Technically, the stock has been climbing above the support at €17.61. The gap-down correction on Wednesday does not appear likely to halt the expanding moving average trend that began on February 18. The point of control (POC) is located at €16.80 in the previous accumulation zone, but the current price formation does not seem constrained. A return to the path of recent highs would be reasonable. RSI is slightly oversold at 48.70%. Current delta zones are slightly above the current price, around €18.74, suggesting potential gains if news flow is supportive and avoids negative sentiment dragging the stock down.
In conclusion, the blackout represents a reputational and technical challenge for Redeia, but it does not significantly alter its financial profile. The medium-term key will be its ability to invest in operational resilience and maintain the confidence of both regulators and the market.
*******************************************************************************************
The information provided does not constitute investment research. The material has not been prepared in accordance with the legal requirements designed to promote the independence of investment research and such should be considered a marketing communication.
All information has been prepared by ActivTrades ("AT"). The information does not contain a record of AT's prices, or an offer of or solicitation for a transaction in any financial instrument. No representation or warranty is given as to the accuracy or completeness of this information.
Any material provided does not have regard to the specific investment objective and financial situation of any person who may receive it. Past performance is not reliable indicator of future performance. AT provides an execution-only service. Consequently, any person acting on the information provided does so at their own risk.
 Long
Long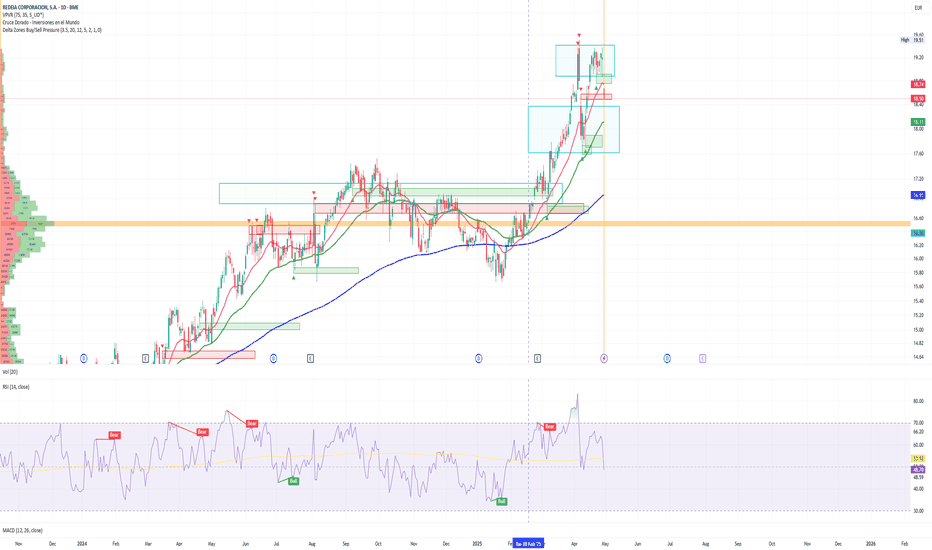
Aramco bets on e-fuels in Spainby Ion Jauregui - ActivTrades Analyst
Saudi Aramco (TADAWUL: 2222), the world’s largest oil company, is accelerating its transformation by heavily investing in synthetic fuels. The Saudi company has announced an investment of hundreds of millions of dollars in new e-fuel plants in Spain and Saudi Arabia, with the ambitious goal of reaching a production of 85,000 barrels per day by 2027. This is a strategic move that could significantly impact the Spanish business landscape, especially in energy and infrastructure sectors.
This push is not happening in isolation. Aramco has also acquired a 10% stake in Horse Powertrain, the joint venture formed by Renault (EPA: RNO) and Geely (HKG: 0175), focused on developing low-emission combustion engines. At the same time, it maintains collaboration agreements with BYD (HKG: 1211), the Chinese electric vehicle giant. With these maneuvers, Aramco seeks to consolidate its position in the global sustainable mobility market, diversifying its traditional reliance on crude oil.
Spain, a strategic pillar
The choice of Spain as one of the expansion hubs is not accidental. The country is becoming a European benchmark in green hydrogen and carbon capture projects—key technologies for the production of e-fuels. In addition, its renewable capacity and institutional commitment to decarbonization position Spain as a natural destination for this type of investment.
Although Aramco has not yet specified the exact locations of its plants, it is expected that the most advanced regions in renewables and industrial infrastructure, such as Andalusia or Aragon, could benefit from this wave of capital.
The main Spanish companies that could be affected are:
• Repsol (BME: REP): one of the leaders in synthetic fuel and biofuel research in Spain. Its energy transition strategy and experience in e-fuel projects position it as a potential competitor or strategic ally in this new stage.
• Cepsa (owned by Mubadala Investment Company and Carlyle Group (NASDAQ: CG)): focused on its “Positive Motion” plan to lead sustainable mobility, it could leverage the rise of synthetic fuels to strengthen its business.
• Iberdrola (BME: IBE) and Acciona Energía (BME: ANE): both companies lead the development of renewables in Spain and could be key green electricity providers for e-fuel production processes.
• Técnicas Reunidas (BME: TRE): a company specialized in engineering large-scale energy and industrial projects, it is a natural candidate to design and build the new plants driving this revolution.
REPSOL.ES Analysis
The oil company’s share price reached a peak in April last year, hitting 15.275 euros per share. It has since been correcting downward toward a low of 9.420 euros following tariff-related events and the decline in oil prices. The current range for the stock lies between 14 euros and 10.670 euros. In early trading hours, the share is quoted at 10.735 euros, slightly below the indicated range. The Point of Control (POC) is at 12.755 euros, the midpoint of the current triple bell curve and slightly above the support area of 12.455 euros. The RSI currently stands slightly underbought at 46.55%. The moving averages have not yet shown a directional shift; unless they do, Repsol’s price could revisit the 9.900 and 9.420 euro levels. If the moving averages confirm a change, we could see a move toward 11.555 euros.
A direct impact on the Spanish ecosystem
For Spain, Aramco’s arrival represents an opportunity to strengthen its position in the new global energy map. The Saudi investment promises to energize key industries, attract new strategic alliances, and generate jobs in high-tech sectors related to energy and sustainability.
In the medium term, the success of these projects could also encourage the creation of an industrial ecosystem around e-fuels, integrating engineering, chemical, renewable, and mobility companies into a common decarbonization horizon.
Meanwhile, Aramco takes a firm step to secure a place in the future of energy... and Spain, if it plays its cards right, could be one of the big winners.
*******************************************************************************************
The information provided does not constitute investment research. The material has not been prepared in accordance with the legal requirements designed to promote the independence of investment research and such should be considered a marketing communication.
All information has been prepared by ActivTrades ("AT"). The information does not contain a record of AT's prices, or an offer of or solicitation for a transaction in any financial instrument. No representation or warranty is given as to the accuracy or completeness of this information.
Any material provided does not have regard to the specific investment objective and financial situation of any person who may receive it. Past performance is not reliable indicator of future performance. AT provides an execution-only service. Consequently, any person acting on the information provided does so at their own risk.
Ferrovial strengthens its presence in the USABy Ion Jauregui – ActivTrades Analyst
Ferrovial has launched a public–private partnership bid for the concession of Terminal B at Newark Liberty International Airport, replicating the financing and operating model it leads at the new Terminal One of JFK Airport in New York. The Port Authority Board allocated USD 35 million for preliminary studies to redesign this terminal—originally built in 1973 and today handling more than twice its intended capacity. The Spanish group aims to upgrade access roads, parking facilities and passenger services—including a hotel hub and renovated runways—with the goal of improving the flow of the 12.3 million travelers who passed through in 2023.
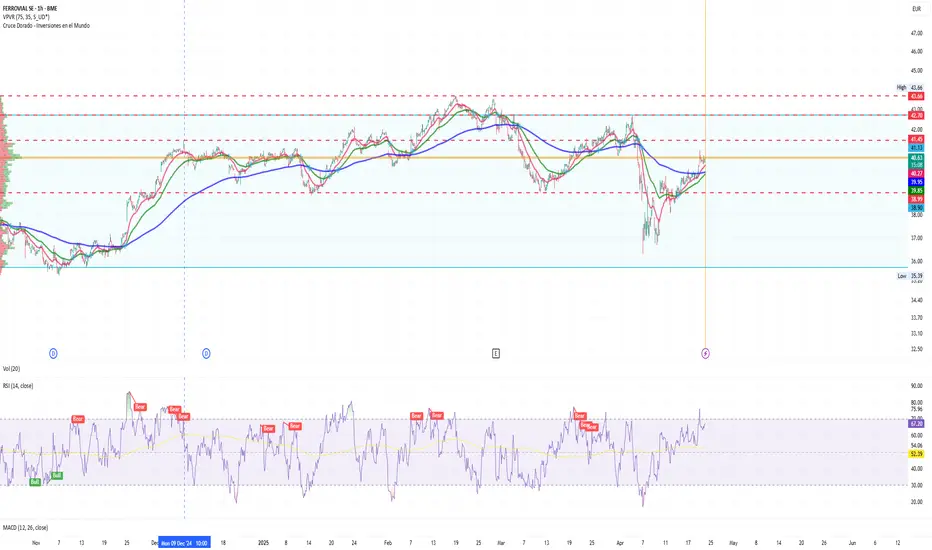
On the financial front, at the close of trading on the Madrid Stock Exchange, Ferrovial’s shares remain in line with their April levels, displaying a P/E ratio of 9.04×, below the sector average of 11×—underscoring its relative value profile. The 12-month consensus price target stands at €41.28 (range: €29.70–€48.00), with a moderate buy consensus of 3.29 out of 5. After monetizing its four UK airports (Heathrow, Aberdeen, Glasgow and Southampton) for over €3 billion, Ferrovial boasts exceptional liquidity and strong cash generation, enabling it to tackle major projects. In Australia, it is exploring the acquisition of a stake in Perth Airport, marking its return to the region after its involvement in Sydney Airport from 2002 to 2007. Its track record in flagship concessions—such as JFK’s Terminal 1, a USD 9.5 billion project running through 2060—gives it a competitive edge against top-tier funds and operators also vying for Newark. Meanwhile, the company continues diversifying its transport-infrastructure portfolio: it has increased its stake in Toronto’s Highway 407 ETR and is active in managed-lane concessions in the US.
FER.ES Technical Analysis
Since the Christmas rally pushed the share price higher through mid-February, Ferrovial has undergone a corrective phase toward its €38.99 moving average. From April 9, bullish momentum has resumed, targeting a retest of €41.45. A break above this level could open the way toward €42.70, the next resistance zone before prior highs. Although the RSI indicates overbought conditions, the Point of Control (POC) sits just below €41.45, suggesting strong trading activity in that area. Additionally, the widening of moving-average spreads signals a reaffirmation of the upward trend.
Conclusion
Ferrovial consolidates a sustainable growth profile, underpinned by large-scale projects (Newark, Perth, Rail Baltica, highways), a strengthened balance sheet and attractive market valuations. The outcome of the Newark concession and its entry into Perth will be pivotal in cementing its position as a global leader in airport infrastructure.
*******************************************************************************************
The information provided does not constitute investment research. The material has not been prepared in accordance with the legal requirements designed to promote the independence of investment research and such should be considered a marketing communication.
All information has been prepared by ActivTrades ("AT"). The information does not contain a record of AT's prices, or an offer of or solicitation for a transaction in any financial instrument. No representation or warranty is given as to the accuracy or completeness of this information.
Any material provided does not have regard to the specific investment objective and financial situation of any person who may receive it. Past performance is not reliable indicator of future performance. AT provides an execution-only service. Consequently, any person acting on the information provided does so at their own risk.
 Long
Long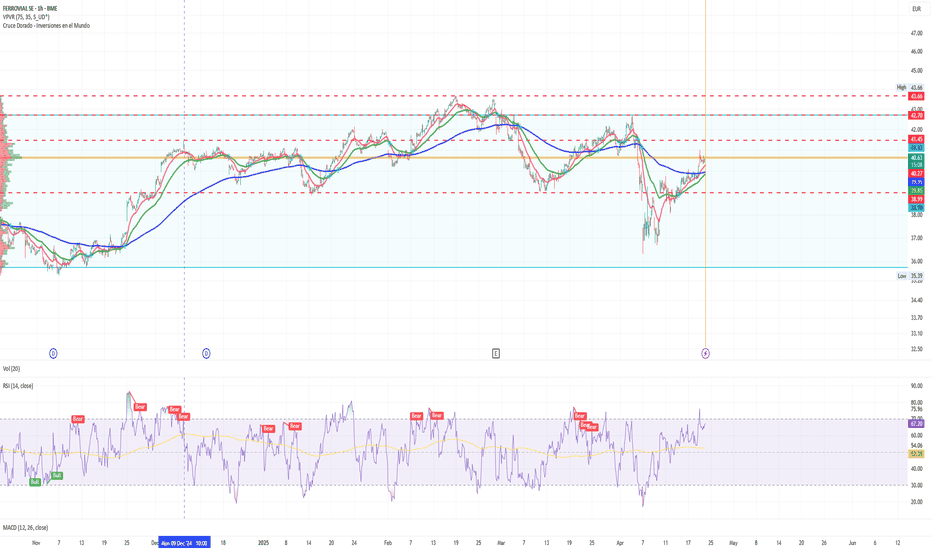
Fluidra Shields Itself from Trump's Tariff BlowsBy Ion Jauregui – Markets Analyst, ActivTrades
Amid the renewed escalation of trade tensions, Fluidra faces the potential impact of new tariffs driven by the Trump administration. The tariff dispute not only complicates international operations but also directly affects the company’s cost structure. With 50% of its sales in North America coming from products manufactured in Mexico and an additional 15% originating from China, Fluidra is particularly exposed to any increase in tariff rates. The company's projections indicate that, without swift measures, these tariffs could negatively impact its results by up to 50 million euros.
Profitability and Growth Objectives
During its Capital Markets Day, Fluidra made clear its commitment to improving its profitability. The firm aims to raise its EBITDA margin to 25% in the medium term, up from the 22.7% achieved in 2024. This objective represents an expansion of over two percentage points, following the upward trend seen between 2019 and 2024 (from 19.7% to 22.7%). In addition, the company forecasts organic sales growth in the range of 6% to 8% per year, which marks a significant acceleration compared to the modest 2.5% recorded in 2024.
Impact Mitigation Strategy
To safeguard its operating margins from tariff pressure, Fluidra has implemented a structured plan based on three main pillars:
Price Adjustment: The company has increased prices in the United States by 3.5%, a necessary measure to pass part of the rising costs onto its customers.
Operational Cost Optimization: Fluidra is reviewing and streamlining its production processes across all geographies, especially in America, where strategies include sharing costs with suppliers and the potential relocation of production.
Supply Chain Restructuring: The firm is evaluating new strategies in its international operations to minimize the tariffs' impact, thereby ensuring that pressure on the results remains under control.
Geographic Performance and Revenue Growth
Fluidra’s performance varies across markets:
North America: This region is solidifying its position as the group’s main growth engine, experiencing a 7.5% revenue increase, which underscores its strategic importance.
Europe: While Southern Europe saw a revenue contraction of 3.7%, the rest of Europe grew modestly (+1.6%). These differences reflect variations in demand and in each market’s ability to adjust prices.
International Markets: The rest of the world contributed a slight growth (+0.7%), adding to a global scenario in which Fluidra aims to consolidate its position.
Based on these figures, the company expects to close 2025 with revenues between 2,140 and 2,250 million euros—surpassing the sector’s average growth, estimated between 4% and 6%. Additionally, it is anticipated that the remaining 2% of growth will come from inorganic operations and increased market share.
Innovation and Strategic Expansion
Fluidra is not solely focused on price adjustments and cost reductions; it has also bet on inorganic expansion to reinforce its position. Among its most noteworthy moves is the acquisition of a 27% stake in Aiper Inc, a company specializing in robotics for pools, for 100 million dollars. Such investments aim to broaden the company’s footprint in emerging markets, with a commitment to progressively increasing its equity stake as the financial targets outlined in the company’s plan are achieved.
Technical Analysis
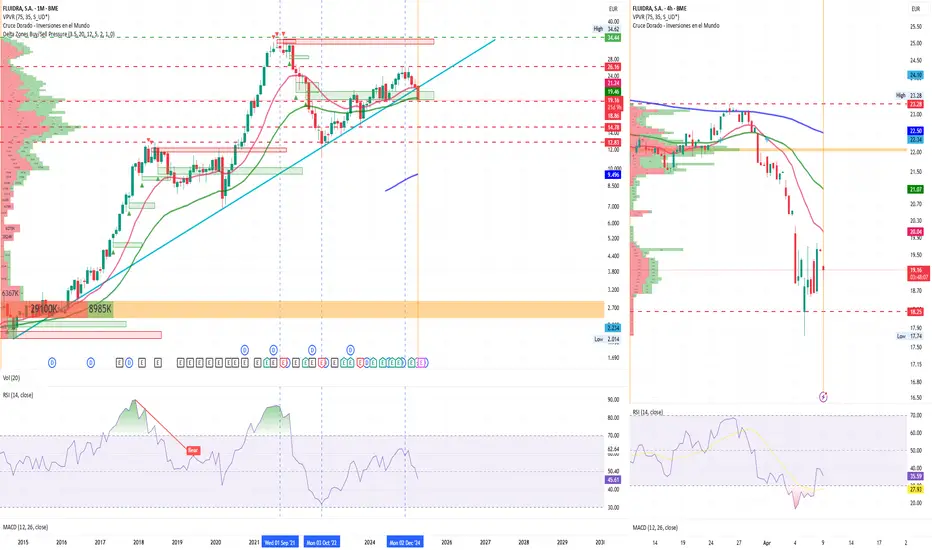
On the monthly chart, the company has shown solid support around 12.83 euros per contract since its previous bullish surge that reached a high in September 2021. After those highs, Fluidra corrected its price in October 2022 down to the current support “drill zone,” which has subsequently served as a new launchpad into the 2024 Christmas rally. Its Point of Control (POC) on the monthly chart is located at 14.78 euros. On the other hand, examining the 4-hour chart reveals that the POC is around 22.08 euros, well above the current support at 18.20 euros. With a current trading price around 19.60 euros, the RSI has moved out of oversold levels and is attempting to return to a more neutral zone, rising from 20% to the current 39.36%. The monthly moving average crossover indicates that the bullish development has not yet concluded despite the current bearish candle. However, on the 4-hour chart, the downward turn has not been corrected, resulting in a conflict of signals. Analyzing the pressure from the delta zones reveals a very strong barrier above 20 euros, which makes it likely that the price will move back to the upper area of the 4-hour bell curve, positioned around 22 euros as mentioned.
Conclusion
In an environment marked by global uncertainty and tariff pressure, Fluidra demonstrates resilience and adaptability. With clear growth objectives and an integrated strategy focused on margin improvement, the company is well-positioned to face current challenges and secure higher profitability. Through adjustments in pricing, operational optimization, and strategic expansion moves, Fluidra is preparing to maintain its strong performance and create sustainable value for shareholders, despite the impacts of the new U.S. trade policy. Despite the uncertain context, Fluidra remains steadfast in its commitment to generating sustainable and profitable value, with the goal of maintaining a ROCE of 17% while continuing to consolidate its global market position through a strategy centered on efficiency, innovation, and diversification.
*******************************************************************************************
The information provided does not constitute investment research. The material has not been prepared in accordance with the legal requirements designed to promote the independence of investment research and such should be considered a marketing communication.
All information has been prepared by ActivTrades ("AT"). The information does not contain a record of AT's prices, or an offer of or solicitation for a transaction in any financial instrument. No representation or warranty is given as to the accuracy or completeness of this information.
Any material provided does not have regard to the specific investment objective and financial situation of any person who may receive it. Past performance is not reliable indicator of future performance. AT provides an execution-only service. Consequently, any person acting on the information provided does so at their own risk.
 Long
Long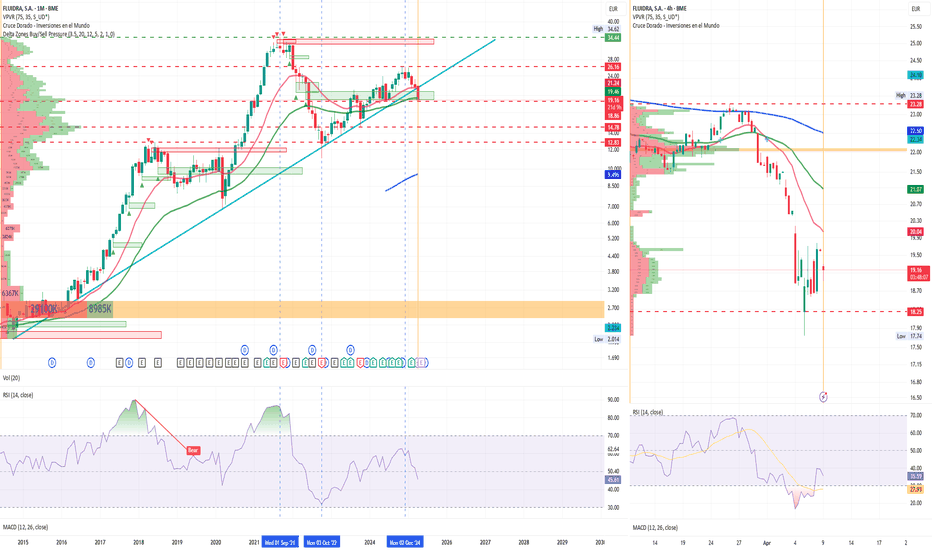
Santander at the gates of the 100 billion markBy Ion Jauregui - ActivTrades Analyst
Santander, the second largest listed company on the IBEX 35, is on the verge of reaching a new milestone: regaining €100 billion in market capitalization. This figure, not seen since 2015, marks a turning point in the trajectory of the bank, which consolidates its position as the largest in the euro zone, surpassing BNP Paribas. The Cantabrian entity has experienced sustained growth in recent months, driven by a favorable macroeconomic environment and by its strategy of geographic and business diversification. So far in 2025, its shares have risen by almost 55%, driven by a favorable context for the financial sector. Despite lagging behind other banks in 2024, this year it is demonstrating its resilience and operational strength. Santander has once again positioned itself among the elite of European banking, benefiting from rising interest rates and greater operational efficiency.
Key drivers of its growth
The banking sector has benefited from the new economic outlook in Europe, characterized by a rebound in inflation and an increase in defense spending, driven by Germany and the European Union. This environment has strengthened banking profitability, allowing Santander to improve its financial performance. In addition, the elimination of fiscal restrictions in some key countries has facilitated access to credit and boosted economic activity, resulting in greater demand for banking products and services. A clear indicator of its evolution is the comparison with its situation in 2015. Back then, its net profit was less than €6 billion. Today, according to FactSet estimates, it is expected to close 2025 with earnings of 12.69 billion, more than twice as much as a decade ago. This increase is largely due to improved financial margins due to positive interest rates, cost containment and the digitization of its services. Among these costs and in spite of everything, the UK market has turned out to be one of the markets in which it has encountered the greatest direct difficulties and its exit was even considered at the end of last year and the beginning of this one.
Differences with the past
Despite the growth in capitalization and profits, its share price is still far from the historical highs reached in 2007, when it exceeded 13 euros per share. The capital increase and the issuance of convertible debt have transformed its financial structure, so that the bank's total stock market value is not directly reflected in its share price. Since the 2008 crisis, the sector has changed radically with new regulations, mergers and recapitalizations. Santander has been able to adapt, consolidating its position and betting on a diversified strategy that has allowed it to withstand market swings. Unlike in 2015, the entity now has a more solid capital structure, with less dependence on capital increases and a greater capacity to generate recurring profits. In the past, much of the banks' growth was based on credit expansion, which generated a risk bubble that burst with the financial crisis. Today, Santander has learned from those mistakes and has diversified its revenues, betting on the wealth management business, investment banking and digitalization. This transformation has allowed it to remain competitive against new players in the financial sector, such as fintechs and neobanks.
Outlook for the future
With a solid financial situation and an economic environment that continues to offer opportunities, the bank is well positioned to continue its growth. Its performance will depend to a large extent on the ECB's monetary policy and its ability to maintain profitability in a changing market. One of the key challenges for the bank will be managing the interest rate cycle. While rates have boosted banking profitability in recent years, any downturn could squeeze margins. In this regard, Santander will need to focus on operational efficiency strategies and revenue diversification to maintain its profitability. Another aspect to consider is growth in emerging markets. Santander's global presence in Latin America remains a key pillar for its growth, contributing a significant portion of its profits. However, political and economic volatility in the region represents a risk that the bank will have to manage carefully.
Lastly, digitalization and innovation will continue to be differentiating factors in the banking sector. Santander has invested significantly in technology to improve the customer experience and optimize its operations. Competition with fintechs and tech giants will be intense, and the bank will need to continue to innovate to stay ahead of the curve.
Technical Outlook.
At the moment we can see how the stock has soared from January 2 to March 19, currently being an area of possible perforation of the price of 2015 highs after having generated an accumulation zone in the area of 2017 highs. Seeing the current value of the RSI at 65.8% a little more volatility in that direction is predictable, although it is overbought. The average crossover indicates a continuation of the price extension, so it is quite affordable points to a price of 2014 highs around 7.475. If we look at the control point (POC) this is located in the area of the previous range around 4.50 euros per share. If we look at the shape of the bell, it seems to be forming a small double bell in the part of the current highs price around €6 per share.
Conclusion
Santander is on the verge of regaining the 100 billion euros mark in capitalization, consolidating its position as the leader of the banking sector in the euro zone. Its performance in recent years demonstrates the bank's ability to adapt to a changing environment and take advantage of market opportunities. With a strategy based on diversification, digitalization and operational efficiency, Santander is positioned as a key player in the future of the financial sector.
*******************************************************************************************
The information provided does not constitute investment research. The material has not been prepared in accordance with the legal requirements designed to promote the independence of investment research and such should be considered a marketing communication.
All information has been prepared by ActivTrades ("AT"). The information does not contain a record of AT's prices, or an offer of or solicitation for a transaction in any financial instrument. No representation or warranty is given as to the accuracy or completeness of this information.
Any material provided does not have regard to the specific investment objective and financial situation of any person who may receive it. Past performance is not reliable indicator of future performance. AT provides an execution-only service. Consequently, any person acing on the information provided does so at their own risk.
 Long
Long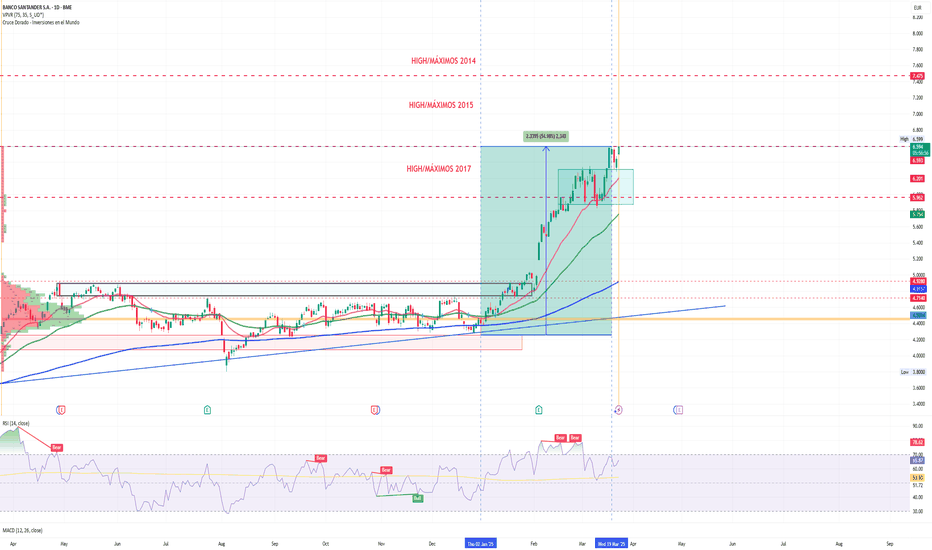
ArcelorMittal : Getting stronger again!! Go for the best!ArcelorMittal, the world's leading steel and mining producer, present in 60 countries and with primary steel production facilities in 16 countries, presents a CLEARLY BULLISH technical outlook.
If we look at the H1 chart above, the trend is clearly bullish, as are its upper timeframes, H4, Daily, and Weekly. (SEE SUMMARY TABLE).
On March 6th, it reached a high in the 32 zone and has since retreated by approximately -12%.
March 14th signaled the end of the retracement on the chart, and as expected, it began to rise strongly again. Therefore, we must look for LONG positions on each price pullback.
---> How do we look for long positions?
To do this, we'll use any technique we like best, such as Fibonacci retracements, Bollinger Bands, moving average crossovers, etc.
In the chart below, we used Bollinger Bands on the M15 chart to enter, and as you can see, today's entry was marked LONG.
--> (REMEMBER that we only pay attention to signals that favor the main trend, i.e., BULLISH (Bullish). If a BEARISH (Bearish) signal is given, we ignore it because it is only used to close open positions.)
-------------------------------------
Strategy to follow:
ENTRY: We will open two long positions in the current area of 29.80.
POSITION 1 (TP1): We close position 1 in the high zone of 32 (+7.5%).
--> Stop Loss at 29.10 (-2.5%).
POSITION 2 (TP2): We open a Trailing Stop position.
--- Initial trailing stop loss at (-2.5%) (coinciding with the 29.10 of position 1).
--- We modify the trailing stop loss to (-1%) when the price reaches TP1 (32).
-------------------------------------------
SET UP EXPLANATIONS
*** How do you know which two long positions to open? Let's take an example: If we want to invest 2,000 euros in the stock, we divide that amount by 2, and instead of opening one position of 2,000 euros, we open two positions of 1,000 euros each.
*** What is a Trailing Stop? A Trailing Stop allows a trade to continue gaining value when the market price moves in a favorable direction, but it automatically closes the trade if the market price suddenly moves in an unfavorable direction by a specified distance. This specified distance is the trailing stop loss.
-->Example: If the trailing stop loss is at -1%, it means that if the price drops by -1%, the position will be closed. If the price rises, the stop loss also rises to maintain that -1% during increases. Therefore, the risk decreases until the position enters a profit. This way, you can take advantage of very strong and stable price trends, maximizing profits.
Best regards and happy trading!  Long
Long
Telefónica: Dividend load shedding in HispamBy Ion Jauregui - ActivTrades Analyst
The “strategic review” announced by CEO Marc Murtra focuses on the Hispanic American market, a sector that has shown negative results for years. In 2024, business in countries such as Argentina, Colombia, Chile, Peru and Mexico generated 'red numbers' that reached 2,432 million euros, as gains in Ecuador, Venezuela and Uruguay did not offset the falls in the other markets.
To reverse this situation, Telefónica has accelerated the divestment process in Latin America. In just twenty days, the sale of the Argentine subsidiary brought in extraordinary proceeds of 1,190 million euros. This transaction was closed with no risk of reversal, as the amount was already in the company's cash, and there is no possibility that the Argentinean government, headed by Javier Milei, will modify the transaction. Likewise, last Thursday the agreement for the sale of the Colombian subsidiary was announced. Millicom committed to acquire 67.5% of Coltel (Colombia Telecomunicaciones) for 368 million euros, a transaction pending regulatory permits in that country. 1,558 million, funds that Telefónica plans to allocate to two crucial objectives: debt reduction and consolidation of dividend payments.
If these proceeds are applied in full to the repayment of liabilities, the group's debt could fall by 5.7%, from 27,161 million euros to 25,603 million euros in mid-March. According to several analysts, these divestments will not only avoid future burdens, but will also generate resources for reinvestment in more prosperous markets or sectors. This strategy is in line with the so-called “dead horse theory”, which recommends divesting assets that no longer add value. It is worth noting that Latin America represents 27% of Telefónica's workforce, with 27,570 employees, which means that the exit from this region would imply a significant structural reduction in the organization.
Finally, Murtra stressed at the Mobile World Congress the need for large European telecommunications companies to consolidate and grow in order to strengthen their technological capacity. With this series of operations, Telefónica is not only preparing to improve its financial situation, but is also laying the foundations for a more competitive and efficient future.
If we analyze all this in perspective, it only remains to see that Murtra is seeking to recover the share price value that it has been losing since 2020 when it was trading at 7.592 euros/share. In mid-2022 its highs were at €5.064 and consequently it then fell in price to its lows of €3.237. The range that the company has developed has fluctuated from May 2020 to the present between 4.430 and 3.535 euros/share. 3.923 in the middle zone all this time. The current price after such a disentailment in Spanish America has resulted in a price recovery to 4.347 euros, a value in the upper part of this range. The last few sessions the price has climbed from the middle of the checkpoint after bouncing off the 3.764 level on January 24. This is just a symptom that the strategy of getting rid of the burden since the beginning of the year is only looking for “red numbers” to turn green to ensure this dividend in a very controversial quarterly closing for the Spanish company.
It remains to monitor the evolution of the company's investment strategy for the long term this year, to see if the company regains the path of upward recovery.
*******************************************************************************************
The information provided does not constitute investment research. The material has not been prepared in accordance with the legal requirements designed to promote the independence of investment research and such should be considered a marketing communication.
All information has been prepared by ActivTrades ("AT"). The information does not contain a record of AT's prices, or an offer of or solicitation for a transaction in any financial instrument. No representation or warranty is given as to the accuracy or completeness of this information.
Any material provided does not have regard to the specific investment objective and financial situation of any person who may receive it. Past performance is not reliable indicator of future performance. AT provides an execution-only service. Consequently, any person acing on the information provided does so at their own risk.
 Long
Long
 Long
Long
 Long
Long
MAPFRE: Everything points to new highs!! Pay attention!!
On February 12, Mapfre presented its income statement, beating expectations!!.
Premiums will grow solidly in 2024 (+6.6% at constant exchange rates) to €28,122M, beating expectations. The biggest surprise comes from the margins side. The Non-Life combined ratio stands at 94.4% (vs 97.2% in 2023), despite the fact that pressure on margins persists in the auto segment. It drives the technical result which, together with the financial result, more than offsets the fall in the Life branch result. Overall, the BNA rebounds to €902M (+30%; vs €888M expected).
In short, the results beat our expectations.
--> What does the technical aspect look like?
As you can see in the graph, the TREND and STRENGTH are clearly bullish (Bull) in their main time frames (DAILY and H4), therefore, we will only look for long positions.
--> When is the best way to enter long positions?
Once we have TREND and STRENGTH aligned in DAILY and H4, we go down to H1 or M30 time frame to wait for a pullback and enter in the direction of the H4 trend, in this case, bullish (Bull), therefore we go LONG.
If we look at the graph in H1, the FORCE turned bullish (Bull) on February 25 and it was from that point when the bullish momentum began. Now IT IS MAKING A SMALL PULLBACK which gives us the opportunity to enter long positions if the pullback does not break key support zones.
--> How do you know when a pullback ends?
There are several techniques such as using an indicator, moving average crossovers, Fibonacci retracements... For example, I like the price to retrace at least 50% and wait for the price to break previous highs to enter long.
Another option that is also used a lot is to enter long when it makes a Fibonacci retracement of 50% or 61.8% without waiting for the retracement to end, in this way the entry price is lower, but we have the risk that the retracement does not end and the Stop Loss is triggered.
--------------------------------------
Strategy to follow:
ENTRY: We will open 2 long positions if the H1 candle closes above its previous highs at 2.736
POSITION 1 (TP1): We close the first position in the 2.8 (+2.8%) zone
--> Stop Loss at 2.67 (-2.5%).
POSITION 2 (TP2): We open a Trailing Stop type position.
--> Initial dynamic Stop Loss at (-2.5%) (coinciding with the 899 of position 1).
--> We modify the dynamic Stop Loss to (-1%) when the price reaches TP1 (2.8).
-------------------------------------------
SET UP EXPLANATIONS
*** How do we know which 2 long positions to open? Let's take an example: If we want to invest 2,000 euros in the stock, what we do is divide that amount by 2, and instead of opening 1 position of 2,000, we will open 2 positions of 1,000 each.
*** What is a Trailing Stop? A Trailing Stop allows a trade to continue gaining value when the market price moves in a favorable direction, but automatically closes the trade if the market price suddenly moves in an unfavorable direction by a certain distance. That certain distance is the dynamic Stop Loss.
-->Example: If the dynamic Stop Loss is at -1%, it means that if the price drops by -1%, the position will be closed. If the price rises, the Stop Loss also rises to maintain that -1% in the rises, therefore, the risk is increasingly lower until the position becomes profitable. In this way, very solid and stable price trends can be taken advantage of, maximizing profits.  Long
Long
Telefónica restructures its strategic plan towards BrazilBy Ion Jauregui - ActivTrades Analyst
Latin America divestment plan
Telefónica has put its subsidiary in Uruguay, valued at up to $400 million, up for sale. This move is in line with its divestment strategy in Latin America, where it also plans to sell assets in Argentina and Mexico. The Uruguayan subsidiary, based in Montevideo, is facing a loss of customers due to competition from Claro and state-owned Antel. The company hopes to attract bids for a small market with declining revenues but high investment demands.
Key assets and business value
Telefónica Uruguay's most valuable assets are its mobile frequency licenses, which cover the 850 MHz, 700 MHz and 1,900 MHz bands, essential for 2G, 3G, 4G and 5G services. Movistar Uruguay stands out as the largest private operator in the country, with 1.4 million customers and 97% coverage of the territory. Estimates suggest that the sale value would range between US$350 million and US$400 million, a figure similar to the offer it received three years ago from Supercanal-Arlink (now Super), although unsuccessful at the time.
Fierce competition and loss of customers.
Movistar Uruguay faces strong competition. In recent months, it has lost 32,750 net lines, while Claro has gained 38,000 lines and Antel, although with a slight negative balance, maintains its market leadership. According to URSEC data, Movistar ranks second in the Uruguayan mobile market with a 29% share, compared to 49% for Antel and 22% for Claro.
Declining revenues and market challenges
The Uruguayan mobile market is experiencing a slowdown, with subscriptions stagnating since the end of 2023. Movistar Uruguay also offers business services, backed by more than 70 stores, 1,300 employees and more than 5,000 suppliers and partners. However, competitive pressures and high investment costs limit growth.
Regional outlook and next steps
Beyond Uruguay, Telefónica faces similar challenges in other Latin American markets. In Mexico, the company is looking for a buyer for a business that generates 960 million euros, but with low profit margins due to the high proportion of prepaid customers. In Colombia, the sale process is in its final phase, with Millicom as the main interested party. In addition, the situation in Peru is critical after Movistar Peru filed for insolvency proceedings, forcing Telefónica to guarantee services for 13 million customers.
Telefónica continues to consolidate its position in key markets such as Brazil, while redefining its strategy in other Latin American territories to optimize its profitability and business focus.
Telefónica Analysis
Since the end of 2022 the company has been looking to recover its share price by having an upward cycle. June and October 2024 were two occasions where it sought to pierce the 4.6 euros without success. This data with the RSI currently at 60.87% overbought indicates that the price could bounce towards the current control point (POC) at 3.960 euros. If the company continues to recover positions we could see another new attempt to reach 4.6 in this quarter's income statement.
*******************************************************************************************
The information provided does not constitute investment research. The material has not been prepared in accordance with the legal requirements designed to promote the independence of investment research and such should be considered a marketing communication.
All information has been prepared by ActivTrades ("AT"). The information does not contain a record of AT's prices, or an offer of or solicitation for a transaction in any financial instrument. No representation or warranty is given as to the accuracy or completeness of this information.
Any material provided does not have regard to the specific investment objective and financial situation of any person who may receive it. Past performance is not reliable indicator of future performance. AT provides an execution-only service. Consequently, any person acing on the information provided does so at their own risk.
 Long
Long
CaixaBank achieves record profits in 2024By Ion Jauregui - Analyst ActivTrades
CaixaBank closed 2024 with the best result in its history, reaching a net profit of €5,787 million, 20% higher than in 2023. This growth was driven by intense commercial activity and the effect of high interest rates. The result exceeded analysts' forecasts, consolidating the bank's leadership in the sector.
Fundamental Analysis
The bank announced a new share buyback program for a maximum value of €500 million, completing its €12 billion distribution plan set out in its 2022-2024 strategy. In terms of shareholder remuneration, CaixaBank will distribute a final dividend of 0.2864 euros gross per share in April, reaching a total remuneration equivalent to 53.5% of net profit for the year. Net interest income grew by 9.8% year-on-year to 11,108 million euros, although it fell slightly in the last quarter due to the easing of the European Central Bank's (ECB) monetary policy. Income from services increased by 4.6% to 4,995 million euros, with significant growth in asset management (12.1%) and protection insurance (4.2%). CaixaBank also improved its efficiency, reducing its efficiency ratio to 38.5% and raising its return on tangible assets (RoTE) to 18.1%. Its healthy loan portfolio increased by 2.2%, with strong growth in mortgages (53%), corporate loans (24%) and consumer loans (13%). With an NPL ratio of 2.6% and a CET1 of 12.2%, the bank is in a solid position to face its new strategic plan 2025-2027.
Technical Analysis
If we look at the chart with the WACD indicator showing the VWAP in graph with BUY/SELL signals, and below the three smoothed averages (SMA/EMA/WMA) and the cumulative Delta, showing sentiment, we can see that on January 28th there was a strong trend reversal signal which has subsequently been accompanied by another signal yesterday at 11 o'clock and the movement of the averages has pierced the line. If we look at the cumulative delta a bullish move has been pronounced accompanied by several blue candlesticks signaling bullish sentiment, subsequently from the last signal this also confirmed with bullish sentiment. At the moment RSI is highly oversold at 75.11% marking this extension of the three extremely open bullish averages. The current session Caixa in its first hour has opened with a strong bearish pressure, so it could indicate that the price could correct if it does not hold at least at 5.876 euros/share. There are two other support zones where the price could relapse if it loses its current support, the zone of 5.742 euros and 5.648 euros, being the minimum of 5.570 euros. The logic of the evolution of the share after the share buyback is the revaluation so it is very likely that the company's objective is to try to pierce the 6 euros per share towards new highs. Although the share price of the first hour indicates a temporary slowdown in this evolution.
*******************************************************************************************
The information provided does not constitute investment research. The material has not been prepared in accordance with the legal requirements designed to promote the independence of investment research and such should be considered a marketing communication.
All information has been prepared by ActivTrades ("AT"). The information does not contain a record of AT's prices, or an offer of or solicitation for a transaction in any financial instrument. No representation or warranty is given as to the accuracy or completeness of this information.
Any material provided does not have regard to the specific investment objective and financial situation of any person who may receive it. Past performance is not reliable indicator of future performance. AT provides an execution-only service. Consequently, any person acing on the information provided does so at their own risk.
Is a U.K. turnaround looming for Santander?Banco Santander (BME: SAN) could be considering a major strategic shift: its exit from the UK market after two decades of operations, according to recent speculation. Since the acquisition of Abbey National in 2004, the UK has been a key market for the Spanish bank. However, operational challenges, low returns and legal problems could be motivating this possible decision.
Factors behind the possible withdrawal
1. Low financial returns: Santander UK has faced a significant decline in profits. In 2024, the bank's UK results posted a 45% drop, reflecting lower profitability compared to other key markets such as the U.S. and Latin America.
2. Legal and regulatory issues: Auto lending has been a constant source of litigation and stringent regulations, increasing costs and operational complexity in the country.
3. High operating costs: Maintaining a large-scale operation in the UK has proven challenging, especially in an environment of high banking competition and increasing regulatory pressures. This contrasts with the bank's strategic focus on more profitable markets with higher growth potential, such as the United States.
Santander's strategic priorities
The bank led by Ana Botín has shown a growing interest in markets such as the United States, where diversification and expansion potential offer better return prospects. This strategy is aligned with its focus on efficiency and resource optimization, moving away from operations that do not meet its long-term profitability objectives.
Technical Analysis
On the daily chart, using the ActivTrades WACD indicator, the stock is currently in a sideways range, the smoothed triple mean indicates a clear perforation of its last high zone, coinciding with the high of April and May 2024. Coinciding with the high zone of April and May 2024, the cumulative delta volumes show a bullish continuation with a gradual volume contraction. If we look at the VWAP and the SELL and BUY signals of the indicator, no signals have been given on the daily chart, but they have been given on the 1Hour chart prior to the movement that has occurred in the last three days. It can be seen that the sideways range of the stock initiated in May 2024 has been clearly perforated, so we must wait to see if the stock reaches its highs and continues its upward movement, or proceeds to correct later.
Outlook and future
Although there is no official confirmation about a possible withdrawal from the UK, this decision could mark an important milestone in Santander's global strategy. The UK market, although historically relevant, seems to have lost prominence to the opportunities offered by other regions.
The uncertainty about Santander's future in the UK raises important questions about how its international presence will be reconfigured and how this decision could affect its image and valuation in the financial markets.
Ion Jauregui –ActivTrades Analyst
*******************************************************************************************
The information provided does not constitute investment research. The material has not been prepared in accordance with the legal requirements designed to promote the independence of investment research and such should be considered a marketing communication.
All information has been prepared by ActivTrades ("AT"). The information does not contain a record of AT's prices, or an offer of or solicitation for a transaction in any financial instrument. No representation or warranty is given as to the accuracy or completeness of this information.
Any material provided does not have regard to the specific investment objective and financial situation of any person who may receive it. Past performance is not reliable indicator of future performance. AT provides an execution-only service. Consequently, any person acing on the information provided does so at their own risk.
Long 
Introducing the WACD - ActivTrades - IonJaureguiIntroducing the WACD - ActivTrades - IonJauregui: A Powerful Tool for Market Sentiment Analysis
In the fast-paced world of trading, having the right tools to gauge market sentiment is crucial for making informed decisions. One such tool is the WACD - ActivTrades - IonJauregui - Weighted Average Cumulative Delta indicator, a unique and powerful addition to your TradingView toolkit. Designed specifically to analyze buying and selling pressure, this indicator provides valuable insights into market dynamics, trend strength, and potential reversals.
What is the WACD Indicator?
The WACD indicator tracks the difference between buying and selling volumes, with the added complexity of weighting these volumes by the closing price. By calculating the cumulative delta (net buy vs. sell volume), it offers a clear view of overall market sentiment. The indicator then applies a moving average to smooth out fluctuations, providing a clearer picture of market trends.
Cumulative Delta: Shows the overall buying or selling pressure in the market.
WACD: Smooths the weighted cumulative delta, helping to identify trends and potential reversals.
Positive values in the WACD suggest buying pressure, while negative values indicate selling pressure. This makes the WACD a valuable tool for detecting trend strength and market reversals.
Key Features of the WACD Indicator
Multiple Smoothing Methods: Traders can choose between three different smoothing methods—Simple Moving Average (SMA), Exponential Moving Average (EMA), or Weighted Moving Average (WMA). This flexibility allows traders to tailor the indicator to their unique strategies.
Customizable Smoothing Length: The length of the smoothing period can be adjusted to suit individual trading preferences, providing further customization for more accurate signals.
Delta Bars with Color Gradient: The WACD indicator displays the delta fluctuations with a color gradient, making it easier to interpret market dynamics. The delta bars transition from blue to red, indicating whether the delta is rising (bullish) or falling (bearish).
Enhanced Visuals: The color-coded delta bars help to visualize market pressure more clearly, with the color change reflecting the current trend. Traders can instantly see whether the market is experiencing buying or selling pressure, allowing for faster and more effective decision-making.
How Can the WACD Help Traders?
The WACD indicator provides a range of benefits for traders, especially when used in conjunction with other technical analysis tools. Here's how it can improve your trading strategy:
Trend Identification: By smoothing the cumulative delta, the WACD makes it easier to identify emerging trends and reversals, giving traders a clearer view of market direction.
Market Sentiment: The indicator’s color-coded delta bars allow traders to quickly assess market sentiment—whether it’s leaning toward buying or selling pressure. This can help traders align their positions with broader market movements.
Confirmation Tool: The WACD can be used alongside other indicators to confirm price action, providing a more robust and reliable trading strategy.
Increased Precision: With customizable settings for smoothing methods and lengths, traders can fine-tune the WACD to match their specific needs, increasing the precision of their trades.
Why Choose the WACD on TradingView?
TradingView is known for its advanced charting capabilities and user-friendly interface, and the WACD indicator integrates seamlessly with this platform. The visual enhancements, such as the color-coded delta bars and multiple smoothing options, allow traders to make better-informed decisions faster.
Whether you’re a seasoned trader or just starting out, the WACD - ActivTrades - IonJauregui - Weighted Average Cumulative Delta indicator is an invaluable tool for anyone looking to gain a deeper understanding of market sentiment and price action.
Ion Jauregui - ActivTrades Analyst
*******************************************************************************************
The information provided does not constitute investment research. The material has not been prepared in accordance with the legal requirements designed to promote the independence of investment research and such should be considered a marketing communication.
All information has been prepared by ActivTrades ("AT"). The information does not contain a record of AT's prices, or an offer of or solicitation for a transaction in any financial instrument. No representation or warranty is given as to the accuracy or completeness of this information.
Any material provided does not have regard to the specific investment objective and financial situation of any person who may receive it. Past performance is not reliable indicator of future performance. AT provides an execution-only service. Consequently, any person acing on the information provided does so at their own risk.
 Education
Short 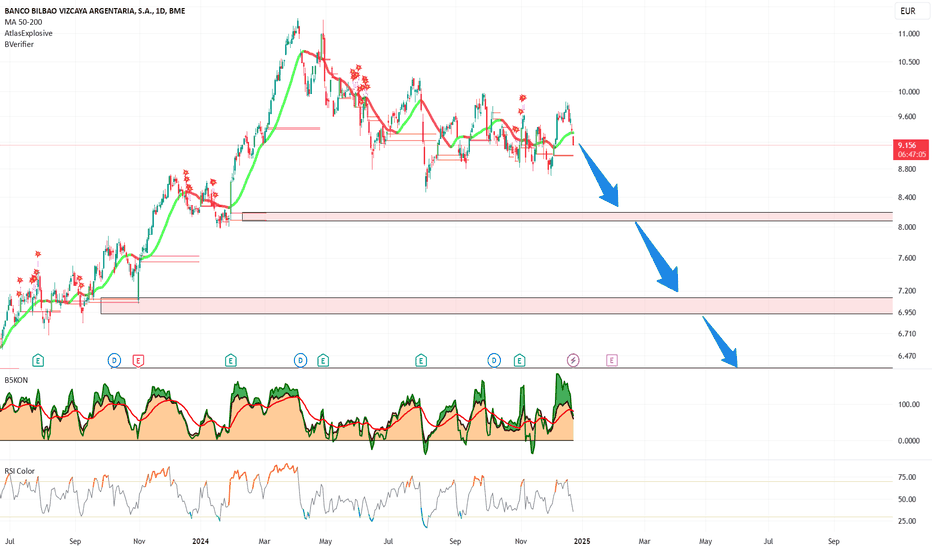
Solaria and Acciona Energía: Liquidity sustains them on IBEX35The renewable energy companies Solaria (Ticker AT: SLR.ES) and Acciona Energía (Ticker AT:ANA.ES) are facing a complicated year in the stock market, with significant losses in their capitalization. Despite these falls, both are managing to remain in the Ibex 35 thanks to their outstanding liquidity, which prevents their exclusion.
The committee that defines the composition of the index will meet on December 12 and, although Solaria and Acciona do not meet the minimum capitalization criterion, the lack of candidates with sufficient trading volume and their strength in liquidity favor their permanence. Solaria, for example, has been one of the 28 most traded shares in the last six months, while Acciona Energía ranks 23rd in the liquidity ranking with a daily average of 9.2 million euros traded.
Solaria has hit lows not seen since 2020, currently being the smallest company in the index with a stock market value representing only 0.24% of the Ibex as a whole, below the 0.30% threshold. However, as in previous cases such as Meliá, its exclusion is not mandatory as long as it maintains its liquidity. Acciona Energía, meanwhile, has the lowest free float on the Ibex, as Acciona controls 88.33% of its shares. Despite this, liquidity has been its lifeline, far outperforming other less traded firms.
As for new entries, Vidrala (Ticker AT:VID.ES) could be a future candidate, although it will not be on this occasion due to a recent drop in its liquidity.
Technical Aspect
If we look at the technical aspect Solaria has been losing its maximum price since January 2021 at 31.06 Euros to the current 9.010. A -73.15% in 3 years of trading. It can be seen a quite marked Shoulder - Head - Shoulder figure. The RSI indicates high oversold at 37.57. At the moment there is a bearish crossover between the 50 and 100 averages. And the delta zone of upward pressure does not seem to be generating much effect. The control point (POC) is located around 5.150. Therefore, this fall could take place in a not very long period. On the other hand, Acciona, has been supporting its price in the 101-105 euros area and currently seems to be bouncing the price towards the last bullish area of 211 euros. Its current control point is located around 69 euros. The RSI is currently slightly oversold at $44.13, so if the company's financial situation improves, the natural evolution of the company will be to look for a test of its last resistance.
Both companies will remain under scrutiny, but their ability to adapt will be key to keep their place in the main Spanish stock market index.
Ion Jauregui - ActivTrades Analyst
*******************************************************************************************
The information provided does not constitute investment research. The material has not been prepared in accordance with the legal requirements designed to promote the independence of investment research and such should be considered a marketing communication.
All information has been prepared by ActivTrades ("AT"). The information does not contain a record of AT's prices, or an offer of or solicitation for a transaction in any financial instrument. No representation or warranty is given as to the accuracy or completeness of this information.
Any material provided does not have regard to the specific investment objective and financial situation of any person who may receive it. Past performance is not reliable indicator of future performance. AT provides an execution-only service. Consequently, any person acing on the information provided does so at their own risk.