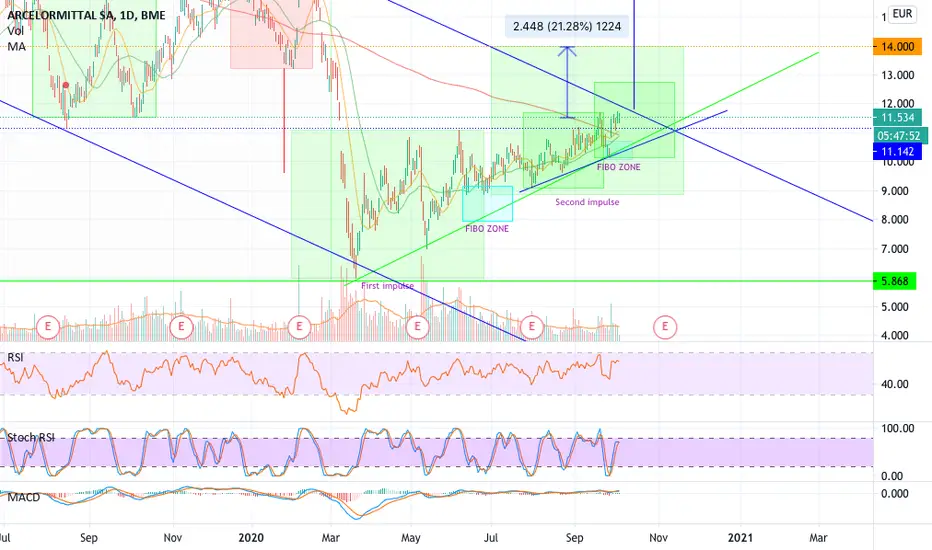
Amadeus may retest Weekly EMA200I see volume is decreasing, has already surpassed last suport and I see a probable retest of the weekly EMA200 that even is at the same prace of the Weekly EMA 9.
This could only be plaussible if we are not talking about a fake break of the 57,94 suport.
I expect price to bounce on EMA200 :)
Let's see if I'm right!
ACX1 bearish scenario:✨✨✨Technical outlook:
ACX1 bearish scenario:
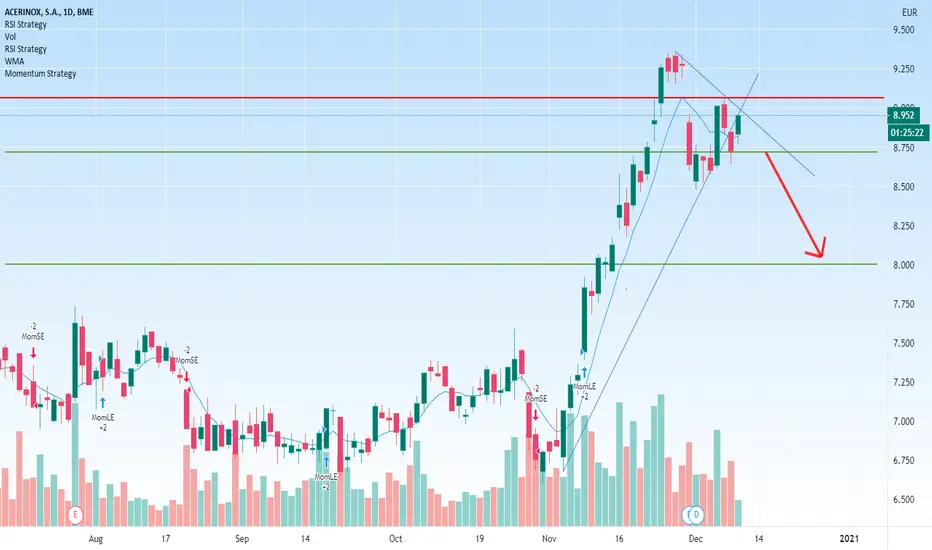
We have technical figure Triangle in Spanish company Acerinox, S.A. (ACX1) at daily chart. Acerinox, S.A. is a stainless steel manufacturing conglomerate group based in Spain. As for 2008, the company was the world's largest producer of stainless steel. The Triangle has broken through the support line at 09/12/2020, if the price holds below this level we can have possible bearish price movement with forecast for the next 8 days towards 7.998 EUR. Our stop loss order should be placed at 9.062 EUR if we decide to enter this position.
Fundamentals:
ACX1 bearish scenario:
We have technical figure Triangle in Spanish company Acerinox, S.A. (ACX1) at daily chart. Acerinox, S.A. is a stainless steel manufacturing conglomerate group based in Spain. As for 2008, the company was the world's largest producer of stainless steel. The Triangle has broken through the support line at 09/12/2020, if the price holds below this level we can have possible bearish price movement with forecast for the next 8 days towards 7.998 EUR. Our stop loss order should be placed at 9.062 EUR if we decide to enter this position.
ACX1 bearish scenario:ACX1 bearish scenario:
We have technical figure Triangle in Spanish company Acerinox, S.A. (ACX1) at daily chart. Acerinox, S.A. is a stainless steel manufacturing conglomerate group based in Spain. As for 2008, the company was the world's largest producer of stainless steel. The Triangle has broken through the support line at 09/12/2020, if the price holds below this level we can have possible bearish price movement with forecast for the next 8 days towards 7.998 EUR. Our stop loss order should be placed at 9.062 EUR if we decide to enter this position.
Fundamentals
The COVID-19 pandemic is significantly affecting the development of markets during the second quarter,” the company said on Friday, after reporting its first quarter net profit fell to 28 million euros from 33 million euros a year earlier.
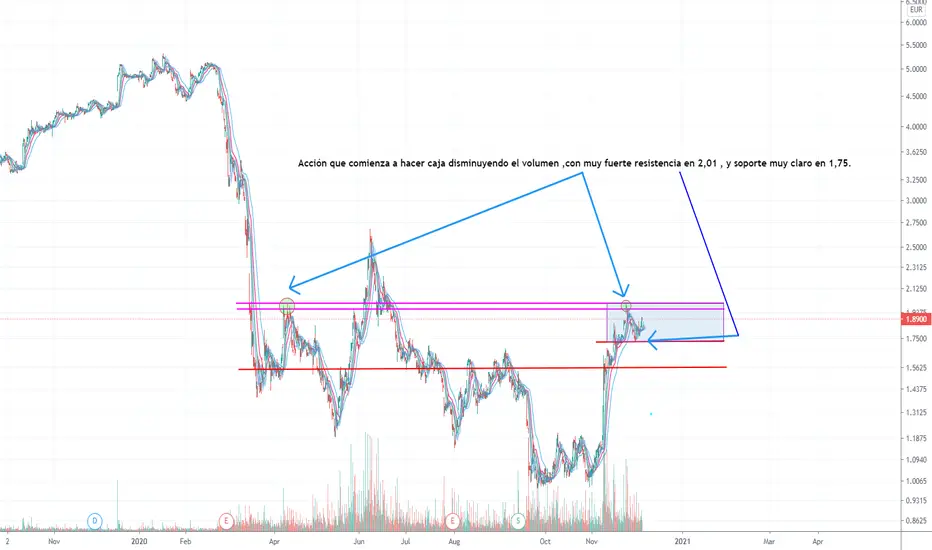
SACYR in front of major resistance/ en resistencia historicaSacyr closed on friday really close to historical resistance after a rally that started in 1.40s for almost 50% upside. With christmas approaching to markets and everything going up it wouldn't be suprise the typical december retrace taking this one 2 fib levels down to 1.69 before seriously trying to break that resistance.
Sacyr cerro el viernes muy cerca de una resistencia historica en torno a 2.1e por acción despueés de un rally q empezo en torno a 1,4 euros para casi un 50% de revalorizacion. Con Navidades a la vuelta de la esquina y Diciembre siendo un mes que suele tener caidas en los mercados no sería de extrañar ver a sacyr retroceder 2 nvieles del retroceso de fibonacci hasta los 1.69€ antes de plantearse seriamente atacar la resistencia historica mencionada.