Aena: Leader in the Premium Business After Doubling VIP RevenuesAena: Leader in the Premium Business After Doubling VIP Revenues in Six Years
[/b ]Success of stays and fast-track services drives commercial profitability
Ion Jauregui – Analyst at ActivTrades
Aena has successfully turned its VIP lounges into one of the most profitable engines of its commercial business. Since 2019, revenues from this service have increased from €78.8 million to €151.7 million in the first nine months of 2025, nearly doubling their contribution to the company’s total commercial business in just six years. This growth has been supported by infrastructure expansion, higher average prices, and diversification of services, including priority access through security filters, Fast Track, Fast Lane, and exclusive spaces such as Air Rooms and Meet & Assist.
Fundamental Analysis
Aena’s success in its VIP business reflects a solid strategy of revenue diversification, reducing reliance on regulated traffic and traditional airport fees. By September 2025, VIP revenues grew 31.8% year-on-year, while associated costs increased 31% to €41.2 million due to higher standards in maintenance, cleaning, and security.
The 2027–2031 investment plan includes €12.888 billion, with around €4 billion allocated to commercial services and passenger experience improvements. Expansion into Brazil, with strategic airports such as Congonhas, diversifies the company’s geographic exposure and increases revenue potential. This reinforces sustainable growth and cash flow generation.
Technical Analysis
From a stock market perspective, Aena has shown an upward trend since 2023, supported by air traffic recovery and revenue diversification.
Support and resistance levels: Key support is at €21.80, corresponding to the May rally that preceded the all-time highs in August at €25.82 per share.
Moving averages: The stock has corrected from its highs and is currently around the 200-day moving average, having temporarily lost the 50- and 100-day averages.
Momentum indicators: The RSI indicates a recovery from oversold levels, while the MACD remains bearish, reflecting recent selling pressure.
Market context: The correction occurs amid portfolio rotation and position exits by large funds. The ActivTrades Europe Market Pulse shows a high Risk-Off level, confirming this scenario.
Potential scenarios:
If the support at €21.80 holds and the stock surpasses the mid-range point (POC) at €22.96, a rebound toward previous highs could occur, potentially boosted by the holiday rally.
If the support fails, the next level is around €20, followed by €19.225 as an additional support.
VIP segment key for growth
Aena’s VIP segment is consolidating as a profitable and strategic business, with sustained growth potential thanks to expansions in Spain and Brazil, service diversification, and solid revenue management. From a market perspective, the company has strong fundamentals and a clear technical context, making Aena an attractive option for investors seeking exposure to the airport sector and high-value premium commercial operations.
*******************************************************************************************
The information provided does not constitute investment research. The material has not been prepared in accordance with the legal requirements designed to promote the independence of investment research and such should be considered a marketing communication.
All information has been prepared by ActivTrades ("AT"). The information does not contain a record of AT's prices, or an offer of or solicitation for a transaction in any financial instrument. No representation or warranty is given as to the accuracy or completeness of this information.
Any material provided does not have regard to the specific investment objective and financial situation of any person who may receive it. Past performance and forecasting are not a synonym of a reliable indicator of future performance. AT provides an execution-only service. Consequently, any person acting on the information provided does so at their own risk. Political risk is unpredictable. Central bank actions can vary. Platform tools do not guarantee success.
Solaria triples profits and aims to surpass €250 millionSolaria triples profits and aims to surpass €250 million in EBITDA
Ion Jauregui – Analyst at ActivTrades
Solaria Energía y Medio Ambiente has reported exceptional results in the first nine months of 2025, with a net profit of €141.7 million, a 148% increase compared to the same period last year. Revenues rose to €258.9 million, up 65%, while EBITDA reached €230 million, a 75% increase over 2024.
The company attributes this growth to the commissioning of new solar plants, optimization of financial costs, and diversification into new businesses such as energy storage and data centers. Solaria is on track to exceed its €250 million EBITDA target for the year, supported by international growth and the hybridization of its Garoña solar complex with 175 MW wind farms.
Operationally, the company will have 3 GW installed by year-end, and 4.4 GW in operation and construction, highlighting projects such as Garoña (710 MW), Cataluña (200 MW), and Peralveche (150 MW). Additionally, it has received environmental approval to install 908 MWh of batteries across 11 solar plants, reinforcing its commitment to the energy transition and innovation.
From a financial perspective, Solaria maintains a net debt of €1.316 billion, equivalent to 4.5× last 12 months EBITDA, but with positive operating cash flow and a share buyback program of up to 10% of share capital, of which 2.85% has already been executed.
Technical Analysis
On the market, SLR.ES is trading around €16, close to its 52-week high of €16.38, with a bullish candlestick forming in early Monday trading. The stock is above its 50-, 100-, and 200-day moving averages, with positive MACD momentum and an RSI in overbought territory at 66.16%, suggesting room for further gains. Key support levels are around €14.3 and €13.03, while a clear break above recent highs could drive the stock toward new peaks after consolidation movements throughout November.
Conclusion
Solaria combines strong fundamentals and operational growth with a favorable technical setup, establishing itself as a strategic player in solar energy and energy digitalization in Europe. The stock offers opportunities for medium- to long-term investors drawn by its energy transformation and diversification, as well as for traders looking to capitalize on current bullish momentum.
*******************************************************************************************
The information provided does not constitute investment research. The material has not been prepared in accordance with the legal requirements designed to promote the independence of investment research and such should be considered a marketing communication.
All information has been prepared by ActivTrades ("AT"). The information does not contain a record of AT's prices, or an offer of or solicitation for a transaction in any financial instrument. No representation or warranty is given as to the accuracy or completeness of this information.
Any material provided does not have regard to the specific investment objective and financial situation of any person who may receive it. Past performance and forecasting are not a synonym of a reliable indicator of future performance. AT provides an execution-only service. Consequently, any person acting on the information provided does so at their own risk. Political risk is unpredictable. Central bank actions can vary. Platform tools do not guarantee success.
 Long
Long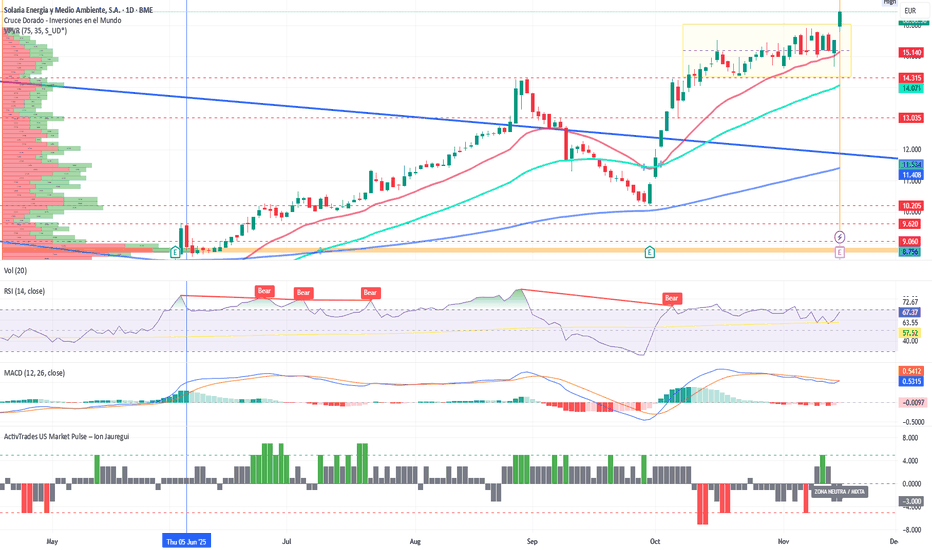
Repsol Reaches Seven-Year HighsRepsol Reaches Seven-Year Highs: Market Strength and Upside Potential in 2025
By Ion Jauregui – Analyst at ActivTrades
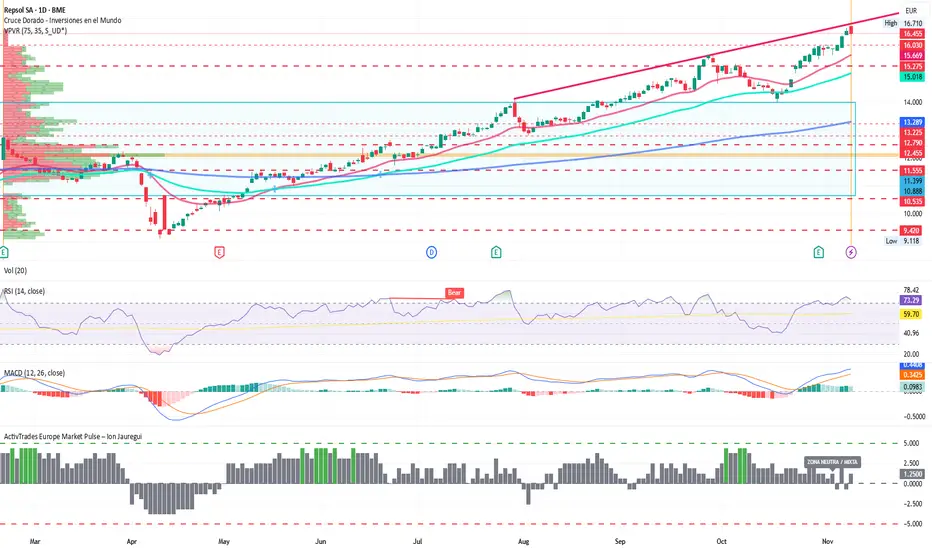
Repsol continues to consolidate its leadership within the Ibex 35 after posting a 16% gain over the past three weeks, reaching €16.40 per share, levels not seen since 2018. So far in 2025, the oil company has accumulated a 41% revaluation, outperforming the Spanish benchmark index and confirming its solid performance despite a less favorable energy environment.
Fundamental Analysis
During the first nine months of the year, Repsol reported a net profit of €1.177 billion, down 34.3% year-on-year, affected by the decline in crude oil prices, which have fallen from $82 to $64 per barrel (-22%). Nonetheless, the company maintains a solid financial structure, a healthy balance sheet, and an attractive dividend yield of 6.4% for 2026, following confirmation of a €0.50 per share payment in January and another likely distribution in July.
The market views positively Repsol’s ability to generate cash flow even under lower oil prices, along with its diversification into renewables and biofuels, factors that strengthen its sustainable profile and appeal to institutional investors. Several Spanish and European banks have highlighted its attractiveness, emphasizing shareholder remuneration and its positioning in exploration and production projects for 2026–2027. Market consensus places the target price between €18 and €20, maintaining an optimistic tone. The strategic review scheduled for March 2026 will be key in defining the company’s next growth phase.
Technical Analysis
From a technical perspective, Repsol confirmed a bullish breakout late last week after surpassing €16.18, consolidating its upward trend. However, Monday’s bearish candle close suggests a potential temporary ceiling within the current move. The key support lies at €16.03, followed by the 50-day moving average, which—if maintained—would reinforce the continuation of buying momentum.
The next technical target is set around €17.00, while a sustained break below €15.60 could trigger a corrective phase toward the €15.00–14.80 area.
In terms of indicators, the RSI has eased from 78.4% to 73.3%, reflecting a slight moderation in momentum, while the MACD remains positive, suggesting a sideways consolidation phase before a potential medium-term bullish continuation.
Conclusion
Repsol remains one of the strongest companies in the Ibex 35, combining solid fundamentals, a high dividend yield, and a constructive technical setup. Short-term profit-taking may occur, but as long as the stock holds above key support levels, the underlying bullish trend remains intact. Looking ahead to 2026, the strategic review and the global energy context will be decisive in determining whether Repsol can consolidate above the €17–18 range, paving the way for new cycle highs.
*******************************************************************************************
The information provided does not constitute investment research. The material has not been prepared in accordance with the legal requirements designed to promote the independence of investment research and such should be considered a marketing communication.
All information has been prepared by ActivTrades ("AT"). The information does not contain a record of AT's prices, or an offer of or solicitation for a transaction in any financial instrument. No representation or warranty is given as to the accuracy or completeness of this information.
Any material provided does not have regard to the specific investment objective and financial situation of any person who may receive it. Past performance and forecasting are not a synonym of a reliable indicator of future performance. AT provides an execution-only service. Consequently, any person acting on the information provided does so at their own risk. Political risk is unpredictable. Central bank actions can vary. Platform tools do not guarantee success.
 Long
Long
Indra Strengthens Its Defense Leadership Indra Strengthens Its Defense Leadership Amid Talent Exodus from Santa Bárbara
By Ion Jauregui – Analyst at ActivTrades
Indra has intensified its commitment to the defense sector with a strategic move that marks a turning point in the Spanish industry: the recruitment of more than 15 executives from Santa Bárbara Sistemas, a subsidiary of General Dynamics, with around twenty more in the process of joining. This move comes amid fierce competition for defense talent, consolidating the Spanish tech company’s leadership in the land sector with its new division, Indra Land Vehicles.
Fundamental: Growth, Diversification, and Industrial Autonomy
Indra’s decision to compete independently in the development and production of armored vehicles is part of its Leading the Future 2030 strategic plan, aimed at strengthening its role as a national integrator in defense, security, and dual-use technology. The acquisition of the El Tallerón plant (Gijón) from Duro Felguera for €3.6 million, along with an additional investment of over €40 million to transform the facility, demonstrates a clear focus on vertical integration and technological autonomy.
The announcement of the delivery of 57 8x8 “Dragón” vehicles by year-end represents a key milestone after delays and internal disputes within the Tess Defence consortium. In addition, Indra has secured nearly 90% of public funding allocated to the Special Modernization Programs (PEM) in defense, ensuring resources to expand its presence in vehicle projects, command and control systems, and electronic capabilities.
From a financial perspective, the company maintains expanding operating margins and a strong order book, driven by contracts in defense, digitization, and air traffic management. This repositioning of its land business strengthens medium-term growth potential and reduces exposure to the civil sector.
Technical: Uptrend and Key Consolidation Levels
From a technical perspective, Indra (BME: IDR) has maintained a sustained uptrend since early 2024. After several upward impulses, the stock has continued its positive momentum throughout 2025, accumulating a year-on-year gain exceeding 35%. After reaching highs around €51.25, the stock entered a consolidation phase supported by the 50-day moving average (€46.67), respecting the main uptrend line. Currently, the control point is around €38.58, corresponding to the previous accumulation zone before the latest upward impulse.
Technical indicators show strength but suggest a potential short-term adjustment:
The RSI remains in overbought territory, stabilizing above 60%, indicating a technical pause after strong gains.
The MACD is approaching a bearish crossover, with the signal line above the indicator and the histogram entering negative territory, potentially signaling a short-term correction.
The 50-day moving average acts as the first significant support, with the next key level at €41.36. A break below this level could take the stock back to the control point at €38.58.
On the upside, a sustained break above the current highs (€51.25) would open the door to new targets around €55, keeping the underlying bullish structure intact.
Offensive in the Armored Vehicles Sector
Indra’s offensive in armored vehicles and its ability to attract strategic talent from Santa Bárbara reinforce its position as a central player in the Spanish defense ecosystem. In a context of increasing European military spending and a push for industrial sovereignty, the company consolidates a long-term vision based on innovation, technological independence, and operational efficiency.
With solid fundamentals and a robust technical structure, Indra stands out as one of the most attractive stocks in the defense sector in the Spanish market, maintaining the interest of both institutional and retail investors in the coming quarters.
*******************************************************************************************
The information provided does not constitute investment research. The material has not been prepared in accordance with the legal requirements designed to promote the independence of investment research and such should be considered a marketing communication.
All information has been prepared by ActivTrades ("AT"). The information does not contain a record of AT's prices, or an offer of or solicitation for a transaction in any financial instrument. No representation or warranty is given as to the accuracy or completeness of this information.
Any material provided does not have regard to the specific investment objective and financial situation of any person who may receive it. Past performance and forecasting are not a synonym of a reliable indicator of future performance. AT provides an execution-only service. Consequently, any person acting on the information provided does so at their own risk. Political risk is unpredictable. Central bank actions can vary. Platform tools do not guarantee success.
Supreme Court Limits Retroactive Deductions, IBEX Giants on AlerBy Ion Jauregui – Analyst at ActivTrades
The Spanish Supreme Court has set a significant precedent by preventing companies from deducting expenses corresponding to already prescribed fiscal years, restricting the possibility of making retroactive tax adjustments. The ruling, issued on October 7, establishes that expenses recorded outside their natural fiscal period cannot alter the taxable base of closed years, even under the principle of full regularization.
This decision, originating from a dispute between a company and the Spanish Tax Agency, clarifies that only expenses properly recorded in their corresponding fiscal year can be deducted for Corporate Income Tax purposes. Otherwise, such amounts must be charged directly to net equity, without affecting the accounting or tax results of the current year.
The impact of this ruling particularly affects large IBEX 35 companies with complex financial structures or long-term assets. Construction and infrastructure companies such as ACS, Ferrovial, Sacyr, and Acciona may be most exposed, as they often manage multi-year contracts, concessions, and disputes involving retroactive economic adjustments.
Likewise, energy and utility companies — Iberdrola, Endesa, Naturgy, Repsol — manage multi-million euro provisions for regulatory compensations or tax disputes, which could be non-deductible if identified after the prescription period. In the financial sector, banks and insurers such as Santander, BBVA, CaixaBank, and Mapfre may also face limitations when adjusting provisions or impairments from previous years.
The ruling reinforces the importance of accounting prudence and timing in expense recognition, noting that the tax authorities can review negative tax bases up to ten years back, but deductions only affect the last four non-prescribed fiscal years.
Technical Analysis of ACS
ACS shares closed yesterday at €72.60, slightly down for the week after reaching an all-time high of €73.20. The daily chart confirms a solid bullish structure in both medium and long term, supported by an ascending trendline initiated in January 2024. The 50-, 100-, and 200-day moving averages remain aligned upwards, reinforcing the consistency of the trend.
In the short term, the stock shows a phase of lateral consolidation around the October 15 price range, seeking momentum to reach its next technical target of €75, which aligns with the projection of the ascending channel. It will be crucial to monitor whether the buying momentum holds, as the stock could pause before breaking resistance.
Key support levels are at €69.50, €65, and €62.85, zones where the stock has historically reacted positively. A break below these levels could trigger a deeper correction toward the €60 area.
The RSI, currently at 61.6, indicates a mild healthy overbought condition, consistent with trend continuation, while the MACD remains in a positive lateral phase, showing no bearish divergence. The Point of Control (POC) of the volume profile is at €68.50, acting as dynamic support, with a secondary congestion zone around €71, where recent trading activity has concentrated.
According to the ActivTrades Europe Market Pulse, market risk has normalized toward neutral levels, indicating a balance between supply and demand following the recent bullish impulse.
In conclusion, ACS maintains a structurally strong bullish trend, supported by solid technical foundations and sustained buying flow. However, in the short term, it may undergo a phase of consolidation before attempting to surpass the €75 resistance, which would confirm the continuation of its long-term upward momentum.
In the context of the recent Supreme Court ruling limiting deductions for prescribed fiscal years, a higher degree of accounting prudence is expected among IBEX 35 giants. This new framework could temporarily moderate margin evolution — especially in the infrastructure sector — favoring lateral or technical adjustment behavior in stocks like ACS, despite the structural strength of its primary trend.
*******************************************************************************************
The information provided does not constitute investment research. The material has not been prepared in accordance with the legal requirements designed to promote the independence of investment research and such should be considered a marketing communication.
All information has been prepared by ActivTrades ("AT"). The information does not contain a record of AT's prices, or an offer of or solicitation for a transaction in any financial instrument. No representation or warranty is given as to the accuracy or completeness of this information.
Any material provided does not have regard to the specific investment objective and financial situation of any person who may receive it. Past performance and forecasting are not a synonym of a reliable indicator of future performance. AT provides an execution-only service. Consequently, any person acting on the information provided does so at their own risk. Political risk is unpredictable. Central bank actions can vary. Platform tools do not guarantee success.
 Long
Long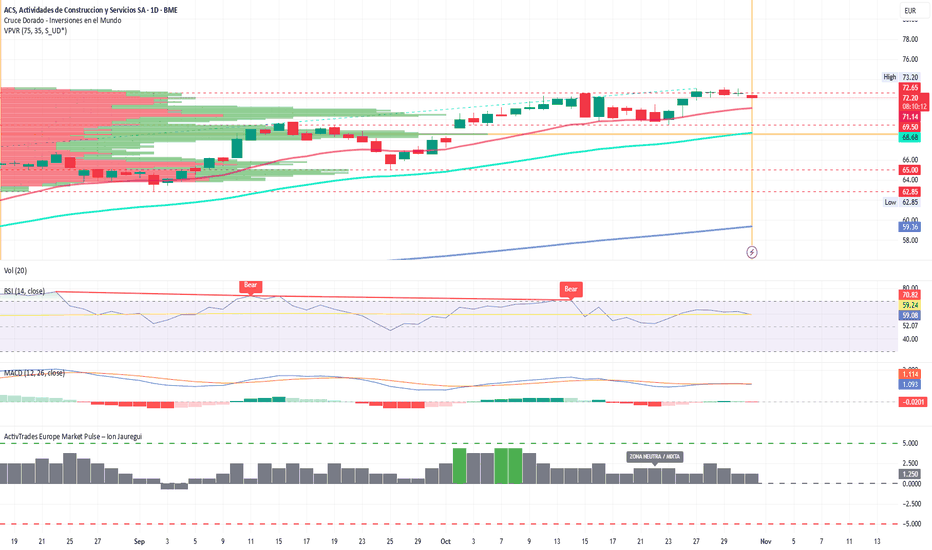
Indra Secures 100% of Spanish Defense CreditsIon Jauregui – Analyst at ActivTrades
The Indra Group (AIR.MC) has become the major player in the Spanish defense sector by securing the entirety of the new €4.7 billion loans that the Ministry of Industry and Tourism will allocate to ten Special Modernization Programs (PEM). These funds, granted at zero interest and without guarantees, will be repaid in line with Defense payments and distributed over several years, some until 2031. The package is part of Spain’s commitment to the United States to reach 2% of GDP in defense and strengthens Indra as the main technological driver of the sector.
In addition to the company chaired by Ángel Escribano, other beneficiaries will include Escribano Mechanical & Engineering, participating in at least three projects, as well as Telefónica, GMV, Epicom, and Cipherbit. The projects cover everything from telecommunications and cybersecurity systems to ammunition vehicles, command and control systems, ground combat, and missile defense, according to the Industrial and Technological Plan for Security and Defense. In total, these initiatives will mobilize €13 billion and generate more than 23,000 direct jobs and 60,000 indirect jobs.
This deployment comes in a context marked by international tensions and the need to meet military spending commitments, especially in projects such as the 8x8 armored vehicles, which have faced delays and technical issues in recent months.
The Spanish defense sector closed 2024 with record highs: consolidated revenues of €16.153 billion, a year-on-year growth of 16.2%, although it remains concentrated in major companies such as Airbus, Navantia, and Indra. The direct allocation of the credits reinforces Indra’s position as a central hub for technological modernization of the Armed Forces.
Technical Analysis: Indra (Ticker AT:IDR.es)
Indra’s stock has maintained bullish momentum in recent months, driven by defense contract announcements, reaching session highs last Friday:
Key Supports: €38.64 and the point of control (POC) area around €34.92, levels where it could stabilize in the event of corrections.
Resistances: Around the highs at €41.34, a level that could trigger a free upward move.
Indicators: RSI at 60.29%, positive MACD, volume decreasing since the beginning of the month. The moving average crossover on September 23 has kept the range wide, supporting the price above the 50-day moving average.
The ActivTrades Europe Market Pulse indicator signals a Risk Neutral/Mixed market, indicating general stability in the European market.
Conclusion:
Indra consolidates its position as the benchmark of the Spanish defense sector, playing a leading role in strategic state-funded programs. The company combines institutional backing, technological growth, and stock market appeal, although program execution and technical delays will be key factors to monitor in the coming years.
*******************************************************************************************
The information provided does not constitute investment research. The material has not been prepared in accordance with the legal requirements designed to promote the independence of investment research and such should be considered a marketing communication.
All information has been prepared by ActivTrades ("AT"). The information does not contain a record of AT's prices, or an offer of or solicitation for a transaction in any financial instrument. No representation or warranty is given as to the accuracy or completeness of this information.
Any material provided does not have regard to the specific investment objective and financial situation of any person who may receive it. Past performance and forecasting are not a synonym of a reliable indicator of future performance. AT provides an execution-only service. Consequently, any person acting on the information provided does so at their own risk. Political risk is unpredictable. Central bank actions can vary. Platform tools do not guarantee success.
 Long
Long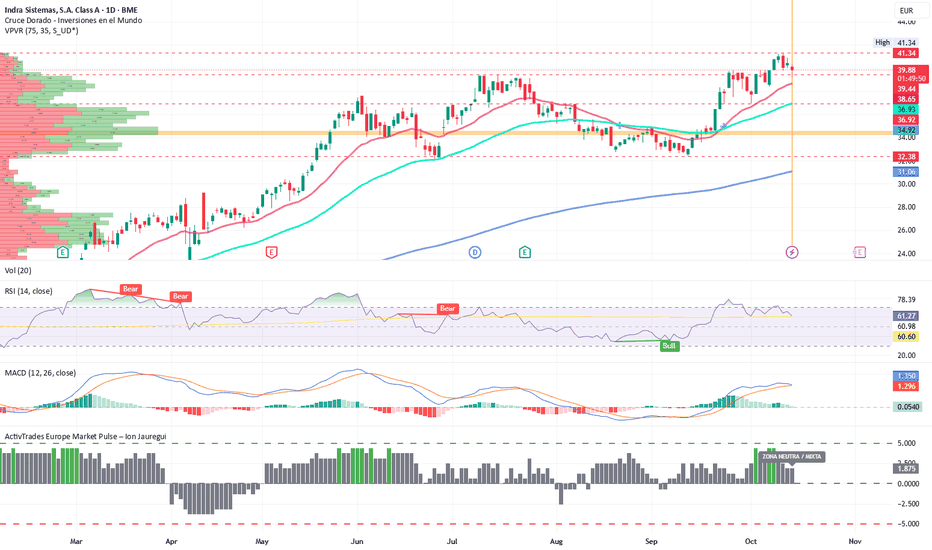
Merlin and Iberdrola Drive Spain’s Largest Green Data Center
By Ion Jauregui – Analyst at ActivTrades
Merlin Properties has taken a decisive step in its strategic plan to establish itself as a key player in the data center sector in Southern Europe. The REIT has formed a partnership with Iberdrola to ensure the supply of renewable energy to the Bilbao Arasur campus, located in Ribabellosa (Álava), which is set to become Spain’s largest data center, with a total capacity of 350 MW IT.
Iberdrola will build a 125.89 MW photovoltaic park in Armiñón, the largest in the Basque Country, which will power the complex under a long-term Power Purchase Agreement (PPA). The investment will amount to €70 million and will be managed by Ekienea, a company jointly owned by Iberdrola (75%), the Basque Government (18%), KREAN (5%), and the Alava Provincial Council (2%). The facility is expected to be fully operational by 2027.
The project is part of Merlin’s Mega Plan, which involves a total investment of €2.4 billion by 2028, with operations in Madrid, Bilbao, Barcelona, and Lisbon. Arasur will serve as its flagship campus: it already has a first operational building of 22 MW IT and a second under construction of 48 MW IT, with future phases expected to increase capacity to 70 MW IT per building.
From a strategic perspective, this partnership strengthens Merlin’s sustainability and business predictability. By securing stable, green energy over the long term, the company mitigates exposure to electricity price volatility and reinforces its ESG positioning. Additionally, the data center business is expected to generate recurring revenues exceeding €400 million annually by 2029, nearly double the current rental income.
Technical Analysis
In the markets, Merlin shares are currently trading around €13.26, after reaching annual highs near €13.36. The stock maintains a bullish trend, with an RSI of 66.8% and a positive MACD, suggesting continued upward momentum, though there is some risk of a pullback if resistance levels are not broken.
The moving average crossover remains bullish, with the 50-day moving average acting as support, aligned with the Point of Control (POC) in the mid-range. Key technical levels are €12.78 as primary support and €12.31 as secondary support, while the current highs represent immediate resistance.
A strong break above this level could open the way to targets in the €14–€14.50 range, while a pullback could bring the price back toward the identified support levels.
Robust Growth Strategy
Merlin combines a robust digital infrastructure growth strategy with a favorable technical outlook, reinforcing its appeal to investors seeking exposure to sustainable and tech-driven assets within the European real estate market.
*******************************************************************************************
The information provided does not constitute investment research. The material has not been prepared in accordance with the legal requirements designed to promote the independence of investment research and such should be considered a marketing communication.
All information has been prepared by ActivTrades ("AT"). The information does not contain a record of AT's prices, or an offer of or solicitation for a transaction in any financial instrument. No representation or warranty is given as to the accuracy or completeness of this information.
Any material provided does not have regard to the specific investment objective and financial situation of any person who may receive it. Past performance and forecasting are not a synonym of a reliable indicator of future performance. AT provides an execution-only service. Consequently, any person acting on the information provided does so at their own risk. Political risk is unpredictable. Central bank actions can vary. Platform tools do not guarantee success.
 Long
Long
Could Solaria Be Losing Its Bullish Momentum?By Ion Jauregui – ActivTrades
Solaria Energía y Medio Ambiente (BME: SLR) has remained one of the standout stocks in the Ibex 35, driven by both its strong financial results and its technical performance on the market. The company closed the first six months of the year with a net profit of €82 million, nearly double (+97%) compared to the same period last year, partly boosted by the Stonepeak transaction in its Generia land subsidiary. Revenue reached €155 million, up 59%, while EBITDA stood at €140 million, 66% higher than in 2024. These results consolidate its visibility on medium-term catalysts and strengthen investor confidence in its growth.
Growth Strategy and Outlook
Solaria continues its share buyback program, aiming to reach up to 10% of share capital, reinforcing the board's confidence in the company’s intrinsic value. In addition, the company is diversifying its activities through solar-battery hybrid projects, the incorporation of wind energy projects, and entry into the data center business. Renewable energy demand continues to rise, and Solaria benefits from its strategic positioning in the sector. The company has secured more than 1.2 GW of connection capacity to supply data centers, with an additional 2.7 GW requested in Spain and 5.3 GW across Italy, Germany, and the UK. Solaria has reaffirmed its target of achieving an EBITDA of €245–255 million for the full year, with high visibility for the second half. This target is supported by the commissioning of new photovoltaic complexes in Spain, including Garoña (710 MW), Cataluña (200 MW), Peralveche (150 MW), and Tucana (45 MW).
Technical Analysis: Bullish Engulfing Pattern
From a technical perspective, Solaria has gone through a classic correction following the strong rally that drove its share price from €6 to €14.30 between April and August. Currently, the stock trades around €11.33, after hitting a low of €10.20, forming a bullish engulfing pattern, a potential signal of a new upward move. Key support levels are at €10.30 and €9.30, while resistances are at €12.60 and €14. A close above €13 could open the path to new highs. RSI and MACD indicators show signs of gradual recovery, with RSI at 46.94 and MACD still negative but showing potential for a bullish turn. Moving averages show a bearish crossover of the 50-day below the 100-day average, while the price is currently supported by the 200-day average. The Point of Control (POC) is around €10.20, above the annual lows of €9.06. A bullish push could test the €13 resistance, whereas a continuation of the correction would make the POC a critical level to watch for price stability. Intuitively, the stock touched a technical floor on Tuesday, with little indication of further downside.
Recovery and Stability
Solaria remains attractive in the Ibex 35 after consolidating its financial results and overcoming the correction of recent months. The stock shows signs of recovery and stability, and although it still faces significant resistance levels, recent developments suggest it could resume its bullish momentum, supported by its strong position in the renewable energy sector.
*******************************************************************************************
The information provided does not constitute investment research. The material has not been prepared in accordance with the legal requirements designed to promote the independence of investment research and such should be considered a marketing communication.
All information has been prepared by ActivTrades ("AT"). The information does not contain a record of AT's prices, or an offer of or solicitation for a transaction in any financial instrument. No representation or warranty is given as to the accuracy or completeness of this information.
Any material provided does not have regard to the specific investment objective and financial situation of any person who may receive it. Past performance and forecasting are not a synonym of a reliable indicator of future performance. AT provides an execution-only service. Consequently, any person acting on the information provided does so at their own risk. Political risk is unpredictable. Central bank actions can vary. Platform tools do not guarantee success.
Long 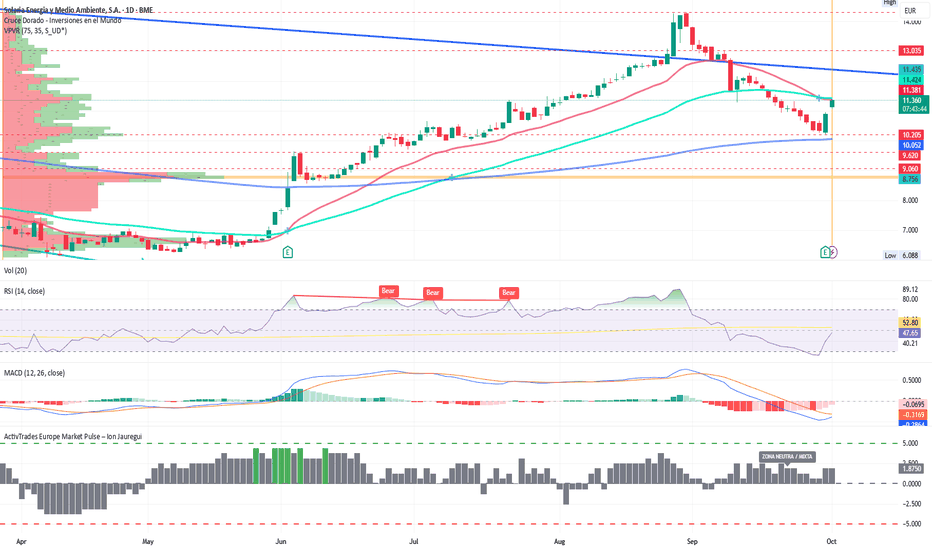
Airbus,Leonardo and Thales:Europe targets space- Project BromoAirbus, Leonardo and Thales: Europe targets space with Project Bromo
By Ion Jauregui – Analyst at ActivTrades
The planned agreement between Airbus (EPA: AIR), Leonardo (BIT: LDOF), and Thales (EPA: TCFP) to merge their satellite divisions under Project Bromo represents a far-reaching strategic move for the European aerospace sector. The goal is to challenge giants such as SpaceX/Starlink and Chinese state programs, while strengthening the European Union’s strategic autonomy in a key industry. For Airbus, a leader in defense and space, this step would expand its diversification beyond commercial aviation, consolidating its role as a benchmark in satellites and secure communications. Leonardo would benefit by expanding its footprint in a high-growth market, while Thales contributes its expertise in electronics and cybersecurity, essential for satellite applications. If the timeline is met, with a framework agreement in 2024 and final closing in 2025, Europe will have a space champion capable of competing on a global scale.
Technical analysis of Airbus (Ticker AT: AIR)
Airbus shares remain in a long-term uptrend that began in October 2022, moving within an ascending channel that has consistently respected the 200-day moving average. On Thursday, the stock hit a new high at €195, before closing Friday at €193.66, after firmly breaking through the key resistance of €186.92. The long-term outlook points to a continuation toward the €200 level.
At the start of the week, a corrective move cannot be ruled out, potentially testing the breakout zone from last Tuesday. Moving average crossovers maintain a strong configuration, supporting the continuation of the main trend. In the short term, the RSI stands at 68.54%, close to overbought territory, which increases the likelihood of a technical pullback. In contrast, the MACD remains in an expansionary bullish phase, with the signal line above the histogram in positive territory, confirming strong momentum and directionality.
The ActivTrades Europe Market Pulse currently reads 2.5, leaning toward risk-on, though still with a neutral-mixed bias, reflecting cautious buying appetite in European markets. The point of control (POC) sits at €162.44, in line with the 50-day moving average, serving as a key support level. In the event of a correction, €173.54 and €168.24 stand as intermediate supports. Conversely, if the price holds above the current breakout, Airbus would enter free upside, with the next psychological target set at €200 in the short term.
Bromo vs. SpaceX-Starlink
Airbus is at a critical technical juncture: the recent breakout has reinforced its bullish bias, but proximity to overbought levels suggests possible short-term adjustments. Fundamentally, Airbus maintains a robust order book, supported by the recovery of global air traffic and rising demand for fuel-efficient aircraft. Furthermore, its participation in strategic European defense and satellite initiatives such as Project Bromo strengthens its diversification and competitive stance against U.S. rivals that currently dominate the market. These factors underpin its current valuation and provide additional support to the bullish outlook reflected in the technical picture.
*******************************************************************************************
The information provided does not constitute investment research. The material has not been prepared in accordance with the legal requirements designed to promote the independence of investment research and such should be considered a marketing communication.
All information has been prepared by ActivTrades ("AT"). The information does not contain a record of AT's prices, or an offer of or solicitation for a transaction in any financial instrument. No representation or warranty is given as to the accuracy or completeness of this information.
Any material provided does not have regard to the specific investment objective and financial situation of any person who may receive it. Past performance and forecasting are not a synonym of a reliable indicator of future performance. AT provides an execution-only service. Consequently, any person acting on the information provided does so at their own risk. Political risk is unpredictable. Central bank actions can vary. Platform tools do not guarantee success.
 Long
Long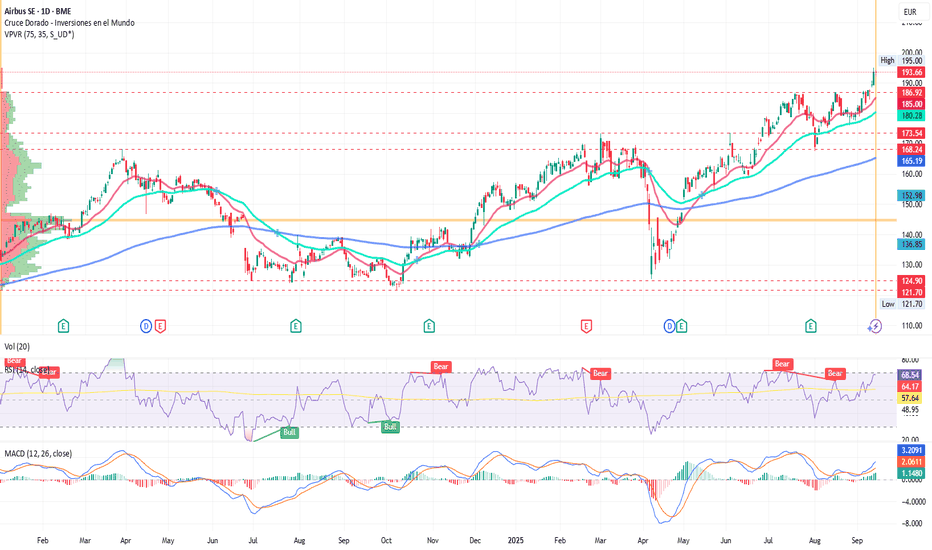
Youth Momentum and Digitalization Drive InditexStradivarius and Bershka Lead Inditex’s Youth Appeal with Digitalization as a Growth Engine
By Ion Jauregui – Analyst at ActivTrades
Inditex’s youth-oriented chains — Stradivarius, Bershka, and Pull&Bear — have become the growth engine of the Galician fashion giant in the first half of 2025. Stradivarius leads the way with a 5.7% increase in sales, reaching €1.327 billion. Bershka follows with a 4% rise to €1.438 billion, consolidating its position as the group’s second-largest brand behind Zara. Pull&Bear completes the trio with a 3% gain, generating €1.158 billion in revenue.
Meanwhile, Oysho also posted a strong 5.7% increase, reaching €389 million, thanks to its repositioning towards sportswear and leisure fashion. In contrast, Massimo Dutti showed a decline of 0.9%, down to €895 million, while Zara, including Zara Home and Lefties, grew by just 0.9%, though with a much larger volume, reaching €13.15 billion.
Technological Innovation: Smart Tagging
Beyond the numbers, Inditex continues to advance its technological transformation. The group has rolled out an RFID smart tagging system, allowing each garment to be identified in real time, improving inventory management, and enabling smoother shopping experiences. The system is already fully operational at Zara and is being expanded to Bershka and Pull&Bear, complementing services such as Click & Collect and self-checkout stations.
Stock Market Performance
Despite first-half revenue growing by just 1.6%, markets have reacted positively to signs of improvement in the second half of the year. Inditex shares jumped 6.52% following its results release, and another 2.66% the next day, marking a 9.4% gain in two sessions. This performance put the company at the top of the Ibex 35 and boosted its market capitalization to €145.4 billion, reinforcing its standing as a global fashion leader.
In short, youth-driven growth and digitalization are putting Inditex back on a recovery path that could solidify in the third quarter, even if its overall growth remains more moderate compared to pre-pandemic years.
Technical Analysis – Industria de Diseño Textil SA (Ticker: AT: ITX.ES)
Inditex shares closed yesterday around €46.64, recording a rally of nearly 9.4% in just two sessions, fueled by optimism around its results. The chart reflects a clearly bullish short-term bias and a consolidation phase in the longer term, as the price attempts to break the upper range while holding above key moving averages — a setup not seen since June.
The current support lies near €44.68, with a secondary level at €43.58, which recently acted as resistance and now serves as a pivot point. This level aligns with the 200-day moving average, potentially signaling a turning point from sideways action into a more defined bullish trend. On the upside, investors are eyeing resistance at €48.5 and €49.5, levels that could cap short-term gains.
The RSI indicates overbought conditions, leaving room for short-term pullbacks after the sharp rally, though the technical structure remains solid. In the medium term, a breakout above €49 would pave the way for a test of yearly highs, while a drop below €44 would serve as an early warning of weakness. The MACD also confirms a recent bullish crossover.
According to the ActivTrades Europe Market Pulse, European markets currently show a neutral-mixed stance, reflecting a balanced environment since mid-June, albeit with intermittent risk-on impulses that have yet to trigger any signs of alarm.
Youth Pays the Bills
The momentum of Inditex’s youth-oriented brands, coupled with its digital push, cements the group’s leadership in the sector. At the same time, its stock maintains a bullish tone, supported by solid levels and resistance points near €49, which represent the next challenge for investors.
In essence, Inditex enters the third quarter in a technically favorable context, with markets rewarding both its operational progress and the outlook for sustained upside momentum.
*******************************************************************************************
The information provided does not constitute investment research. The material has not been prepared in accordance with the legal requirements designed to promote the independence of investment research and such should be considered a marketing communication.
All information has been prepared by ActivTrades ("AT"). The information does not contain a record of AT's prices, or an offer of or solicitation for a transaction in any financial instrument. No representation or warranty is given as to the accuracy or completeness of this information.
Any material provided does not have regard to the specific investment objective and financial situation of any person who may receive it. Past performance and forecasting are not a synonym of a reliable indicator of future performance. AT provides an execution-only service. Consequently, any person acting on the information provided does so at their own risk. Political risk is unpredictable. Central bank actions can vary. Platform tools do not guarantee success.
 Long
Long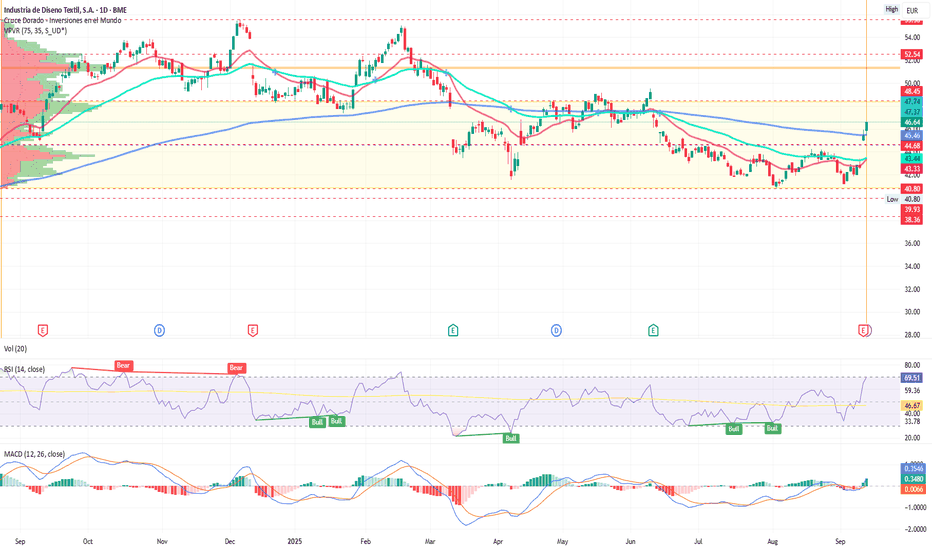
Iberdrola Strengthens Its Position in BrazilIberdrola secures control with the €1.88 billion purchase of 30% of Neoenergia from Previ
Ion Jauregui – Analyst at ActivTrades
Iberdrola has taken a decisive step in its international strategy by reaching an agreement with PREVI, the pension fund for Banco do Brasil employees, to acquire the 30.29% stake in its subsidiary Neoenergia. The deal, valued at 11.95 billion Brazilian reais (approximately €1.88 billion), will allow the Spanish utility to increase its control over the Brazilian company to 84% of the share capital.
The agreed price of 32.5 reais per share underscores Iberdrola’s commitment to a key growth market. Neoenergia supplies electricity to around 40 million people across six regional distributors and Brasilia, operating more than 725,000 kilometers of distribution lines and 3,800 MW of renewable capacity, mainly hydroelectric. In 2024, it was the company with the highest investment in basic infrastructure in Brazil, with expenditures exceeding 9.8 billion reais (€1.54 billion).
The acquisition strengthens Iberdrola’s networks business as a strategic pillar, with the company already managing 1.4 million kilometers of infrastructure in the United States, United Kingdom, Brazil, and Spain. Furthermore, the deal follows the sale of assets in Mexico and a recent capital increase, enabling Iberdrola to reinvest swiftly in strategic markets. Although speculation has arisen in the market regarding a possible delisting of Neoenergia, the company has not made any official statement on the matter.
Technical Analysis of Iberdrola
On the stock market, Iberdrola shares are trading around €15.73, showing a slight correction from yearly highs. The daily chart reflects an underlying upward trend supported by the uptrend line initiated in October 2024. Key support lies at €14.76, while immediate resistance stands at the yearly highs reached on August 22. Since early April, price action has consolidated between €14.72 and the current highs of €16.785, with a narrower trading range between €15.80 and €16.03 acting as the most visited area, centering the Point of Control (POC) around current levels.
The session opened with a bullish gap, lifting the price back to €15.78, slightly above the previous close. This support around the 100-day moving average could indicate an upward reversal despite mixed short-term signals. The RSI at 45.59% suggests slight oversold conditions, while the MACD has entered negative territory with a contracting bearish histogram, signaling possible indecision in the market. For now, both the 50-day and 100-day moving averages maintain their bullish slope, which could support a price recovery later this week.
Meanwhile, the ActivTrades Europe Market Pulse indicator points to a neutral–mixed stance across European markets, with decreasing volumes and a shift toward risk-off sentiment. A breakout above resistance could project the price toward the psychological level of €17.50, whereas a break below €16 would open the door to declines toward stronger support areas.
Iberdrola Strengthened Amid Portfolio Rotation
The Brazilian deal reinforces the company’s fundamental appeal and, combined with expectations for its new strategic plan at the end of the month, could sustain the stock’s positive bias in the short and medium term. The broader global market context is leaning toward neutrality with a risk-off tilt, a backdrop that typically benefits defensive companies like Iberdrola due to the stability of their regulated income and exposure to critical infrastructure. In this light, the Brazilian operation enhances Iberdrola’s profile as a defensive asset, while the upcoming strategic plan could act as an additional catalyst to consolidate its position as a safe haven within the European utilities sector.
*******************************************************************************************
The information provided does not constitute investment research. The material has not been prepared in accordance with the legal requirements designed to promote the independence of investment research and such should be considered a marketing communication.
All information has been prepared by ActivTrades ("AT"). The information does not contain a record of AT's prices, or an offer of or solicitation for a transaction in any financial instrument. No representation or warranty is given as to the accuracy or completeness of this information.
Any material provided does not have regard to the specific investment objective and financial situation of any person who may receive it. Past performance and forecasting are not a synonym of a reliable indicator of future performance. AT provides an execution-only service. Consequently, any person acting on the information provided does so at their own risk. Political risk is unpredictable. Central bank actions can vary. Platform tools do not guarantee success.
 Long
Long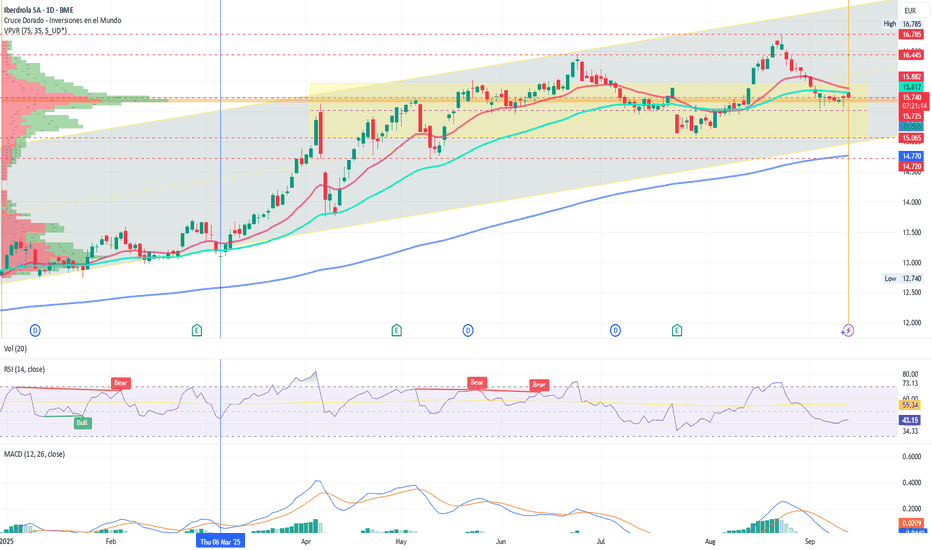
 Long
Long
 Long
Long
 Short
Short
Repsol Drives the Space Dream with the Miura 5 RocketBy Ion Jauregui – Analyst at ActivTrades
Spain is once again playing a leading role in space exploration thanks to the collaboration between the Alicante-based company PLD Space and Repsol, which will provide 100% renewable fuel for the launch of the Miura 5 rocket, scheduled for the end of 2025. Following the success of the Miura 1, PLD Space is advancing toward a reusable orbital model, a key step to reduce costs and minimize environmental impact. The bio-kerosene supplied by Repsol, made from used cooking oils and organic waste, will power the rocket, while future plans include the use of renewable hydrogen and captured CO₂ in its production.
Headquartered in Elche, PLD Space positions itself as a “satellite transporter.” Founded in 2015 by engineers Raúl Torres and Raúl Verdú, the company has become a European benchmark for small satellite launches. With the support of the European Space Agency, it is developing pioneering solutions to recover rockets using parachutes and maritime cranes, preventing them from becoming space debris.
These advances reinforce the close connection between energy and space exploration. Just like the International Space Station, which operates thanks to solar panels 400 km above Earth, the Miura 5 aims to take a further step: demonstrating that the energy transition can also reach space.
Impact of this investment on Repsol
Repsol is not only diversifying its business into aerospace innovation but also strengthening its energy transition strategy. In 2024, the company reported an adjusted net profit of €4.182 billion, supported by strong cash generation that allowed it to reduce debt and increase dividends. Its investment in renewables reached €2.3 billion, with key projects in Spain, the U.S., and Italy.
The partnership with PLD Space strengthens Repsol’s position in sustainable fuels, a market with growing regulatory support in Europe. This move not only enhances its brand as an innovative energy company but also opens doors to strategic contracts in high-value sectors such as aerospace.
Technical analysis of Repsol (Ticker AT: REP.ES)
On the markets, Repsol closed yesterday at €13.825, maintaining a consolidation process after recent months of recovery. The primary support is at €12.790, while immediate resistance is located at the summer highs of €14.110.
On the daily chart, the stock maintains a medium-term bullish bias after bouncing from the August 14 lows (€12.790), with additional support at €12.455 and the Point of Control (POC) around €12.057. The golden cross recorded on June 19 remains in place, with clearly separated moving averages, fueling the bullish trend.
The RSI at 62.81% indicates a gradual reduction in volatility, while the MACD remains positive, though the histogram suggests a possible correction. The ActivTrades Europe Market Pulse indicator sits in neutral territory, with a decline in the greed-risk volume (-2.5).
If the stock breaks above €14.110 and surpasses the €14.50 barrier, it could open the path toward €15.20, a psychological level and April high. Otherwise, selling pressure could push it back toward support zones.
In conclusion, the collaboration between Repsol and PLD Space not only drives innovation in the Spanish aerospace sector but also strengthens Repsol’s energy transition strategy. While the Miura 5 aims to mark a milestone in sustainable space exploration, the company maintains solid fundamentals and a technical setup that supports upside potential, consolidating its role as a reference in energy and innovation.
*******************************************************************************************
The information provided does not constitute investment research. The material has not been prepared in accordance with the legal requirements designed to promote the independence of investment research and such should be considered a marketing communication.
All information has been prepared by ActivTrades ("AT"). The information does not contain a record of AT's prices, or an offer of or solicitation for a transaction in any financial instrument. No representation or warranty is given as to the accuracy or completeness of this information.
Any material provided does not have regard to the specific investment objective and financial situation of any person who may receive it. Past performance and forecasting are not a synonym of a reliable indicator of future performance. AT provides an execution-only service. Consequently, any person acting on the information provided does so at their own risk. Political risk is unpredictable. Central bank actions can vary. Platform tools do not guarantee success.
Long 
BBVA: Turkey Gains Weight in International StrategyIon Jauregui – Analyst at ActivTrades
BBVA heads into the final stretch of 2025 with two major fronts: the takeover bid for Banco Sabadell, which could reshape the Spanish banking landscape, and the consolidation of its international presence. Meanwhile, its Turkish subsidiary Garanti is emerging as an increasingly important pillar, with forecasts pointing to a doubling of profits in the coming years and a contribution of up to 12% of the group’s total results.
BBVA’s Main Growth Driver
The bank, chaired by Carlos Torres, continues to rely on Mexico as its primary engine, but Turkey is expected to become a key contributor between 2025 and 2028. Garanti, which currently represents 7.5% of profits, could generate more than €4.8 billion in accumulated earnings over four years—more than double the amount recorded between 2021 and 2024.
The strategic plan is based on a gradual improvement in Turkey’s macroeconomic environment: inflation declining (from 34% expected this year to 16.7% in 2028), falling interest rates, and GDP growth rising from 3.5% to 4.2%. These conditions would support revenue growth of between 16% and 20% over the period, along with improved operating efficiency, with the cost-to-income ratio falling to 30–33% from the current 44.8%.
Nevertheless, volatility in the Turkish lira (-24.4% over the past year) and regulatory uncertainty remain risks that investors must take into account.
Technical Analysis
BBVA shares closed Monday at €16.145, consolidating after reaching yearly highs. In the short term, key support lies around €13.9, followed by the previous consolidation zone and point of control (POC) around €13.0. Immediate resistance is set at the highs of €16.7.
A breakout above these highs would open the way toward €18.0, while a loss of support could push the stock down to €12.645, or even €11.085 in the event of a sharp decline.
Momentum indicators suggest some buyer fatigue, calling for caution in the short term. The RSI stands in overbought territory at 67.06%, starting a corrective move. The MACD has also entered a corrective phase, with the histogram turning negative. Additionally, the ActivTrades Europe Market Pulse indicates that the European market is currently in neutral territory, with the index at 3.750, suggesting that markets are gradually approaching a risk-on environment.
BBVA Faces a Decisive Moment
The integration with Sabadell could strengthen BBVA’s position in Spain, while Turkey gains weight as an additional profit driver. From a fundamental perspective, the bank combines geographical diversification with growth potential, though it also faces macroeconomic risks in emerging markets. On the stock market, BBVA is in a consolidation phase, and the technical outlook will determine whether investors opt for a new bullish leg or a correction.
The combination of strategic and technical factors places BBVA firmly in the spotlight as 2026 approaches.
*******************************************************************************************
The information provided does not constitute investment research. The material has not been prepared in accordance with the legal requirements designed to promote the independence of investment research and such should be considered a marketing communication.
All information has been prepared by ActivTrades ("AT"). The information does not contain a record of AT's prices, or an offer of or solicitation for a transaction in any financial instrument. No representation or warranty is given as to the accuracy or completeness of this information.
Any material provided does not have regard to the specific investment objective and financial situation of any person who may receive it. Past performance and forecasting are not a synonym of a reliable indicator of future performance. AT provides an execution-only service. Consequently, any person acting on the information provided does so at their own risk. Political risk is unpredictable. Central bank actions can vary. Platform tools do not guarantee success.
 Short
Short
European Insurers: Yield Half That of Banks European Insurers: Yield Half That of Banks in a Low-Interest Environment
By Ion Jauregui – Analyst at ActivTrades
The European insurance sector has shown remarkable resilience over the past three years, initially benefiting from the European Central Bank’s (ECB) interest rate hikes and maintaining solid performance despite rates declining over the past year. Since the start of the monetary tightening cycle in July 2022, insurers have gained 64% in the stock market, half the advance seen in banks (+125%), yet significantly outperforming the Stoxx 600 (+20%). The EuroStoxx50, the benchmark index of major Eurozone companies, has posted a positive performance in 2025 with a year-to-date return of 13.65%, reflecting a solid recovery in the European market. This performance has been driven by sectors such as technology, healthcare, finance, and industrials, which have reported earnings growth exceeding expectations.
Banks Riding High, Insurers Lagging Behind
According to the latest Refinitiv/Euro Stoxx Banks data for 2025, the average PER of the European banking sector stands at around 9.8x, while the 10-year historical average PER has been approximately 8.2x. Thus, the European banking sector currently trades at a 19.5% premium to its historical average.
For the European insurance sector, the current average PER is around 12x, compared to a 10-year historical average of approximately 9x. Insurers are currently trading at a premium slightly above 33% relative to banks, a historically narrower gap than in the past, when it exceeded 80%. This adjustment reflects both earnings growth and a solid dividend policy, maintaining the sector’s attractiveness amid economic slowdown.
The life and health business has been key to the sector’s rebound, with revenue growth of 12.2% through June, according to Unespa and Icea data. Mapfre Economics estimates the insurance gap in Spain at around €41.4 billion, pointing to significant expansion potential. Across Europe, major players such as Allianz (+17%), Axa (+18%), and Zurich (+5%) ended the first half positively, while companies like Prudential (+50%), Aviva (+38%), and Admiral (+30%) posted remarkable gains.
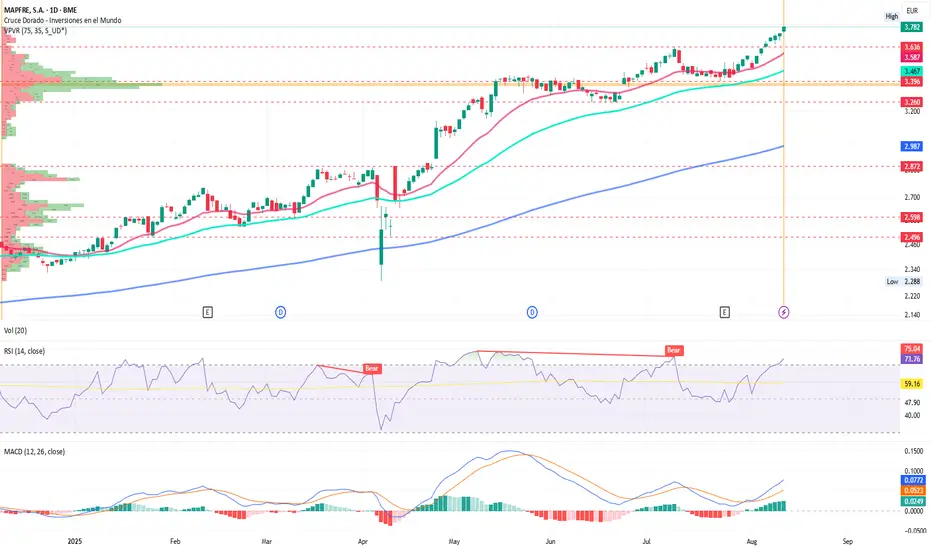
Mapfre: Technical Strength and Relative Attractiveness
Mapfre stands out among peers due to its strong stock recovery (+almost 50% in 2025) and attractive valuation, with a PER below 10 compared to the sector average of 12. From a technical perspective, the stock trades at €3.78, consolidating above a key support zone at €3.63–3.70. A break above resistance at €3.80 could open a path toward the €4.00–4.05 zone, previous highs from 2018, while a drop below €3.65 would risk a correction toward €3.50. Key support levels are located around €3.63, the second support above the point of control (POC) at €3.396, and the third support at the lower end of the current accumulation area at €3.260. The RSI is currently highly overbought at 73.76%, and the MACD remains strongly bullish, supported by increasing histogram volume.
Strong claims performance, an improved combined ratio, and a ROE of 12.2% support the trend, while a dividend yield above 6% enhances its appeal for defensive investors.
Sector / Company Current PER Historical Avg. PER Premium (%) Performance 2025 YTD*
Mapfre 9,8x 9x 9% +48%
European Insurers 12x 9x 33% +14%
European Banks 9,8x 8,2x 19,5% +20%
Eurostoxx50 18x 16x 12,5% +8%
Stoxx600 15x 14x 7% +6%
*Performance as of August 2025. Ion Jauregui (2025)
Key Takeaways
• Mapfre stands out within the insurance sector, with a PER below the European average and a notable 48% gain year-to-date in 2025.
• This highlights that, despite the sector’s overall premium, Mapfre remains an attractive stock due to its growth potential and dividend.
• Comparing with EuroStoxx50, Stoxx600, and banks shows that the financial sector has led European market gains, though with significant differences between banks and insurers.
*******************************************************************************************
The information provided does not constitute investment research. The material has not been prepared in accordance with the legal requirements designed to promote the independence of investment research and such should be considered a marketing communication.
All information has been prepared by ActivTrades ("AT"). The information does not contain a record of AT's prices, or an offer of or solicitation for a transaction in any financial instrument. No representation or warranty is given as to the accuracy or completeness of this information.
Any material provided does not have regard to the specific investment objective and financial situation of any person who may receive it. Past performance and forecasting are not a synonym of a reliable indicator of future performance. AT provides an execution-only service. Consequently, any person acting on the information provided does so at their own risk. Political risk is unpredictable. Central bank actions can vary. Platform tools do not guarantee success.
 Long
Long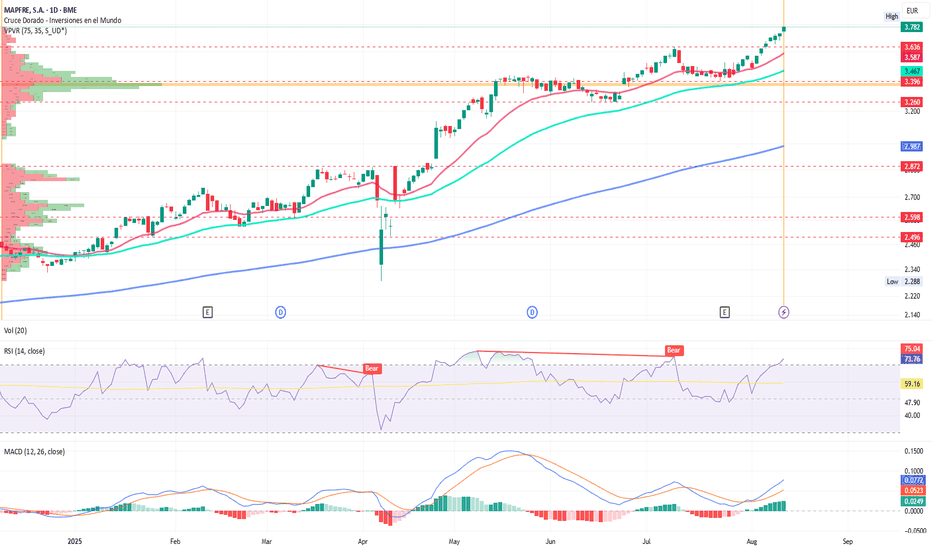
Bank Mergers in CheckBank Mergers in Check: Between Brussels and National Interests
Ion Jauregui – Analyst at ActivTrades
Banking consolidation plans in Europe have gained momentum in 2025, driven by the Draghi and Letta reports, which advocate for the creation of pan-European banks capable of competing globally with U.S. and Chinese giants. However, the recent BBVA-Sabadell and UniCredit-BPM merger cases expose growing tensions between the EU’s ambitions and national protectionist policies. Spain and Italy are placing roadblocks on two key deals, casting doubt on real progress toward an effective banking union, while political intervention in operations with continent-wide implications is raising concern.
State Intervention: Protection or Market Obstacle?
Both the Spanish and Italian governments have imposed strict conditions on the mergers. In BBVA’s case, Spain’s government, led by Pedro Sánchez, demands that Sabadell remain a separate entity for at least three years and prohibits layoffs directly related to the deal. Although BBVA’s chairman Carlos Torres has not backed down, the conditions have triggered legal and institutional tensions.
Italy has taken an even tougher stance. The government under Giorgia Meloni requires UniCredit to fully exit Russia by summer 2026, maintain BPM’s branch network, and preserve loan, deposit, and asset ratios. CEO Andrea Orcel hasn’t ruled out the deal but has clearly cooled expectations.
Brussels Takes Notice
Though these demands are framed as serving the public interest, they may conflict with the EU’s principle of free movement of capital. The European Commission has launched the EU Pilot mechanism, a preliminary step before a possible infringement procedure, to assess the legality of the actions. While no formal case has been opened yet, Brussels has made it clear: political interference threatens the credibility of the single banking market and could deter institutional investors. As ECB Vice President Luis de Guindos bluntly stated: “These interventions limit the narrative of European financial integration.” His words echo the technocratic tone of Draghi’s banking memo for Europe.
BBVA and UniCredit Face the Market
Despite the political noise, both banks remain fundamentally solid. BBVA’s strong presence in Latin America, attractive P/E ratio, and dividend yield stand out. Still, restrictive conditions could slow integration. UniCredit boasts robust capital ratios and a strong ROE, but regulatory uncertainty and geopolitical exposure continue to weigh on its strategic outlook.
Fundamental Analysis
BBVA:
Trades at an attractive P/E ratio around 7x with a dividend yield above 6%.
Strong exposure to emerging markets, especially Mexico, offers growth potential.
Merger restrictions with Sabadell may delay synergies and increase short-term costs.
UniCredit:
Solid capital (CET1 fully loaded above 15%) and ROE near 14%.
BPM acquisition would boost market share in Italy, but political hurdles could limit benefits.
Geopolitical uncertainty (Russia exit) adds execution pressure.
Technical Analysis
BBVA:
Consolidating between €13.90 (highs) and €12.645, with key supports at €11.085 and €9.80.
A breakout above resistance could trigger further upside, though regulatory pressure may limit short-term gains.
Current point of control at €13.035 aligns with the 50-day MA, supporting the latest bullish move. RSI at 54.96% is neutral; MACD shows signs of bullish consolidation.
UniCredit:
Trading at all-time highs of €61.56 after breaking the €58.66–€54.34 consolidation range; point of control at €56.64.
Supports at €50.05 and just below €39; a move beyond €39 would require BPM deal clarity.
A drop below €33 could lead to €30, a psychological support level, though strong earnings make this unlikely in the short term.
RSI at 59.02% is slightly overbought and correcting from the recent rally, which remains supported by the 50-day MA. MACD is trending upward.
Toward a Real Banking Union?
Current tensions raise a pressing question: can the EU advance its banking union if each state sets its own rules? Brussels’ technocratic push for free capital movement is increasingly at odds with a wave of national interventionism. The conditions imposed in these two high-profile mergers have turned them into regulatory battlegrounds, introducing not just regulatory risk, but also financial and geopolitical uncertainty into the equation—affecting both valuation and the strategic path of the banks involved.
*******************************************************************************************
The information provided does not constitute investment research. The material has not been prepared in accordance with the legal requirements designed to promote the independence of investment research and such should be considered a marketing communication.
All information has been prepared by ActivTrades ("AT"). The information does not contain a record of AT's prices, or an offer of or solicitation for a transaction in any financial instrument. No representation or warranty is given as to the accuracy or completeness of this information.
Any material provided does not have regard to the specific investment objective and financial situation of any person who may receive it. Past performance and forecasting are not a synonym of a reliable indicator of future performance. AT provides an execution-only service. Consequently, any person acting on the information provided does so at their own risk. Political risk is unpredictable. Central bank actions can vary. Platform tools do not guarantee success. Regulated status does not guarantee security.
 Long
Long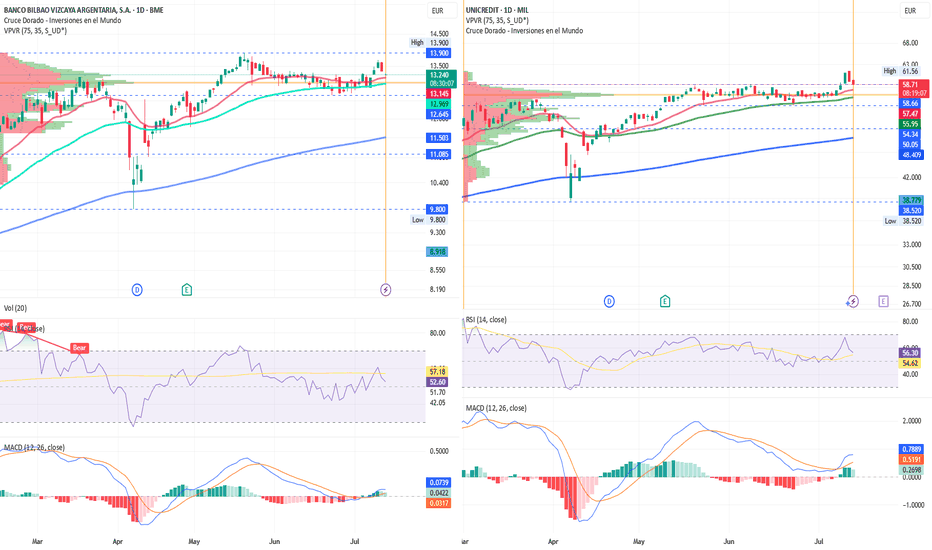
Threat or Catalyst? Impact of MasOrange IPO on TelefonicaThreat or Catalyst? Impact of the Upcoming MasOrange IPO on Telefónica
By Ion Jauregui – Analyst at ActivTrades
The potential IPO of MasOrange, valued between €5.37 and €9.44 billion based on applied EV/EBITDA multiples (ranging from 7x to 8.4x), could significantly reshape the competitive landscape of Spain’s telecommunications sector. The new entity, formed by the merger of MásMóvil and Orange Spain, aims to capitalize on a market that is once again showing appetite for new public listings. But what impact could this operation have on Telefónica?
The Return of a Real Threat in the Domestic Market
MasOrange is not just another telecom operator. With a leading customer share in Spain, an already deployed fiber optic network, and EBITDA margins above the industry average (37.9%), it is emerging as a highly efficient competitor. Although it carries a high net debt (€14.11 billion), it benefits from projected synergies of €500 million by 2027, which could justify a premium valuation versus other operators. Furthermore, the potential entry of a new partner into its shared fiber subsidiary with Vodafone—valued at up to €10 billion—could unlock capital, reduce leverage, and increase the appeal of its upcoming IPO.
For Telefónica, this represents added pressure in its most strategic market: Spain. While the company diversifies across Latin America, Germany, and the UK, its domestic market remains key for cash flow generation. A well-capitalized, listed MasOrange could intensify price competition, compress margins, and pressure Telefónica's local profitability.
Fundamental Analysis of Telefónica: Financial Stabilization Amid Structural Challenges
Telefónica has achieved progressive financial stabilization in recent years after a period marked by high debt and structural revenue pressure in mature markets. As of Q1 2025, the company reported the following key figures:
Revenue: €10.15 billion (+1.1% YoY), driven by growth in Germany and Brazil.
OIBDA: €3.20 billion, with a margin of 31.5%.
Net financial debt: €26.3 billion, improved from €27.48 billion at year-end 2023.
Net profit: €509 million (+9.6% YoY).
Telefónica has strengthened its financial profile through the sale of non-core assets and the rotation of infrastructure, such as towers and data centers. This has helped reduce debt and improve ROCE. It has also maintained an attractive dividend policy, with a €0.30 cash dividend per share for 2025, offering a yield close to 6.5% at current prices.
By region, Brazil and Germany continue to perform well, while Spain remains a mature, low-growth market characterized by high competition and regulatory pressure. In this context, the entry of a more efficient, fiber-leveraged MasOrange could negatively impact margins and market share in Spain.
Telefónica is investing in digital transformation, artificial intelligence, and 5G network deployment, although these efforts have yet to translate into double-digit revenue growth. The company also maintains a strategic alliance with the Spanish government (SEPI), which now holds over 10% of its capital—a potential source of stability amid possible corporate moves in the sector.
Technical Analysis: Bearish Pressure
Telefónica shares are currently trading at €4.56 as of Monday’s open, down -0.13% from Friday’s session. The stock appears to have lost momentum from the recent quarterly earnings release and has entered a sideways phase. Nevertheless, its long-term uptrend remains intact. Since the golden cross on April 14, the 50-day moving average continues to expand above the 100- and 200-day averages. The price is currently supported by the 50-day moving average.
The RSI shows slight overbought conditions at 56.32%, while the MACD suggests a weakening trend accompanied by a bell curve pointing to a control level around €4.08. As long as the current support at €4.43 holds, we may see a push to test the recent high of €4.628. However, if this momentum lacks strength, the price could retest the support zone, and a break below it could lead to a pullback with €4.43 as the first potential stopping point.
Conclusion
MasOrange's return to the stock market reshapes the playing field. For Telefónica, the risk lies not so much in the newcomer’s valuation, but in its operational efficiency, fiber advantage, and renewed investment capacity. While Telefónica remains a global reference in telecom, this move could force the company to accelerate its transformation and defend its share in its most mature and competitive market.
*******************************************************************************************
The information provided does not constitute investment research. The material has not been prepared in accordance with the legal requirements designed to promote the independence of investment research and such should be considered a marketing communication.
All information has been prepared by ActivTrades ("AT"). The information does not contain a record of AT's prices, or an offer of or solicitation for a transaction in any financial instrument. No representation or warranty is given as to the accuracy or completeness of this information.
Any material provided does not have regard to the specific investment objective and financial situation of any person who may receive it. Past performance is not reliable indicator of future performance. AT provides an execution-only service. Consequently, any person acting on the information provided does so at their own risk.
 Long
Long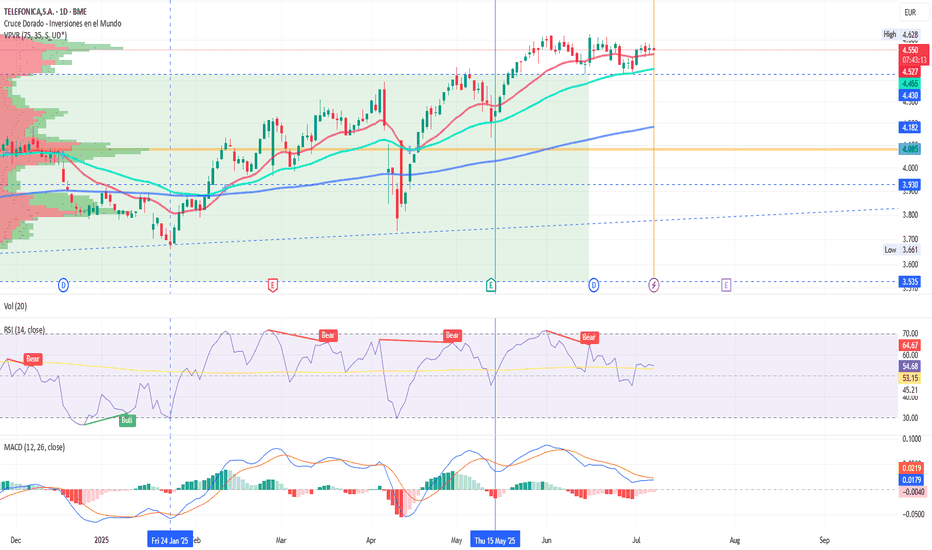
Enagas Joins Forces to Develop the BarMar Hydrogen PipelineNaTran, Enagás and Terega Join Forces to Develop the BarMar Hydrogen Pipeline
Ion Jauregui – ActivTrades Analyst
French company NaTran, a subsidiary of energy giant Engie, has announced the creation of a joint venture with Spanish firm Enagás and gas infrastructure operator Terega to develop the BarMar hydrogen pipeline—a key connection for the transport of green hydrogen between the Iberian Peninsula and France. The announcement follows last week’s approval of European funds that will cover 50% of the project’s development costs, strengthening its economic and strategic viability. BarMar is part of the broader H2Med corridor, which aims to position Spain as a renewable hydrogen export hub to Europe’s industrial heartland.
Fundamental Analysis of Enagás
Enagás (ENG.MC) is a strategic operator within Europe’s gas infrastructure and has, in recent years, taken clear steps toward the transportation of renewable gases such as hydrogen and biomethane. Its involvement in projects like BarMar and H2Med reinforces its role as a key player in the decarbonisation of the European energy sector. Financially, Enagás maintains a stable distribution policy, offering a dividend yield above 8%, one of the highest in the IBEX 35. However, its growth potential is limited by the maturity and regulatory nature of its core business. That said, new investments in energy transition projects could serve as medium- to long-term growth catalysts, diversifying its revenue profile. Moreover, its participation in EU-backed consortia improves financial visibility and provides solid institutional support.
Technical Analysis of Enagás
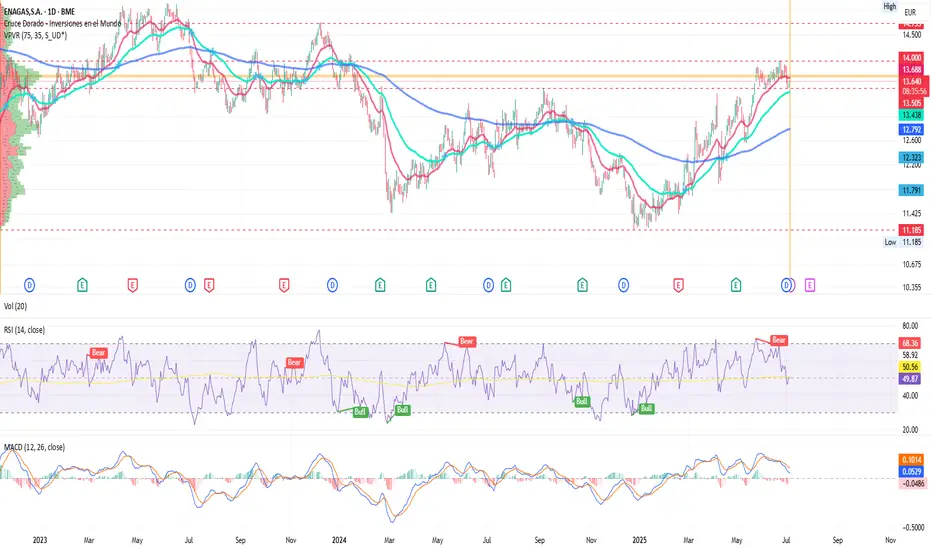
In today’s session, Enagás shares (ENG.MC) opened at €13.65, following a week of corrective moves that concluded last Thursday. Since May, the stock has shown a lateral consolidation pattern between €13.50 and €14.00, the current yearly highs. This range has acted as a technical pause after the declines recorded between April and May. Despite recent pullbacks, the broader structure remains bullish, and the price is currently positioned at a relevant support zone: last year's highs, which now serve as a technical base. If this support holds, a sustained breakout above €14 could pave the way toward €14.75—the highs of 2023. Conversely, a breakdown below €13.50 could send the price toward the current point of control (PoC) around €12.83, where the highest recent trading volume is concentrated. The daily RSI is near the neutral 50 level, indicating a market in consolidation, with no clear signs of overbought or oversold conditions. Meanwhile, a golden cross formed in April remains in place, supporting the idea of accumulation at current levels. However, the MACD shows a downward slope, suggesting that selling pressure has not fully subsided and that further tests of support or even an extended correction may occur if buying volume remains weak.
Conclusion
Enagás is at a technically pivotal stage, with key support at €13.50 and potential upside toward €14.75 if resistance is breached. The company’s involvement in the BarMar project not only highlights its strategic role in Europe’s energy infrastructure but also strengthens its position in the emerging energy model. While the technical outlook suggests short-term equilibrium with potential volatility, the fundamentals point to a stable profile, backed by energy transition investments and institutional support.
*******************************************************************************************
The information provided does not constitute investment research. The material has not been prepared in accordance with the legal requirements designed to promote the independence of investment research and such should be considered a marketing communication.
All information has been prepared by ActivTrades ("AT"). The information does not contain a record of AT's prices, or an offer of or solicitation for a transaction in any financial instrument. No representation or warranty is given as to the accuracy or completeness of this information.
Any material provided does not have regard to the specific investment objective and financial situation of any person who may receive it. Past performance is not reliable indicator of future performance. AT provides an execution-only service. Consequently, any person acting on the information provided does so at their own risk.
 Long
Long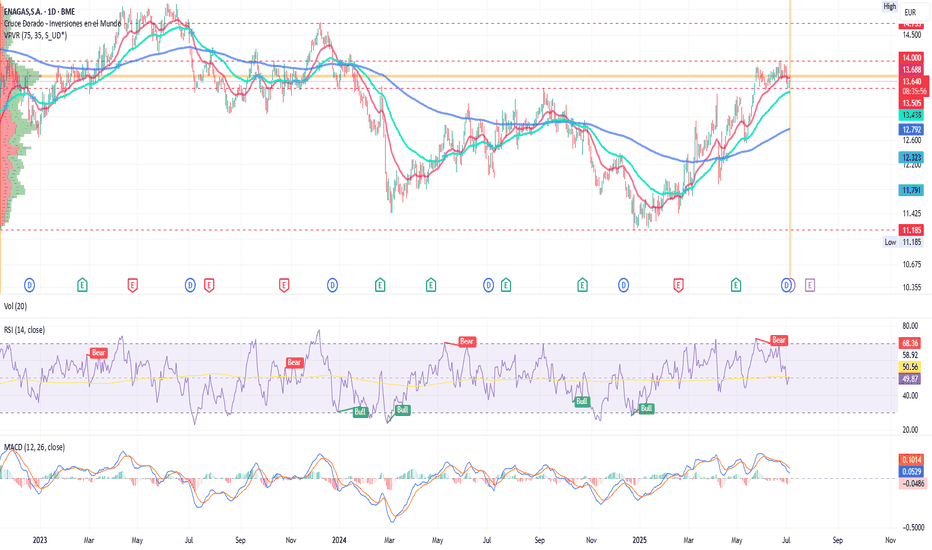
Iberdrola Doubles Down on Power Grids in the U.S. and U.K.Ion Jauregui - ActivTrades Analyst
Iberdrola is accelerating its international expansion with a historic investment of over €33 billion in power grid infrastructure across the United States and the United Kingdom. Through its subsidiaries New York State Electric & Gas (NYSEG) and Rochester Gas and Electric (RG&E), the company has launched the "Power New York" plan, which includes a $20 billion investment to modernize and reinforce the grid in New York State. This move follows the green light granted by the U.K. energy regulator Ofgem for a €12.42 billion investment through 2031 to develop infrastructure in the country, confirming the central role of networks in the group’s upcoming strategic plan.
The U.S. plan includes improvements in reliability, technology integration, customer service, and the hiring of over 1,100 employees. Around 40% of costs relate to legacy burdens such as delinquent payments, storm recovery, and new regulatory requirements. The modernization strategy also includes social investments, such as support for vulnerable households and the reinforcement of electric corridors to prevent outages.
Fundamental Analysis
The utility, chaired by Ignacio Galán, maintains a solid and diversified profile, supported by regulated revenues and a presence in key strategic markets. The newly announced plan aims to strengthen operational and financial stability in line with the group's energy transition goals.
Key strengths include:
A diversified and regulated business model, helping to reduce income volatility.
A strong focus on clean energy and smart grids, aligned with climate policy in both the U.S. and EU.
Positive regulatory backing, with Ofgem’s approval and the beginning of a rate case process in New York enhancing visibility on future revenues.
From a financial standpoint:
In 2024, Iberdrola posted a net profit above €5 billion, with solid EBITDA growth driven by grids and renewable generation.
The net debt/EBITDA ratio remains under control, supported by prudent financial management.
The dividend yield stood above 4%, indicating stable returns for shareholders.
Potential risks in the new investment cycle include:
Regulatory delays in the U.S. that could affect implementation timelines.
Prolonged high interest rates that may increase financing costs.
Legacy infrastructure issues in the U.S. subsidiaries requiring significant capital outlay.
Technical Analysis
As of July 2, Iberdrola shares closed at €16.29, down 0.58%. Early trading on the following day showed a slightly bearish tone. From a technical perspective, the stock maintains a sideways-upward trend, supported around €15.90. A breakout above €16.60 could pave the way toward €17.20, while a drop below the support level could lead to €15.30.
Overall trend: Sideways-upward since early May, with strong support at €15.90 and €15.065, and resistance around €16.80.
Moving averages: The 50-day MA sits just below the current price, offering short-term support. Longer-term moving averages are expanding, consistent with a consolidating upward structure.
Technical indicators:
RSI at 53.64%: Room for further upward movement before overbought conditions. The RSI reached 70% during the all-time highs on June 24.
MACD: Weakness appeared after recent highs. The Signal line is currently above the MACD, suggesting weakened momentum. A bullish crossover of the MACD over the Signal line in the coming sessions would be a key confirmation of potential upside.
Conclusion
With over €33 billion earmarked for power grids in its most strategic markets, Iberdrola strengthens its position as a key player in the global energy transition. Regulatory support on both sides of the Atlantic and the scale of investment enhance its role in modernizing critical infrastructure. Technically, the stock maintains a solid structure as the market digests the long-term implications of these plans.
*******************************************************************************************
The information provided does not constitute investment research. The material has not been prepared in accordance with the legal requirements designed to promote the independence of investment research and such should be considered a marketing communication.
All information has been prepared by ActivTrades ("AT"). The information does not contain a record of AT's prices, or an offer of or solicitation for a transaction in any financial instrument. No representation or warranty is given as to the accuracy or completeness of this information.
Any material provided does not have regard to the specific investment objective and financial situation of any person who may receive it. Past performance is not reliable indicator of future performance. AT provides an execution-only service. Consequently, any person acting on the information provided does so at their own risk.
Telefónica: Consolidation or the Start of a New Bullish Phase?Ion Jauregui –ActivTrades Analyst
Telefónica is experiencing one of its strongest market moments in recent years, with a nearly 20% appreciation so far in 2025 and a share price that has reached €4.73. These are levels not seen since July 2022, sparking renewed investor interest, although questions remain regarding its ability to sustain this momentum.
Fundamental Analysis
The company is undergoing a structural transformation aimed at improving profitability and reducing operational risk. In this regard, it has accelerated the divestment of assets in less strategic Latin American markets such as Ecuador, Peru, Argentina, Uruguay, and Colombia, focusing instead on its core operations in Europe and Brazil. This strategy has allowed Telefónica to reduce its exposure to currency volatility and improve capital allocation efficiency.
Despite reporting a net loss of €1.304 billion for the fiscal year, this figure is primarily attributable to accounting write-downs related to asset disposals and does not undermine its cash flow generation capacity or its commitment to maintain the annual dividend of €0.30. With a customer base exceeding 390 million and a solid infrastructure network, the operator remains a key player in the markets where it operates. Its current focus on financial discipline and risk profile improvement aligns with an environment in which operational stability and efficiency outweigh aggressive growth strategies.
Technical Analysis
From a technical perspective, Telefónica broke through a significant resistance level at €4.430 at the end of May — a ceiling in place since its sharp price drop in 2020. This breakout was accompanied by a notable increase in volume, adding validity to the move.
The current price of €4.610 aligns with a medium-term high. If the stock manages to consolidate above the €4.628 high in the coming weeks, it could pave the way toward €5.00, where the next relevant resistance level lies, coinciding with the current point of control at €5.064. Conversely, a failure to hold above current levels could lead to a retracement toward the current moving average around €3.930 or slightly above, where previous highs now act as support. The RSI currently stands in overbought territory at 64.67%, suggesting there may still be room for an upward move toward the €5.00 point of control zone if bullish momentum persists.
Conclusion
Telefónica is at a pivotal stage in its strategic redefinition, a process that has begun to reflect positively in its share price. This shift is driven by a more rational approach to risk management, a clear focus on priority markets, and a sustained commitment to financial discipline. The technical breakout from historic resistance levels strengthens the case for a continued bullish trend, although caution remains warranted: further upside will depend on sustained consolidation above current levels and the emergence of solid catalysts to support the company’s narrative. After years of sideways movement, the stock has finally broken out — now comes the true test: turning this rally into a lasting trend.
*******************************************************************************************
The information provided does not constitute investment research. The material has not been prepared in accordance with the legal requirements designed to promote the independence of investment research and such should be considered a marketing communication.
All information has been prepared by ActivTrades ("AT"). The information does not contain a record of AT's prices, or an offer of or solicitation for a transaction in any financial instrument. No representation or warranty is given as to the accuracy or completeness of this information.
Any material provided does not have regard to the specific investment objective and financial situation of any person who may receive it. Past performance is not reliable indicator of future performance. AT provides an execution-only service. Consequently, any person acting on the information provided does so at their own risk.
Long