• Products
  • Community
  • Markets
  • Brokers
  • More
Get started
  • Markets
  • /Spain
  • /Stocks
  • /Ideas
Santander 1° Elliot wave Hi everyone, As we can see this first impulse could be the first wave of a huge movement so we have to be analyzing the price to take a long position before the next movement has gone. Stop Loss: 1°: 2.74 more or less 2°: 2.90 more or less Follow me for more content !!!
BME:SANLong
by Ignacio-TradingFx
Naturgy: Megabullish trendIt's not very common to see a Spanish dividend stock performing like this these days but the Australian fund IFM is trying to increase its stake in Naturgy and nobody is willing to sell the stock cheap. From the technical analysis perspective, there are no resistance level until last highs of 2007 (38.83). Although we are in overbought territory, we don't recommend to sell a winner like this one, especially if you bought it when it had a better dividend yield than it has today. As long as there
BME:NTGYLong
by alvaromroo
2
Predicción GRF 28-12-2021Predicción para GRF en Corto. Recomendada por nuestro algoritmo de IA. El horizonte temporal de la recomendación es 5 días.
BME:GRFShort
by stockfinkES
Telefonica: The perfect choice for a DIVIDEND strategyHere at Human Traders, we've been following Telefonica closely. Its fundamentals look better than ever. They reduced its debt from €56Bn in 2011 to €25bn in 2021. Alvaro Pallete, CEO of Telefonica has done an incredible job in term of debt reduction and company management. The dividend is also very interesting. We bought Telefonica when the dividend yield was more than 12%. Still the dividend yield now is more than 6%, one of the bests in Spain, a country where almost every company offers attrac
BME:TEFLong
by alvaromroo
1
Bought Banco Santander (Long-term)After a big correction and a dividend payment, we bought Banco Santander, it will have a huge dividend yield in the coming years and we are too low from last highs seen years ago. It is part of our Human Dividend 40 Index and the performance for an inflationary period like this with upcoming interest rate hikes, banks will benefit from it. So we have performance + dividends.
BME:SANLong
by alvaromroo
1
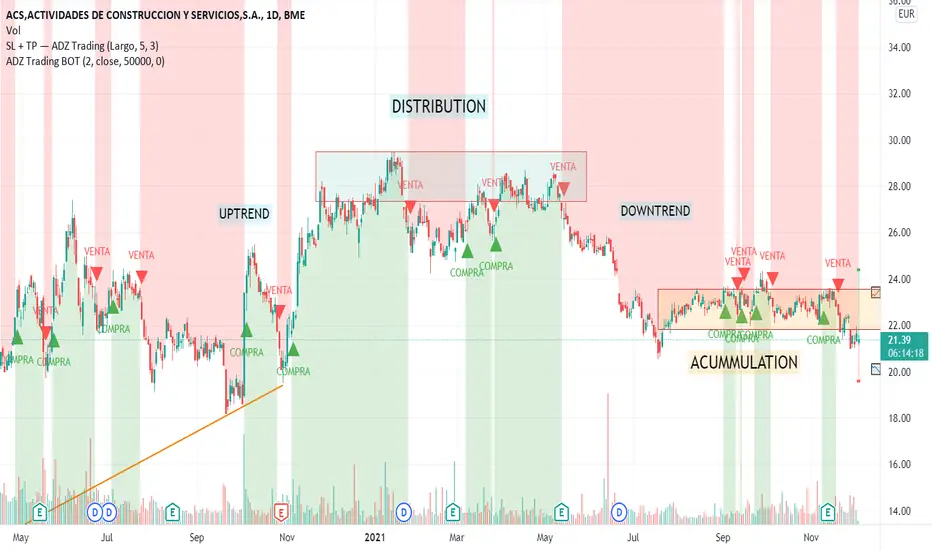
Market phases explained through ACS' graphA few days ago, I identified the different market phases through this company's graph: uptrend, distribution and downtrend, which could imply that the market is right now within the accumulation phase. This phase is characterized by the price of these shares being lateral and, when this phase ends, a new trend will begin. Therefore, I consider that keeping an eye on this company can be interesting in order to identify the brand new trend as it starts, so that we can open positions in favour of
BME:ACS
by mar_lpz
Almirall analysis fibonacci supports and main rise guideline Two solid supports on the point 10.25, we can view rebounds on the 10.25 point. The fibonacci supports and the main rain rise guidilne were created in the last uptrend one year ago.
BME:ALM
by gucastro84
REPSOL, S.A. REBOUND FROM DAILY SUPPORT LINELooking at the technical picture of the Repsol SA stock on our daily chart, we can see that from the end of October, the share price has been drifting lower while trading below a short-term tentative downside resistance line. The experts said that overall, the stock continues to trade above a medium-term tentative upside support line, which may lead to some higher areas again if it stays intact, however, given that the share price is stuck between the two lines. Repsol S.A. operates as an integr
BME:REP
by legacyFXofficial
1
Almirall analysis fibonacci supportsKey support in 10.25 fibonnaci 38 level: key support in this level
BME:ALM
by gucastro84
IAG Looking for momentum play on this one. There are some great TA points made by another trader (@j5150) regarding harmonics. chart art
BME:IAG
by TheOne99
ITX Ascending Triangle PatternIn this update we review the developing ascending triangle pattern, identifying a high probability trading opportunity
BME:ITXLong
0
by Tickmill
2
Are we at the bottom yet?Grifols stock has been heavely punished during 2021. First the pandemic difficulted the plasma collection. We must take into account the stimulus checks and the unemployment benefits from the US goverment wich might have disuaded people from going to the plasma collection centers to get some extra income. I'll be looking forward for the data on the plasma operations in the next earnings release. We also have to consider the high net gearing of the company after issuing a ton of debt to purchas
BME:GRFLong
by CaptnBNZ
nice buy here good buy stocks here, positive ratio for lang trade
BME:ANALong
by luloutees
IBE // Super ShortAcciones Iberdrola (IBE) might give you the short of your life . As stated in the video, I got no clue what this company about except for the intro on TV - of it being a holding company that deals w electricity. However, the chart shows me all I need to see to make a decision. As stated in the video, after a few years of strong upward trending structure, price finally fell below the monthly 21EMA for the first time since 2013 . The weekly timeframe also shows bearish reversal patterns. A
BME:IBEShort
06:28
by N0ST0PL0SS
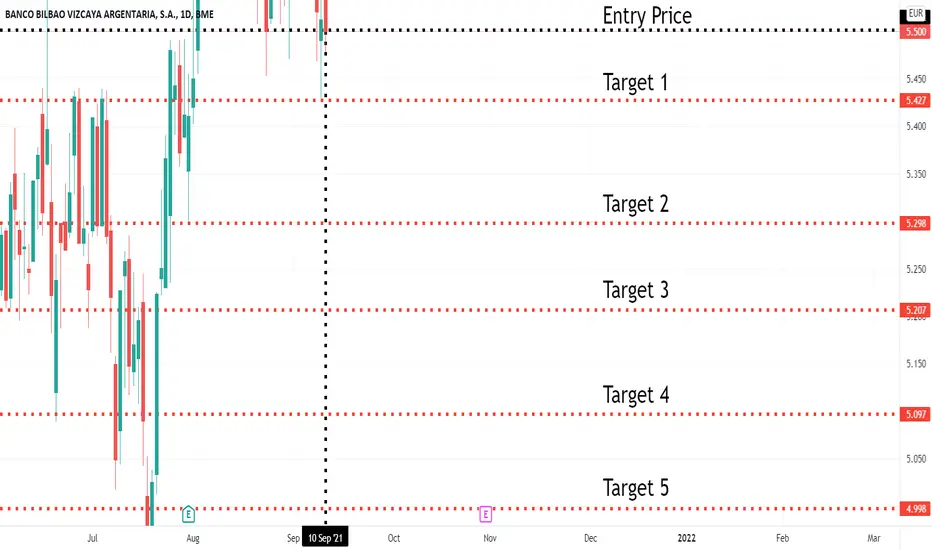
BBVA bearish scenario:The technical figure Triangle can be found in Spanish company Banco Bilbao Vizcaya Argentaria, S.A. (BBVA.mc) at daily chart. Banco Bilbao Vizcaya Argentaria, S.A., better known by its initialism BBVA, is a Spanish multinational financial services company based in Madrid and Bilbao, Spain. It is one of the largest financial institutions in the world, and is present mainly in Spain, South America, North America, Turkey, and Romania. The Triangle has broken through the support line on 22/10/2021,
BME:BBVAShort
by legacyFXofficial
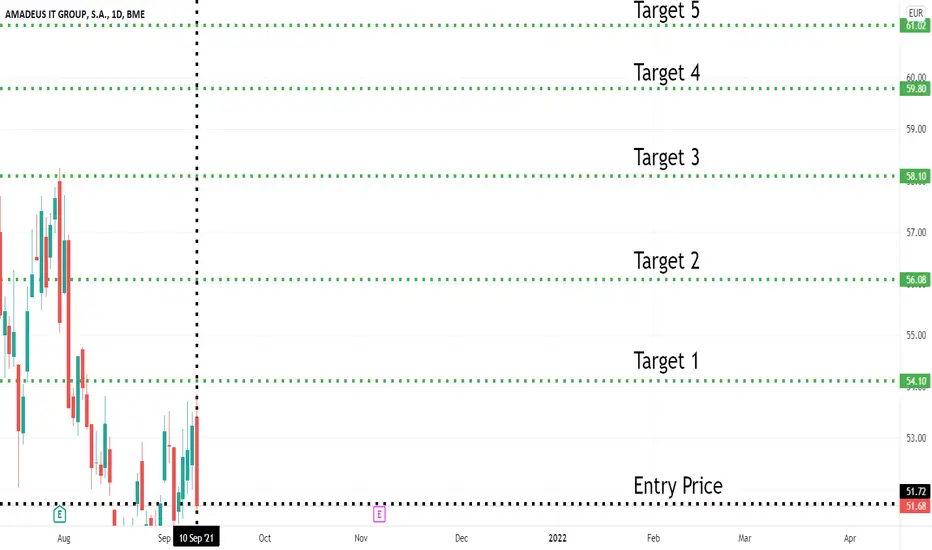
Amadeus IT Group S.A.(AMS.mc) bearish:The technical figure Pennant can be found in Spanish company Amadeus IT Group S.A. (AMS.mc) at daily chart. Amadeus IT Group, S.A. is a major Spanish IT provider for the global travel and tourism industry. The company is structured around two areas: its global distribution system and its Information Technology business. Amadeus provides search, pricing, booking, ticketing and other processing services in real-time to travel providers and travel agencies through its Amadeus CRS distribution busin
BME:AMSShort
by legacyFXofficial
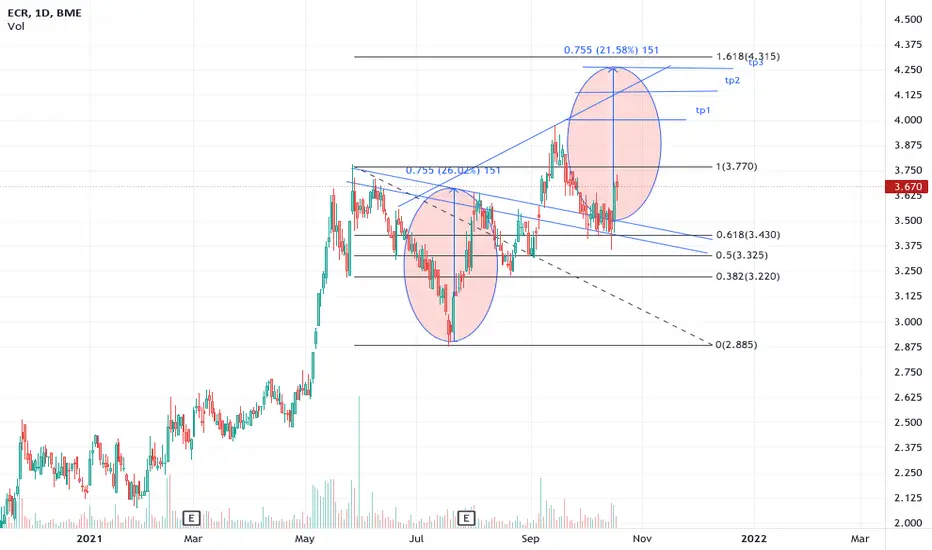
ercros solid chemicals company, on a weekly tf is forming a cup and handle, but for now better look at lower tf. ibex35 looks fighting with the 9000pts resistance zone, but i have no doubt it will surpass it due to EU not easing QE, this might drag up with it this shit. technicaly formed a reverse H&S, had a false break thru, quite big one, but spanish stocks are quite a mess by this point of view. the final pattern's target is very close to the 1.6 fib extention.
ELong
by warrenbuffettdemicasa
first try to analize the marketim a rookie on traiding, and in this occasion im trying to found on the chart high and lows tendencies and the accumulations time
BME:SAN
by JatnielFAA
IAG activated divergence target price 2.7€ +24%IAG has activated a divergence between price and MACD with target price at 2.70€ that is +24% from current price. Once reached this price a second impulse will be activated with a higher target at 3.12€.
BME:IAGLong
by compoundinterest7
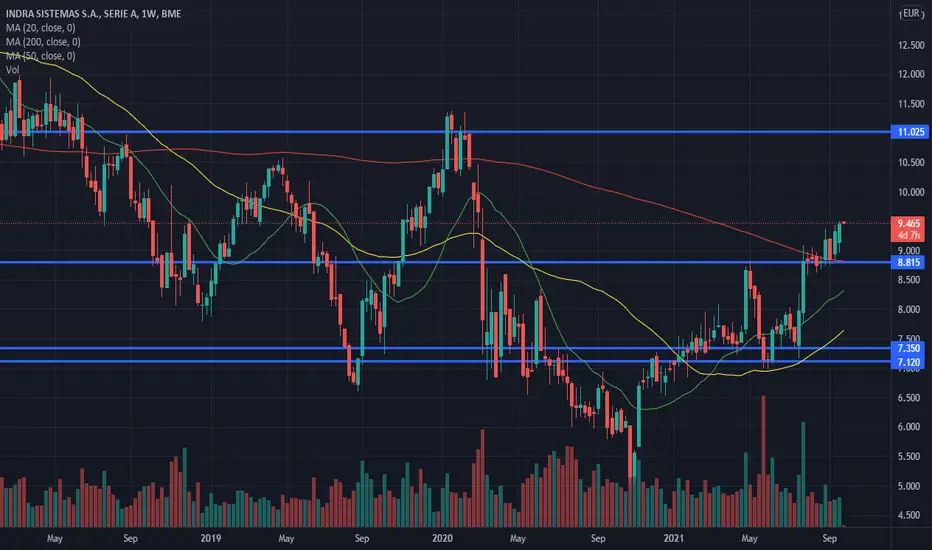
Indra future predictionOn this chart, we can see a stock with bull trading behavior. The next resistance appears to be at 11,025, so we can gain up to 15%. We crossed the MMA200 positively, and the MM20 and MM50 are moving up, significantly apart keeping their distance. However we are far away from the MM20 moving average, the last time we were this far we had a retraction to the MM20. After the retraction, the stock should start to have another bullish movement. So I think the stock will retract in the short term
BME:IDRLong
by Recub20
AMS Daily TimeframeSNIPER STRATEGY This magical strategy works like a clock on almost any charts Although I have to say it can’t predict pullbacks, so I do not suggest this strategy for leverage trading. It will not give you the whole wave like any other strategy out there but it will give you huge part of the wave. The best timeframe for this strategy is Daily, Weekly and Monthly however it can work any timeframe above three minutes. Start believing in this strategy because it will reward believers with huge prof
BME:AMSLong
by hadimozayan
Updated
BBVA Daily TimeframeSNIPER STRATEGY This magical strategy works like a clock on almost any charts Although I have to say it can’t predict pullbacks, so I do not suggest this strategy for leverage trading. It will not give you the whole wave like any other strategy out there but it will give you huge part of the wave. The best timeframe for this strategy is Daily, Weekly and Monthly however it can work any timeframe above three minutes. Start believing in this strategy because it will reward believers with huge prof
BME:BBVAShort
by hadimozayan
Updated
Repsol S.A. (REP.mc) bearish scenario: We can found a technical figure Rising Wedge in Spanish company Repsol S.A. (REP.mc) on a daily chart. Repsol S.A.s a Spanish energy and petrochemical company based in Madrid. It is engaged in worldwide upstream and downstream activities. In the 2020 Forbes Global 2000, Repsol was ranked as the 645th-largest public company in the world. It has more than 24,000 employees worldwide. It is vertically integrated and operates in all areas of the oil and gas industry, including exploration and product
BME:REPShort
by legacyFXofficial
Aena S.M.E., S.A. (AENA.mc):We can found a technical figure Triangle in Spanish company Aena, SME S. A. (AENA.mc) on a daily chart. Aena, SME S. A.is a Spanish public company incorporated as a public limited company that manages general interest airports in Spain. The company, which is 51% owned by the public business entity ENAIRE, operates 45 airports and two heliports in Spain and participates through its subsidiary "Aena Internacional," in the management of 15 airports in Europe and America, which makes the company in
BME:AENAShort
by legacyFXofficial
12345678910111213141516171819202122232425
…999

Made by humans

Select market data provided by ICE Data Services. Select reference data provided by FactSet. Copyright © 2026 FactSet Research Systems Inc.Copyright © 2026, American Bankers Association. CUSIP Database provided by FactSet Research Systems Inc. All rights reserved. SEC filings and other documents provided by Quartr.© 2026 TradingView, Inc.

SOC 2 CompliantGDPR Compliant
More than a product
  • Supercharts
Screeners
  • Stocks
  • ETFs
  • Bonds
  • Crypto coins
  • CEX pairs
  • DEX pairs
  • Pine
Heatmaps
  • Stocks
  • ETFs
  • Crypto coins
Calendars
  • Economic
  • Earnings
  • Dividends
  • IPOs
More products
  • News Flow
  • Portfolios
  • Fundamental Graphs
  • Yield Curves
  • Options
  • Macro Maps
  • Pine Script®
  • MCP Server
Apps
  • Mobile
  • Desktop
Community
  • Social network
  • Wall of Love
  • Refer a friend
  • Creator program
  • House Rules
  • Moderators
Ideas
  • Trading
  • Education
  • Editors' picks
Pine Script
  • Indicators & strategies
  • Wizards
  • Freelancers
  • Marketplace
Tools & subscriptions
  • Features
  • Pricing
  • Market data
  • Gift plans
Trading
  • Overview
  • Brokers
  • Brokers comparison
  • The Leap
Special offers
  • CME Group futures
  • Eurex futures
  • US stocks bundle
About company
  • Who we are
  • Space mission
  • Blog
  • Help Center
  • Careers
  • Media kit
Merch
  • Tarot cards for traders
  • The C63 TradeTime
Policies & security
  • Terms of Use
  • Disclaimer
  • Privacy Policy
  • Cookies Policy
  • Accessibility Statement
  • Trust Center
  • Security tips
  • Bug Bounty program
  • Status page
Business solutions
  • Widgets
  • Charting libraries
  • Lightweight Charts™
  • Advanced Charts
  • Trading Platform
Growth opportunities
  • Advertising
  • Brokerage integration
  • Partner program
  • Education program
Community
  • Social network
  • Wall of Love
  • Refer a friend
  • Creator program
  • House Rules
  • Moderators
Ideas
  • Trading
  • Education
  • Editors' picks
Pine Script
  • Indicators & strategies
  • Wizards
  • Freelancers
  • Marketplace
Business solutions
  • Widgets
  • Charting libraries
  • Lightweight Charts™
  • Advanced Charts
  • Trading Platform
Growth opportunities
  • Advertising
  • Brokerage integration
  • Partner program
  • Education program
Look FirstLook First