Sampath Bank PLC – Technical OverviewSAMP is currently showing signs of weakening bullish momentum after failing to sustain above the key resistance region around 155–156. Price action has broken below the rising trendline support that previously guided the broader uptrend, indicating a potential short-term bearish shift in structure.
The market is now consolidating near the 149 level while facing continued selling pressure beneath the highlighted resistance zone. If the weakness continues, the next major demand area around 136–138 could act as a key support for a possible reaction. Overall, the chart reflects a cautious outlook with downside risk increasing unless buyers reclaim the broken structure.
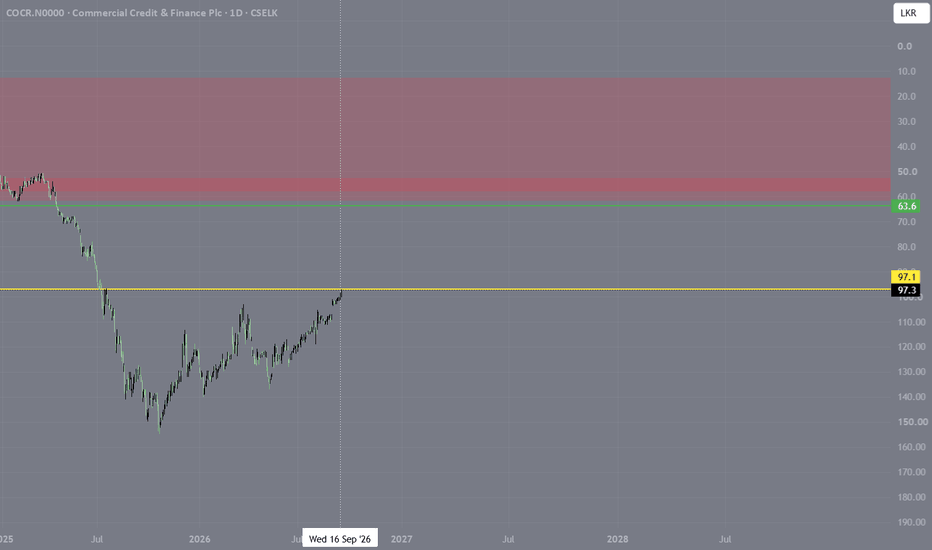
Commercial Credit & Finance Plc – Technical OverviewCOCR is showing signs of a potential bullish recovery after respecting the lower boundary of the broader descending structure and rebounding strongly from the major support zone around 112–115. Price action is now attempting to break above the descending trendline resistance while maintaining higher lows, indicating improving buying momentum. The highlighted 140 area remains the key resistance level to monitor, as a successful breakout above this zone could open room for further upside continuation toward previous liquidity levels. Overall, the current structure reflects strengthening bullish sentiment while holding above critical support.
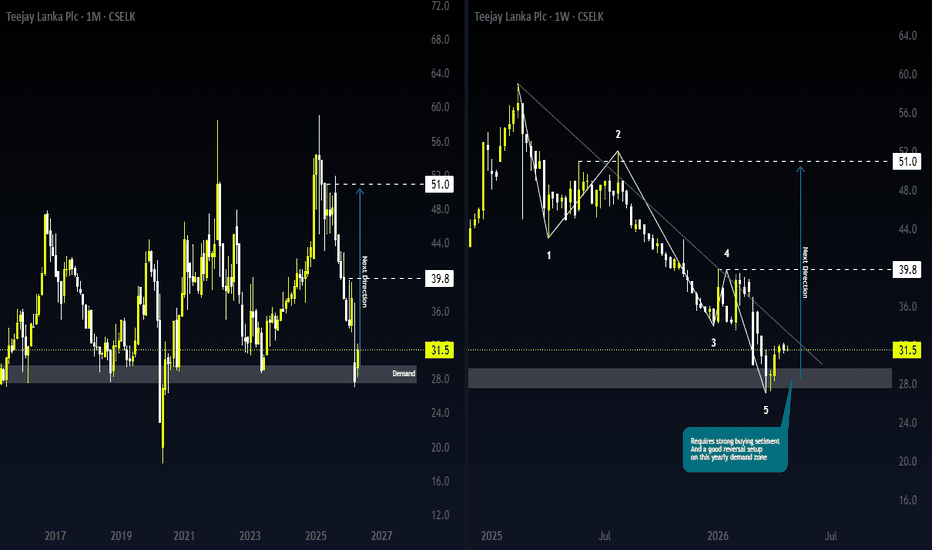
Teejay Lanka PLC (TJL) - Bullish Reversal from Yearly DemandThe dual-timeframe analysis of Teejay Lanka PLC highlights a high-probability reversal setup. On the monthly chart (left), the price has entered a long-term Demand Zone between 28.0 and 30.0, a level that has historically triggered significant rallies. This zone acted as the springboard for the current monthly candle, which is showing strong bullish momentum with a price of 31.5 (+13.72%).
On the weekly chart (right), a clear five-wave corrective sequence (0-5) appears to have completed within this yearly demand area. The price is currently challenging a descending trendline that has suppressed action since mid-2025. A breakout above this trendline would confirm a structural shift. As noted, the setup "Requires strong buying sentiment and a good reversal setup" to validate the move. If the reversal holds, the "Next Direction" targets are set at 39.8 and eventually the major psychological resistance at 51.0.
Summary:
Teejay Lanka PLC is at a critical turning point, having touched a major yearly demand zone. The completion of a corrective wave structure combined with a strong monthly bounce suggests a shift in trend. A confirmed breakout above the weekly trendline could propel the stock toward the primary target of 39.8 and secondary target of 51.0.
Kotagala Plantations Plc (KOTA) Testing Major SupplyThe weekly chart for Kotagala Plantations Plc shows the price currently trading at 9.9, rallying sharply from a established Demand Zone located between 7.8 and 8.3. This recent bullish momentum has brought the stock directly into a significant Supply Zone spanning the 10.3 to 10.8 range.
Historically, this upper zone has acted as a formidable ceiling, causing multiple rejections over the past year. The highlighted note warns: "If the price continues to respect the supply we will see a rejection." This suggests that unless there is a substantial increase in buying volume to facilitate a breakout, the stock may face a short-term pullback or consolidation. A successful daily close above 10.8 would invalidate the bearish thesis, potentially opening the door for a retest of the 12.0 psychological peak seen in late 2025.
Summary:
Kotagala Plantations is encountering heavy resistance within the 10.3-10.8 supply zone. While the recovery from the 8.0 demand level is strong, traders should monitor for signs of exhaustion or rejection at this current juncture before committing to new long positions.
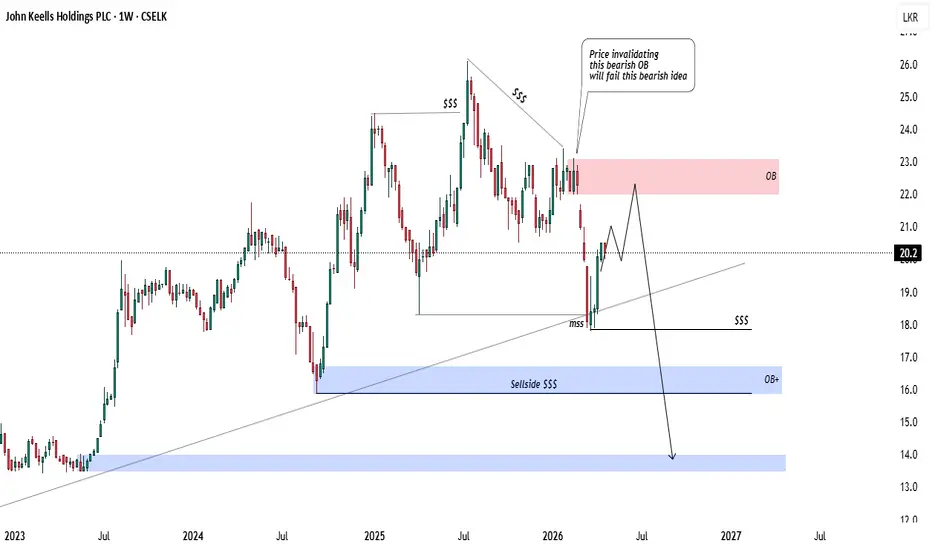
John Keells Holdings PLC (JKH) – Market Structure ShiftThe weekly chart for John Keells Holdings PLC (JKH) reveals a bearish structural shift after the price failed to maintain its long-term bullish momentum, signaling a deeper correction toward historical liquidity zones.
Key Observations
Bearish Order Block (OB): The price faced significant resistance within the red shaded zone (22.0–23.0). This area acts as a bearish supply zone; as noted, price invalidating this OB would fail the bearish thesis, but the recent rejection confirms seller dominance.
Market Structure Shift (MSS): A critical MSS occurred near the 18.5 level, where the price broke below previous swing lows. This break of structure suggests that the long-term trend has shifted from "buy the dips" to "sell the rallies."
Liquidity Gaps & Targets: The chart identifies Sellside Liquidity ($$$) sitting around the 16.0 level. Below that, a significant OB+ zone (blue shaded area) near 14.0 remains the primary magnet for price action if the current bearish trajectory continues.
Projected Path: The expected movement involves a corrective bounce (retest of the breakdown level) before a sustained decline toward the lower liquidity pools.
Summary
The outlook for JKH is decidedly bearish following the confirmation of the bearish Order Block and the subsequent Market Structure Shift. The trendline that supported the 2023–2025 rally has been breached, and the price is now navigating a "retest and drop" sequence. While short-term volatility might see a minor move toward 21.0, the technical weight points toward a liquidation event targeting the 16.0 and 14.0 support zones. Traders should monitor the 23.0 level for invalidation of this bearish outlook.
Sampath Bank PLC (SAMP) – Bearish ShiftThis weekly chart for Sampath Bank PLC (SAMP) indicates a transition from a strong bullish trend to a potential bearish reversal, following a sweep of liquidity and a breakdown of structural support.
Key Observations
Liquidity Sweep & Rejection: The price surged to identify Buy-Side Liquidity (BSL) near the 164.00–168.00 range. The "strong rejection" noted by the long upper wicks suggests that buyers were exhausted, and heavy selling pressure entered at these highs.
Trendline Breakdown: The primary ascending trendline (labeled as the "Floor") has been decisively broken. In technical analysis, when a trendline that previously acted as support is breached, it often flips into a resistance zone.
IFVG & Retest: Price has returned to an Inversion Fair Value Gap (IFVG). The current price action shows a "retest and continuation" pattern, where the asset struggles to move back above the 152.00 level, confirming the bearish sentiment.
Targeting Downside: With the break of structure, the logical objective is the Sell-Side Liquidity (SSL) located near the 136.00 mark.
Summary
The outlook for SAMP is currently bearish. After failing to sustain gains above the BSL, the stock broke its diagonal support floor. The successful retest of the IFVG as resistance suggests that the "Possible Direction" is downward. Investors should watch the 148.00 level closely; failure to reclaim this could lead to a swift move toward the 136.00 SSL target as the market seeks new buy-side interest.
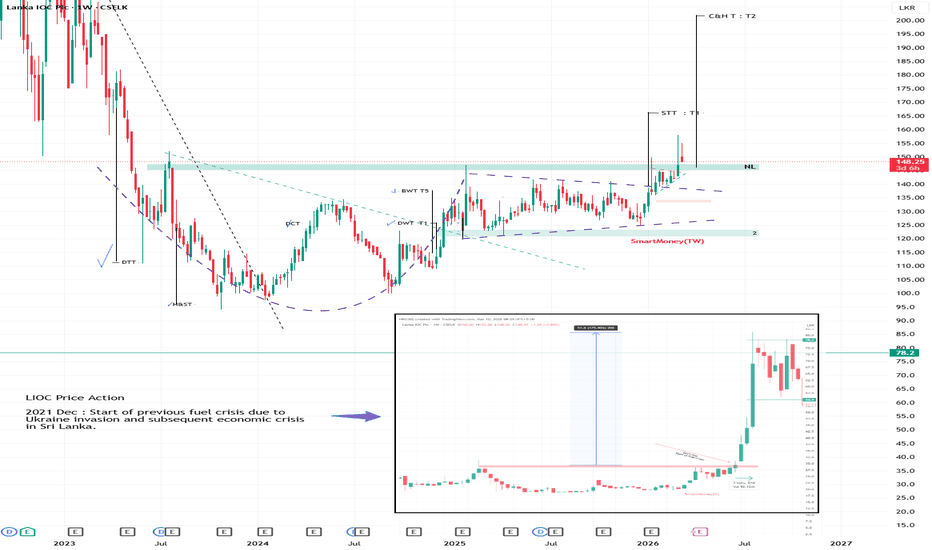
LIOC : The crisis hedge?Overview
LIOC has historically acted as an effective hedge during energy‑crisis–driven market downturns. During the 2022 crisis, the stock rallied sharply even as the broader market experienced a significant decline.
Fundamentals
A detailed discussion will follow.
Macro & Technical Outlook
LIOC’s current price structure closely resembles its positioning ahead of the previous energy crisis.
A 2½‑year Cup & Handle formation has developed, indicating a strong long‑term accumulation pattern.
Last week’s breakout attempt initially failed, with the weekly close slipping back below the neckline. However, LIOC reclaimed the neckline yesterday. With the government’s substantial fuel price increase, the probability of an upward continuation has strengthened, as higher pump prices typically support LIOC’s net profit margins.
Pattern Targets
1. Symmetrical Triangle Consolidation (Handle of the Cup)
STT Target: LKR 166–167
2. Macro Cup & Handle Breakout
C&H Target: LKR 202
Invalidation Levels
- Tight stop‑loss: Weekly close below the neckline
- Logical stop‑loss: Weekly close below the LKR 120 support zone
HHL.NDisclaimer;
The information provided on this website does not constitute investment advice, financial advice, trading advice, or any other advice, and you should not treat any of the website’s content as such. We do not recommend buying, selling, or holding any stock. Nothing on this website should be taken as an offer to buy, sell or hold a stock. Conduct your due diligence and consult your financial advisor before making investment decisions.
I do not accept any responsibility and will not be liable for the investment decisions you make based on the information provided on the website.
Anuradha Godellawatte
PABC.NDisclaimer;
The information provided on this website does not constitute investment advice, financial advice, trading advice, or any other advice, and you should not treat any of the website’s content as such. We do not recommend buying, selling, or holding any stock. Nothing on this website should be taken as an offer to buy, sell or hold a stock. Conduct your due diligence and consult your financial advisor before making investment decisions.
I do not accept any responsibility and will not be liable for the investment decisions you make based on the information provided on the website.
Anuradha Godellawatte
TPL.NDisclaimer;
The information provided on this website does not constitute investment advice, financial advice, trading advice, or any other advice, and you should not treat any of the website’s content as such. We do not recommend buying, selling, or holding any stock. Nothing on this website should be taken as an offer to buy, sell or hold a stock. Conduct your due diligence and consult your financial advisor before making investment decisions.
I do not accept any responsibility and will not be liable for the investment decisions you make based on the information provided on the website.
Anuradha Godellawatte
Technical Analysis: Watawala Plantations PLCThe weekly chart for Watawala Plantations PLC shows a strong long-term uptrend characterized by a series of higher highs and higher lows. However, the price is currently entering a cooling-off phase.
Key Technical Observations
Trendline Support: The stock is respecting a steady ascending trendline that has been in place since late 2024. This line serves as the primary "backbone" of the current bullish structure.
Support Zones: The blue shaded boxes indicate "Support-Turned-Resistance" zones. The most immediate support sits around the 44.0 LKR mark, where previous price peaks have now become a floor for buyers.
Fibonacci Retracement: The chart displays Fibonacci levels on the right. If the price breaks below 44.0 LKR, the next major structural levels to watch are the 0.382 (40.0 LKR) and 0.5 (36.0 LKR) retracements.
Current Momentum: The blue arrow suggests a short-term bearish "arc" or rejection from recent highs near 50.0 LKR. The price is currently retreating toward the nearest support zone.
Summary
The outlook remains bullish long-term as long as the price stays above the diagonal trendline. In the short term, expect a consolidation or minor pullback toward the 43.0 - 44.0 LKR range. Investors should watch for a bounce at this level to confirm the continuation of the uptrend.
Technical Analysis: Access Engineering PLCAs of February 2026, the technical outlook for Access Engineering (AEL) shows a stock that has demonstrated significant long-term growth, with a 1-year return of approximately 86% and a 5-year return of 185%.
Key Technical Indicators
Price Momentum: The stock exhibits strong price momentum with a market capitalization of roughly LKR 71 billion.
Trend Analysis: Historically, the stock has followed a clear uptrend. In late 2024, technical patterns showed the formation of a "Higher High" at 31.80 followed by a retracement, suggesting typical consolidation within a bullish cycle.
Support & Reversals: Analysts previously identified possible reversal zones around 29.80, utilizing Fibonacci levels to confirm support during pullbacks.
Volatility: Weekly volatility has remained relatively stable at approximately 3% over the past year, indicating consistent price action compared to the broader market.
Market Position & Outlook
Valuation: The current Price-to-Earnings (P/E) ratio is approximately 11.29x, which is lower than the broader LK market average of 13.3x, potentially suggesting a more attractive entry point relative to earnings.
Supply & Demand: The stock has benefited from an improving investor sentiment as the construction sector rebounded in 2024, though it faces occasional overvaluation alerts when price exceeds intrinsic value significantly.
Dividends: AEL maintains a dividend yield of approximately 2.8% to 2.9%, providing a steady return component for long-term holders.
Technical Analysis: John Keells Holdings PLCThis monthly chart for John Keells Holdings reveals a stock in a long-term recovery phase, characterized by a steady ascending channel that began after the 2020 lows. Here is a breakdown of the key technical elements:
Key Observations
Ascending Channel: Since 2020, the stock has been respecting a rising price channel. It is currently trading near the median line (dotted), suggesting a balanced momentum between buyers and sellers.
Major Supply Zone: There is a significant overhead resistance (Supply) zone between 25.0 and 26.0. This area has historically capped price increases (notably in 2015 and recently in 2025), leading to sell-offs.
Support Levels: The price recently consolidated above the 18.0 - 20.0 range, which has transitioned from a resistance area to a "demand" or support zone.
Current Price Action: At 22.1, the stock is in a minor retracement. It is holding above its previous local lows, indicating that the multi-year uptrend remains intact despite short-term volatility.
Outlook
The stock remains bullish-neutral. For a sustained breakout, it needs to clear the 26.0 supply zone with high volume. Until then, it is likely to continue oscillating within the established upward channel.
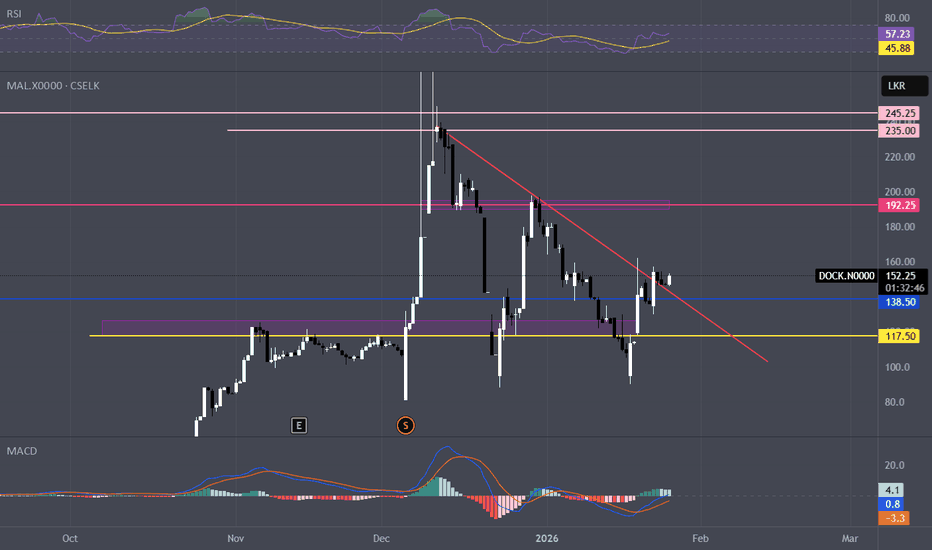
Dockyard at a critical turning point,watch the next move closelyBased on the current technical analysis, Dockyard’s share price shows a strong potential upside toward the LKR 180–190 range. The RSI indicates improving momentum from lower levels, while the MACD suggests a possible bullish crossover, supporting the likelihood of a near-term price recovery.
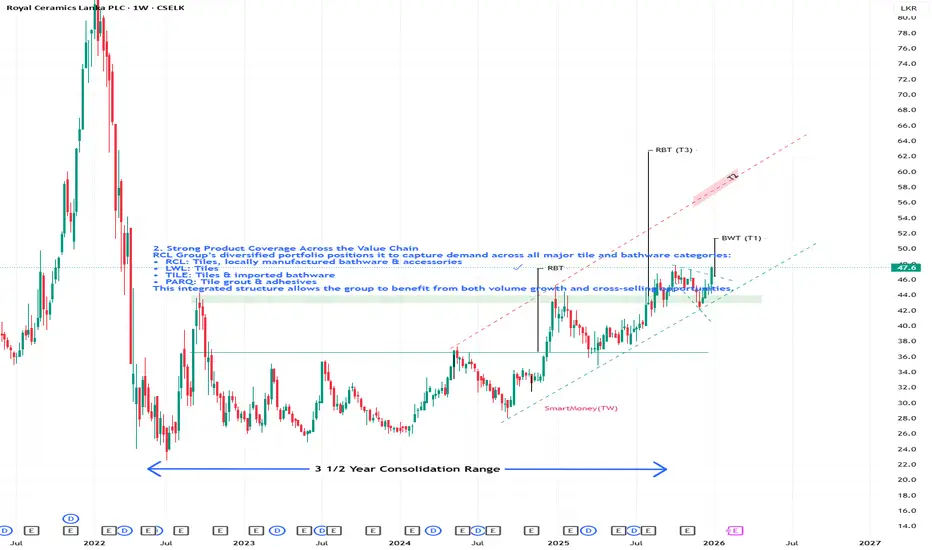
ROYAL CERAMICS LANKA PLC : RCL.N0000 : CSEOverview
Despite a broad market rally that pushed many CSE counters to new all‑time highs, Royal Ceramics Lanka PLC (RCL) has remained largely overlooked. The stock continues to trade at roughly 50% below its ATH, even though its fundamentals and sector exposure align closely with the ongoing property and construction business cycle.
In comparison, Prime Lands Residencies PLC (PLR)—which benefits from similar cyclical drivers—is trading at significantly higher valuation multiples. This divergence highlights a potential valuation gap in favor of RCL.
Valuation Comparison
RCL – Key Valuations
• T4Q EPS: LKR 5.019
• T4Q PER: 9.36
• NAV: LKR 45.77
• P/NAV: 1.00
PLR – Key Valuations
• T4Q EPS: LKR 1.50
• T4Q PER: 23
• NAV: LKR 11
• P/NAV: 3.13
RCL trades at roughly one‑third of PLR’s valuation, despite both companies being exposed to the same macro‑cycle of construction activity, housing demand, and post‑crisis recovery.
Key Catalysts
1. Post‑Cyclone Reconstruction Demand
Over 100,000 housing units were fully or partially damaged during the cyclone. As homeowners rebuild, a substantial portion is expected to undertake tiling, re‑tiling, and bath ware upgrades, creating pent‑up demand for tiles, grout, adhesives, and accessories over the next 1–2 quarters.
This reconstruction cycle is further supported by government compensation payments, which should accelerate renovation activity and cash‑flow availability
2. Strong Product Coverage Across the Value Chain
RCL Group’s diversified portfolio positions it to capture demand across all major tile and bath ware categories:
• RCL: Tiles, locally manufactured bath ware & accessories
• LWL: Tiles
• TILE: Tiles & imported bath ware
• PARQ: Tile grout & adhesives
3. Large Ready‑to‑Sell Inventory
The group holds over six months of finished‑goods inventory, valued at approximately LKR 40 billion at average selling prices.
This provides a significant strategic advantage:
• Immediate ability to supply reconstruction demand
• Faster revenue recognition
• No production bottlenecks
• Potential for improved cash flow conversion
Does others do have Inventory Advantage?
TKYO : No inventory as Cement has low shelf life. Do they have idling capacity to cater pent-up demand?
AEL : Large projects require tenders, approvals, funding, causing delays.
4. Management Re‑structuring of Subsidiaries
RCL’s key subsidiaries — LWL, TILE, and PARQ — have underperformed over the past several years, largely due to operational inefficiencies and management‑level shortcomings. During CY 2025, VONE initiated a full management overhaul of these subsidiaries, replacing leadership across all critical positions within these subsidiaries.
This restructuring is expected to deliver meaningful operational improvements, including:
• Better cost discipline
• Improved production efficiency
• Stronger inventory and working‑capital management
• Enhanced coordination across the group’s product lines
As these efficiencies materialize, the subsidiaries are likely to contribute more consistently and profitably to RCL’s consolidated earnings, strengthening the group’s overall financial performance.
Technical Analysis (Chart Patterns)
1. Short‑Term Pattern – Broadening Wedge Breakout
On 02 January 2026, RCL broke out of a broadening wedge pattern on shorter time frames.
This breakout indicates short‑term momentum continuation.
• Short‑term pattern target: LKR 51.40 – 52.00
2. Medium‑Term Pattern – Cup & Handle (C&H) Setup
Previous Update
In the update published on 7 October, we highlighted the potential for a breakout from a Cup & Handle pattern.
Although the breakout did not materialize at that time due to the broader market correction, the pattern structure remained intact.
Last Friday, the price retested the neckline, bringing the setup back into focus.
If a confirmed breakout occurs:
• Medium‑term pattern target: LKR 57 – 58
3. Macro Pattern – 3½‑Year Consolidation Breakout
RCL broke out of a 3½‑year consolidation range during the week starting 18 August 2025.
During the subsequent market correction, the price retested the neckline in the week starting 15 December, and successfully bounced off the retest, confirming structural strength.
This long consolidation has formed a rounded bottom pattern, typically associated with major trend reversals and multi‑quarter upside potential.
• Macro pattern target: LKR 62 – 63
Disclaimer
The information and publications are not meant to be, and do not constitute, financial, investment, trading, or other types of advice or recommendations.
ROYAL CERAMICS LANKA PLC : RCL.N0000 : CSEOverview
Despite a broad market rally that pushed many CSE counters to new all‑time highs, Royal Ceramics Lanka PLC (RCL) has remained largely overlooked. The stock continues to trade at roughly 50% below its ATH, even though its fundamentals and sector exposure align closely with the ongoing property and construction business cycle.
In comparison, Prime Lands Residencies PLC (PLR)—which benefits from similar cyclical drivers—is trading at significantly higher valuation multiples. This divergence highlights a potential valuation gap in favor of RCL.
Valuation Comparison
RCL – Key Valuations
• T4Q EPS: LKR 5.019
• T4Q PER: 9.36
• NAV: LKR 45.77
• P/NAV: 1.00
PLR – Key Valuations
• T4Q EPS: LKR 1.50
• T4Q PER: 23
• NAV: LKR 11
• P/NAV: 3.13
RCL trades at roughly one‑third of PLR’s valuation, despite both companies being exposed to the same macro‑cycle of construction activity, housing demand, and post‑crisis recovery.
Key Catalysts
1. Post‑Cyclone Reconstruction Demand
Over 100,000 housing units were fully or partially damaged during the cyclone. As homeowners rebuild, a substantial portion is expected to undertake tiling, re‑tiling, and bath ware upgrades, creating pent‑up demand for tiles, grout, adhesives, and accessories over the next 1–2 quarters.
This reconstruction cycle is further supported by government compensation payments, which should accelerate renovation activity and cash‑flow availability
2. Strong Product Coverage Across the Value Chain
RCL Group’s diversified portfolio positions it to capture demand across all major tile and bath ware categories:
• RCL: Tiles, locally manufactured bath ware & accessories
• LWL: Tiles
• TILE: Tiles & imported bath ware
• PARQ: Tile grout & adhesives
3. Large Ready‑to‑Sell Inventory
The group holds over six months of finished‑goods inventory, valued at approximately LKR 40 billion at average selling prices.
This provides a significant strategic advantage:
• Immediate ability to supply reconstruction demand
• Faster revenue recognition
• No production bottlenecks
• Potential for improved cash flow conversion
Does others do have Inventory Advantage?
TKYO : No inventory as Cement has low shelf life. Do they have idling capacity to cater pent-up demand?
AEL : Large projects require tenders, approvals, funding, causing delays.
4. Management Re‑structuring of Subsidiaries
RCL’s key subsidiaries — LWL, TILE, and PARQ — have underperformed over the past several years, largely due to operational inefficiencies and management‑level shortcomings. During CY 2025, VONE initiated a full management overhaul of these subsidiaries, replacing leadership across all critical positions within these subsidiaries.
This restructuring is expected to deliver meaningful operational improvements, including:
• Better cost discipline
• Improved production efficiency
• Stronger inventory and working‑capital management
• Enhanced coordination across the group’s product lines
As these efficiencies materialize, the subsidiaries are likely to contribute more consistently and profitably to RCL’s consolidated earnings, strengthening the group’s overall financial performance.
Technical Analysis (Chart Patterns)
1. Short‑Term Pattern – Broadening Wedge Breakout
On 02 January 2026, RCL broke out of a broadening wedge pattern on shorter time frames.
This breakout indicates short‑term momentum continuation.
• Short‑term pattern target: LKR 51.40 – 52.00
2. Medium‑Term Pattern – Cup & Handle (C&H) Setup
Previous Update
In the update published on 7 October, we highlighted the potential for a breakout from a Cup & Handle pattern.
Although the breakout did not materialize at that time due to the broader market correction, the pattern structure remained intact.
Last Friday, the price retested the neckline, bringing the setup back into focus.
If a confirmed breakout occurs:
• Medium‑term pattern target: LKR 57 – 58
3. Macro Pattern – 3½‑Year Consolidation Breakout
RCL broke out of a 3½‑year consolidation range during the week starting 18 August 2025.
During the subsequent market correction, the price retested the neckline in the week starting 15 December, and successfully bounced off the retest, confirming structural strength.
This long consolidation has formed a rounded bottom pattern, typically associated with major trend reversals and multi‑quarter upside potential.
• Macro pattern target: LKR 62 – 63
Disclaimer
The information and publications are not meant to be, and do not constitute, financial, investment, trading, or other types of advice or recommendations.
hSenid Business Solutions PLC / HBS.N0000 / CSEStrategy
1. Portfolio alignment to the sectors that will benefit from the rapid economic recovery of Sri Lanka.
2. Benefit from the expected price recovery/breaking out from the 1-year consolidation range (bottoming out) after post IPO selloff.
Most of the selling came from the account: Mr. O.E.H. Kalvo which had 19,800,000 shares as at 31st Dec. 2021 and are expected to be over by now.
Fundamentals
* Continuous top line growth during last 4 quarters
* As Sri Lanka's economy is on a growth phase exceeding forecasts HBS will benefit from
increased IT budget allocations of other companies and new ventures.
* Business exposure to high growth areas of the world (South Asia, Southeast Asia, Middle East and East Africa)
* Most of the major shareholders opted the dividend in the script form (reinvesting the dividend in the company) instead cash which shows the strong confidence of the company's growth trajectory.
No of shareholders requested for 100% script dividend: 12%
No of shareholders requested for 50% cash & 50% script dividend: 45%
Q1 2024 earnings
Revenue up 30.5% YoY & 7.6% QoQ
New deal closures up 44% YoY
Dividend Yield
Last Dividend LKR 1.25 (Cash/Scrip or both 50/50)
DY : 10.4% (Market DY 4.4% / 1 Year FD rate 8%)
IPO
Opened: 3rd Dec 2021
IPO Price : LKR 12.50
CSE debut Price LKR 28.50
52 Week Price Range
High : LKR 14.00
Low : LKR 10.50
Technical Analysis (Chart Patterns)
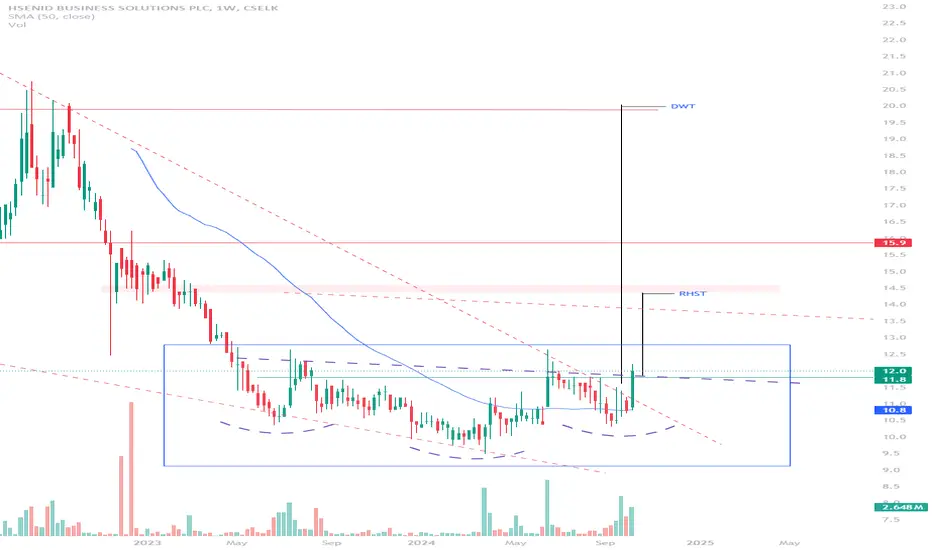
* HBS had created a Descending Wedge pattern during the post IPO selloff and a Reverse Head & Shoulder pattern during the 1 yearlong price consolidation (Dividend adjusted chart).
* Both these patterns recorded breakouts during last week.
Potential Pattern Targets
* Multi week descending wedge target LKR 20.00
* Reverse head & shoulder target LKR 14.30
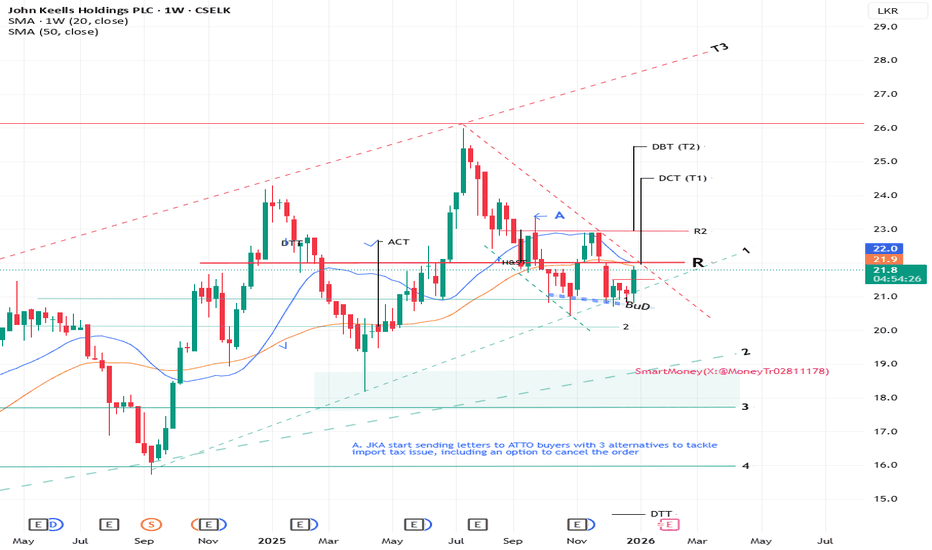
JOHN KEELLS HOLDINGS PLC : JKH.N0000 : CSEOverview
John Keells Holdings (JKH) remains the largest listed company on the Colombo Stock Exchange (CSE), backed by strong fundamentals, high liquidity, and its long‑standing blue‑chip status.
JKH peaked roughly four months ahead of the ASI and went through a four‑month correction, pushing it into oversold territory earlier. Thanks to that early reset, JKH is now well‑positioned to lead the market if the broader uptrend continues into 2026.
Fundamentals
• West Container Terminal – Phase 2 is expected to be completed ahead of schedule by mid‑2026.
• BYD‑related issues appear to be nearing resolution.
• City of Dreams is expected to contribute meaningfully once operations stabilize.
• Retail segment continues to deliver strong performance.
Speculative angles
• Potential SAGT–CWIT merger:
Bringing the transshipment port and mainline port under one umbrella is strategically logical and could unlock significant capital gains for JKH.
• Possible divestment of older city hotel properties:
A long‑speculated move that could release capital and improve balance‑sheet flexibility
Technical Analysis (Chart Patterns)
After a five‑month decline, JKH spent nearly 20 days consolidating along the lower support line of the ascending wedge, despite notable foreign selling.
On 31 Dec 2025, the stock closed above the absorption range, signaling a bullish bias and turning daily momentum positive. Weekly momentum is close to flipping positive as well, which could happen this week if upward pressure continues.
A bullish divergence is also visible on the weekly chart.
With a shift in weekly momentum, a breakout from the descending channel becomes increasingly possible.
The LKR 22 zone remains a key resistance area to watch.
Potential Pattern Targets
• Descending channel breakout target: LKR 24.50 (breakout pending)
• Double‑bottom “W” pattern target: LKR 25.50 (breakout pending)
• Upper resistance of ascending wedge: LKR 27.00–28.50
Invalidation
A close below the 20‑day consolidation zone would invalidate the current bullish setup.
Disclaimer
The information and publications are not meant to be, and do not constitute, financial, investment, trading, or other types of advice or recommendations.
TEEJAY LANKA PLC (TJL.N0000) - Technical Analysis Alert! ## 📊 TEEJAY LANKA PLC (TJL.N0000) - Technical Analysis Alert! 🚨
**Current Price: LKR 36.20 (-1.63%)** 📉
---
### 🔍 WHAT'S HAPPENING?
Teejay Lanka is trading in a **strong downtrend** and approaching critical support levels. The stock has dropped significantly from its 2024 highs and is now testing multi-year support zones.
---
### 📈 KEY TECHNICAL LEVELS
**RESISTANCE ZONES (Upside Barriers):**
🔴 LKR 40.00 - Psychological level
🔴 LKR 45.40 - Major resistance (0.618 Fib)
🔴 LKR 48.00 - Strong barrier
🔴 LKR 53.80 - Upper resistance
**SUPPORT ZONES (Downside Protection):**
🟢 LKR 34.70 - Current support (CRITICAL!)
🟢 LKR 30-32 - Multi-year support zone
---
### 📊 RSI INDICATOR
**RSI at 23.50** - OVERSOLD TERRITORY! ⚠️
This suggests:
✅ Potential short-term bounce coming
❌ BUT can stay oversold in strong downtrends
⏳ Wait for confirmation before jumping in
---
### 🎯 TRADING SCENARIOS
**🔴 BEARISH CASE (Current Trend):**
- Clear downtrend intact
- If breaks below LKR 34 → Target: LKR 30-32
- Risk of further downside
**🟢 BULLISH BOUNCE (Contrarian Play):**
- Entry: LKR 34-36 (HIGH RISK!)
- Stop Loss: Below LKR 33
- Target 1: LKR 40 (11% gain)
- Target 2: LKR 42-45 (16-24% gain)
- **Needs volume confirmation!**
---
### 💡 MY RECOMMENDATION
**FOR CONSERVATIVE INVESTORS:**
❌ **STAY AWAY** - Wait for clear reversal signals
- Need break above LKR 40 with volume
- Look for higher lows forming
- Be patient!
**FOR AGGRESSIVE TRADERS:**
⚠️ **HIGH RISK BOUNCE PLAY**
- Small position size only
- Tight stop loss at LKR 33
- Quick profit-taking at LKR 40-42
- NOT for long-term holding yet
**FOR LONG-TERM INVESTORS:**
⏳ **WAIT FOR BETTER ENTRY**
- Consider accumulation if drops to LKR 30-32
- Check fundamentals first!
- Dollar-cost averaging strategy
- Minimum 12-18 month horizon
---
### ⚠️ RISK FACTORS
🔸 Strong downtrend - trend is NOT your friend here
🔸 Trading near multi-year lows
🔸 No clear reversal pattern yet
🔸 Textile sector facing headwinds
🔸 Low trading volume
---
### ✅ POTENTIAL POSITIVES
🔹 RSI deeply oversold (23.50)
🔹 Near historical support zone
🔹 Export-oriented (benefits from weak LKR)
🔹 Supplies global brands
🔹 Possible value zone if fundamentals intact
---
### 🎪 THE BOTTOM LINE
**OVERALL RATING:** ⭐⭐⭐ (3/5)
**Technical Outlook:** BEARISH with oversold bounce potential
**The stock is at a CRITICAL DECISION POINT:**
- Break below LKR 34 = More pain ahead 😢
- Bounce above LKR 40 = Short-term relief 😊
- Break above LKR 45 = Trend reversal possible 🚀
**Current Setup:** 📉 60% bearish, 40% bounce possibility
---
### 📌 WHAT TO WATCH
✔️ Daily close above LKR 38 = First positive sign
✔️ Break above LKR 40 with volume = Bounce confirmed
✔️ RSI bullish divergence = Reversal signal
✔️ Volume spike on up days = Accumulation starting
❌ Break below LKR 34 = Exit/avoid
❌ Low volume rallies = Weak bounce
❌ RSI staying below 30 = Continued weakness
---
### 💬 MY TAKE
Unless you're a skilled short-term trader hunting oversold bounces, it's better to **WAIT ON THE SIDELINES**. The chart is screaming "caution" with that persistent downtrend.
**Remember:** Catching a falling knife can hurt! 🔪
Wait for the knife to hit the floor and stick before picking it up. Let the stock prove itself with a confirmed reversal pattern.
---
### 🔔 DISCLAIMER
This is technical analysis based on chart patterns and indicators. NOT financial advice!
✅ Always do your own research
✅ Check company fundamentals
✅ Consult a licensed financial advisor
✅ Never invest more than you can afford to lose
✅ Past performance ≠ future results
---
### 📊 Chart Rating: 4/10 (Long-term) | 6/10 (Short-term bounce)
---
**What do YOU think? Is this a value opportunity or a value trap? Drop your thoughts below! 👇**
**Like 👍 | Share 🔄 | Follow for more CSE analysis! 📈**
---
#TJL #TeejayLanka #CSE #SriLankaStockMarket #StockAnalysis #TechnicalAnalysis #Investing #Trading #Finance #LKR #StockMarket #InvestingTips #CSEStocks #SriLankaInvesting #StockAlert #MarketAnalysis #TradingView
---
**📢 Want analysis on other CSE stocks? Comment the ticker below!**
PACK.N BREAKOUT ON SUPPORTThe chart displays a clear downtrend from a high of approximately LKR 16.8 in late 2024, followed by a significant decline. A potential reversal or base-forming phase appears to have begun around the May 2025 low (around LKR 13.0).
Current Market Structure
The stock has been trading in a sideways consolidation range since July 2025, primarily between the Daily Support area (approx. LKR 14.6 to LKR 14.8) and a local high around LKR 16.0.
Bearish Signal: The most recent weekly candlestick (ending early November 2025) is a large bearish candle that has decisively broken below the Daily Support zone and a previously respected rising dashed trendline. The closing price of LKR 14.4 is below these key levels, indicating a shift in short-term momentum from neutral to bearish. This breakdown suggests that the sellers have regained control.
Projection
The decisive breakdown below the LKR 14.6 - LKR 14.8 support area points to a high probability of a further decline to the next major support zone.
Initial Target (Weekly Support): The immediate projection is a move down towards the Weekly Support zone, which is clearly defined between approximately LKR 13.4 and LKR 13.7. This zone was a previous level of strong support and resistance.
Continuation: If the price fails to hold the Weekly Support zone, the next potential downside target would be the April/May 2025 low around LKR 13.0.
In summary, the chart shows a breakdown from a consolidation pattern, leading to a bearish short-term projection targeting the Weekly Support between LKR 13.4 and LKR 13.7.
TKYO.N BEARISH PROJECTIONThe stock established a strong uptrend from June 2025, defined by the solid Trend Line which acted as dynamic support. This uptrend led the price to challenge and briefly break above the significant Resistance zone around LKR 91.5 - LKR 94.0 in October.
Current Technical Status
The key development is the recent breakdown of the ascending Trend Line, which the chart labels as a "Bearish Breakout."
Failed Breakout: The move above the LKR 91.5 - LKR 94.0 Resistance zone proved to be unsustainable, resulting in a false breakout (or bull trap). The price rapidly moved back into the previous trading range and then decisively fell through the major uptrend line.
Breakdown Confirmation: The current price of LKR 87.0 is now trading below the broken Trend Line, confirming the loss of short-term upward momentum and a shift in market control to the sellers.
Projection
The immediate technical bias is bearish, following the failed breakout at the top and the confirmed breakdown of the uptrend line.
The most likely projection is a continued decline towards the next major support level, which is the "Key Level" zone around LKR 78.5 - LKR 81.5. This zone previously acted as strong resistance through the first half of 2025 before the breakout in August and is now expected to provide significant support.
Should the LKR 78.5 - LKR 81.5 Key Level fail to hold, it would indicate a substantial reversal of the 2025 uptrend and suggest a deeper correction. However, the initial target for the current bearish movement is clearly the Key Level zone.
Would you like me to search for any recent construction sector news or company-specific updates that could be influencing the recent price action of Tokyo Cement? That's an excellent follow-up question. Analyzing the fundamentals alongside the technical breakdown provides a much clearer picture.
The recent news search reveals a contradiction between the overall positive fundamental outlook for the sector and the current bearish technical price action.
Fundamental Context (Bullish)
Construction Sector Rebounding: Recent Purchasing Managers' Index (PMI) data shows strong expansion in Sri Lanka's construction sector, with the September 2025 PMI (67.6) marking the strongest increase since late 2021 and new orders/project availability increasing significantly, particularly in road rehabilitation.
Company Performance: Tokyo Cement reported a solid Q2 FY25/26 (ending Sept 2025) with a turnover of LKR 16.322 billion, up from LKR 13.833 billion YoY. The construction sector is noted as having a "sustained boom," with September recording the highest cement sales volumes since the 2022 economic crisis.
Outlook: The outlook is positive, citing sustained growth momentum due to low interest rates, a stable currency, subdued inflation, and government investment in infrastructure and housing (like the Urban Regeneration Programme).
Technical vs. Fundamental Synthesis
The technical analysis shows a Bearish Breakdown (failed breakout at LKR 94.0, confirmed loss of the uptrend line), projecting a decline to the LKR 78.5 - LKR 81.5 Key Level.
The fundamental news, however, indicates a Strong Bullish Sector Recovery coinciding with the period the price was near its highs (June to October 2025). The short-term bearish technical move is therefore likely not a result of a fundamental collapse, but rather:
Profit-Taking/Distribution: Investors who bought earlier in the year are taking profits after the stock successfully ran up in anticipation of the improving sector results, leading to the failed breakout (bull trap) and sharp correction.
Margin Contraction: Tokyo Cement's Q2 Profit After Tax (PAT) of LKR 1,003 million was slightly lower than the previous year (LKR 1,082 million), despite higher revenue. The company noted that profit margins contracted due to the capitalization of its Trincomalee expansion projects. This might be the specific fundamental trigger for the selling pressure seen in late October/early November, as investors react to the slight drop in profitability amidst increasing volume.
Revised Projection (Integrated View)
The technical projection remains a decline to the LKR 78.5 - LKR 81.5 Key Level. However, given the robust fundamental backdrop (strong sector growth and record sales volumes), this drop is likely a buying opportunity rather than the start of a deep bear market.
The LKR 78.5 - LKR 81.5 zone is a high-probability reversal area where the technical support aligns with the strong long-term fundamental recovery story. A bounce is expected from this level as value investors and long-term traders look to enter based on the positive sector outlook.