L O L C HOLDINGS PLCCSELK:LOLC.N0000
This chart and analysis are not financial advice. Do your own research before trading or investing.
On the weekly chart, LOLC stock finds support within the Fibonacci golden pocket. Notably, the convergence and break of MA 10, 50, 200, and TL resistance could strongly influence upcoming price movements.
Conversely, the daily chart witnesses the 10 DMA break, albeit with insufficient volume. Immediate support lies in the 370-395 range. On the upside, the 50 DMA and TL resistance pose challenges.
Daily RSI portrays upward movement as it finds support from the TL support. Monitoring these technical factors is key.
CALT.N - CAPITAL ALLIANCE PLCCSELK:CALT.N0000
This chart and analysis are not financial advice. Do your own research before trading or investing.
In the weekly chart, CALT's share price closed within the 60-61 support range, ending the week with a red candle. This level coincides with the strong 0.5 Fibonacci support. The weekly RSI indicator shows that the support line remains intact, with a close above it.
Turning to the daily chart, breaking the 10-day moving average (DMA - the yellow line) is crucial for signs of an upcoming uptrend. The RSI indicator is also encouraging, with the share price finding support at S TL#1 and successfully breaking and closing above S TL #2.
SLT.N - SRI LANKA TELECOM PLCCSELK:SLTL.N0000
This chart and analysis are not financial advice. Do your own research before trading or investing.
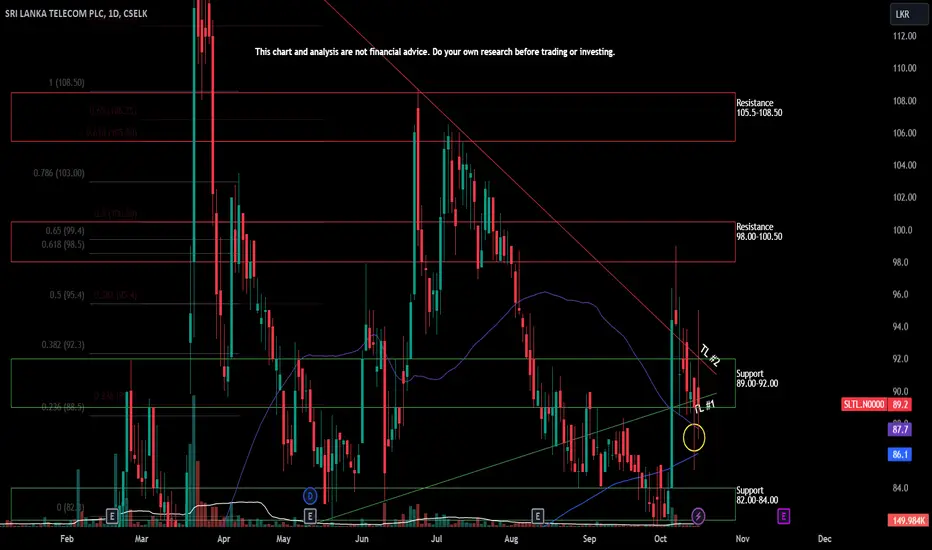
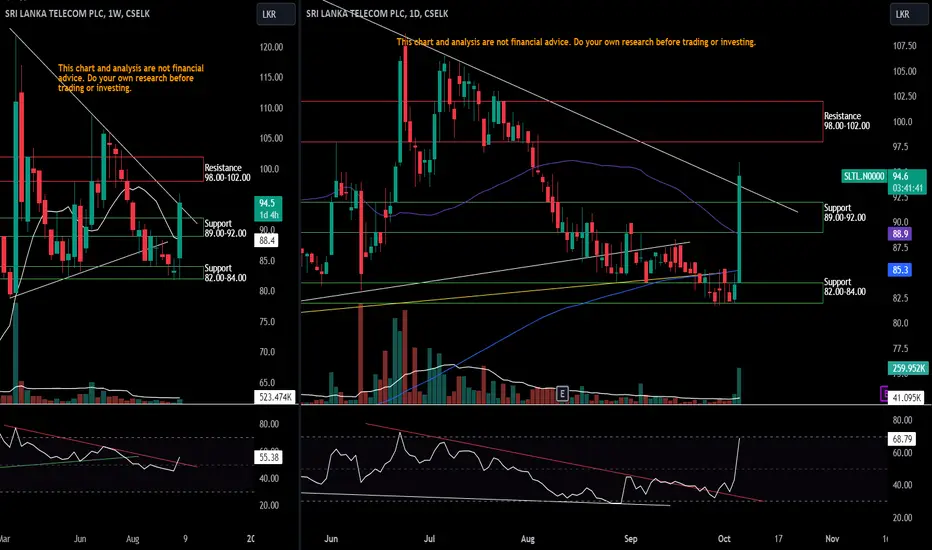
Stock SLTL found solid support in the 89-92 zone, beginning an upward surge marked by a significant green candle. It tested the 98-100.50 resistance zone and closed just below it. The surge saw robust trading volume, reflecting optimism.
The daily RSI indicator is equally promising, as it broke above and closed beyond the resistance trendline (R TL).
SLT.N - SRI LANKA TELECOM PLCThis chart and analysis are not financial advice. Do your own research before trading or investing.
CSELK:SLTL.N0000
It is trading above the 10-day, 30-day, and 50-day moving averages (DMA), which are all converging to create a confluence zone.
Furthermore, the closing price has breached and is trading above the upper trend line of a triangle pattern.
Notably, there is strong support in the range of 89-92, and this support area has been consistently respected by the market at present.
LALU.N0000Wait for a pullback around 16 to 18
Disclaimer: The information and analysis provided in this publication are for educational purposes only and should not be construed as financial advice or recommendations to buy, sell, or hold any securities. The author and TradingView are not responsible for any investment decisions made based on the content presented herein. Always consult a financial professional before making any investment decisions.
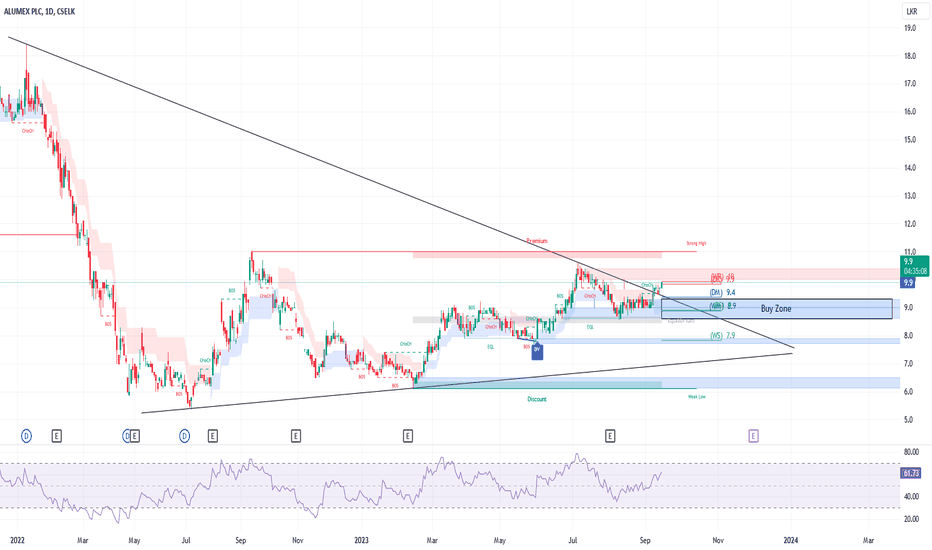
ALUM.N0000Buy Zone mentioned in above chart.
Disclaimer: The information and analysis provided in this publication are for educational purposes only and should not be construed as financial advice or recommendations to buy, sell, or hold any securities. The author and TradingView are not responsible for any investment decisions made based on the content presented herein. Always consult a financial professional before making any investment decisions.
CALT StatusAccording to the daily chart, the trendline from July has been clearly broken to the downside.
Currently, it is holding the 75.00 LKR level, which is crucial for the stock.
It can say that the stock is consolidating within 75.00 - 92.50 LKR range.
Immediate resistance box is 81.60 - 84.70 LKR, which has been created by the gap.
However, 75.00 LKR should be the stop loss (SL) for the stock. A close below 75.00 LKR, next support would be 60.40 LKR.
Note: To break a trendline or a support/resistance level, for me, either;
- the stock has to have 3 consecutive closes below/above that level OR
- a full candle should trade below/above that level
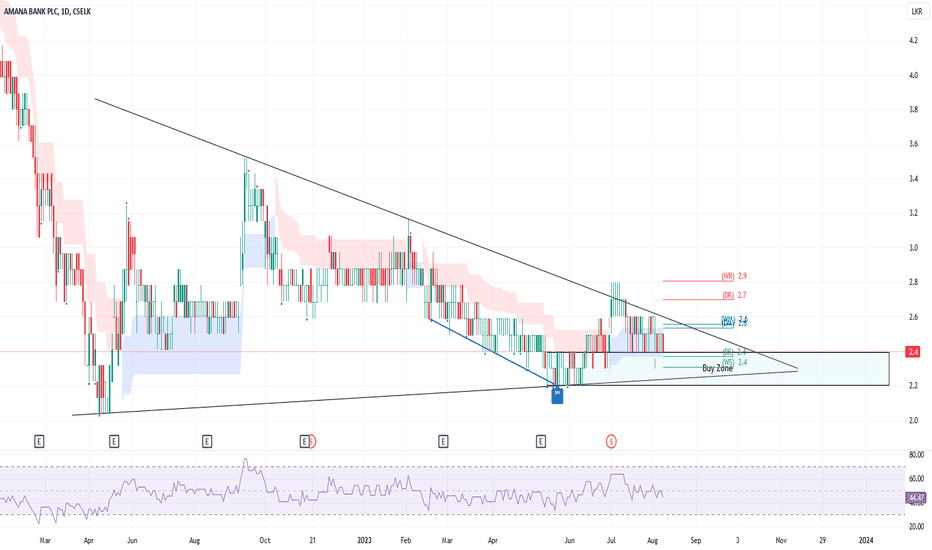
ABL.N0000Buy Zone has been mentioned in above chart.
Disclaimer: The information and analysis provided in this publication are for educational purposes only and should not be construed as financial advice or recommendations to buy, sell, or hold any securities. The author and TradingView are not responsible for any investment decisions made based on the content presented herein. Always consult a financial professional before making any investment decisions.
SLT.N - SRI LANKA TELECOM PLCThis chart and analysis are not financial advice. Do your own research before trading or investing.
01. SLTL has recently achieved a significant breakthrough from a long-standing triangle pattern, marked by a substantial bullish candle and a notable surge in trading volume compared to the average. Moreover, it successfully surpassed both TL #1 and TL #2, overcoming the 50-day moving average resistance.
02. The convergence of TL #1 and TL #2 is expected in the range of Support 89.00-92.00, providing immediate support for SLTL. This area will serve as a confluence point for the two trendlines.
03. In terms of the RSI indicator, TL #1 may function as the initial line of support.
04. Currently, the primary resistance level stands in the range of 98.00-100.50.
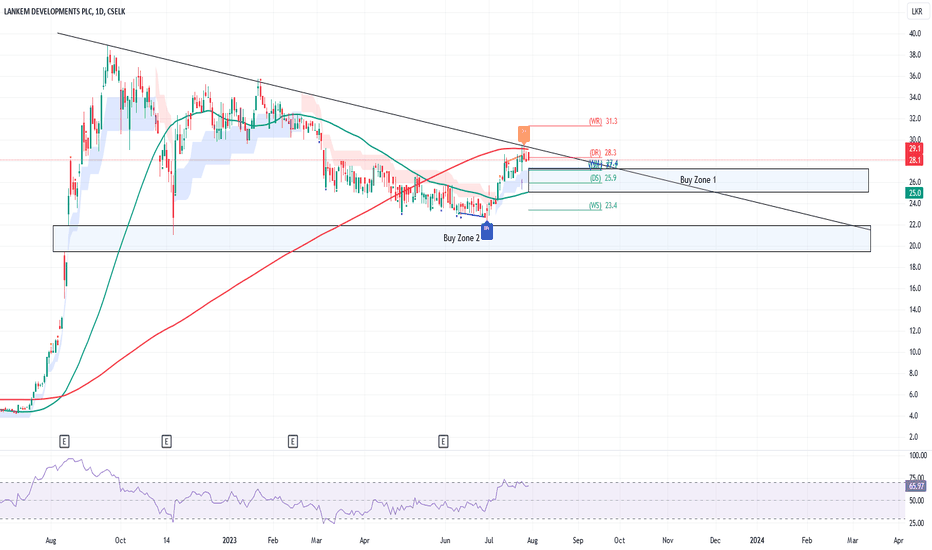
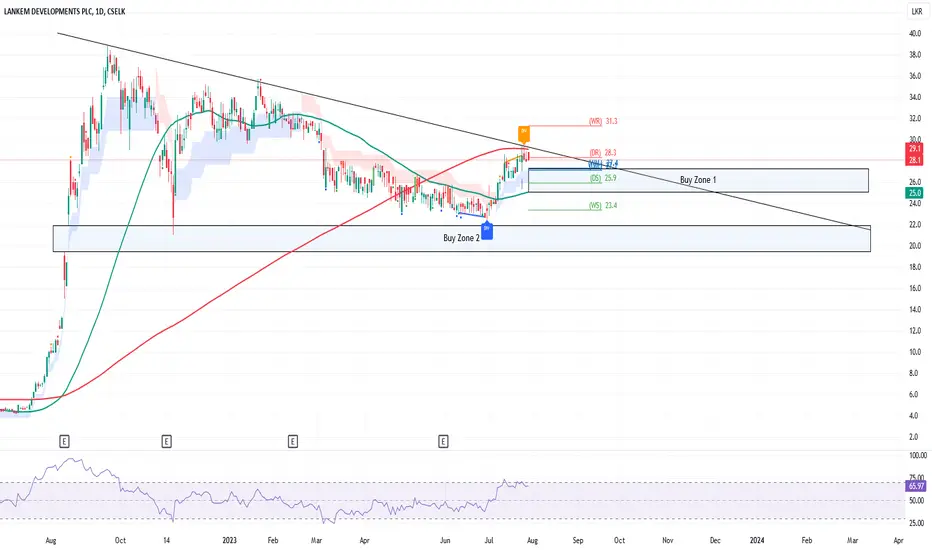
LDEV.N0000Having a resistance on 200 Daily MA and support around 50 Daily MA.
Closely monitor two buy zones.
Disclaimer: The information and analysis provided in this publication are for educational purposes only and should not be construed as financial advice or recommendations to buy, sell, or hold any securities. The author and TradingView are not responsible for any investment decisions made based on the content presented herein. Always consult a financial professional before making any investment decisions.
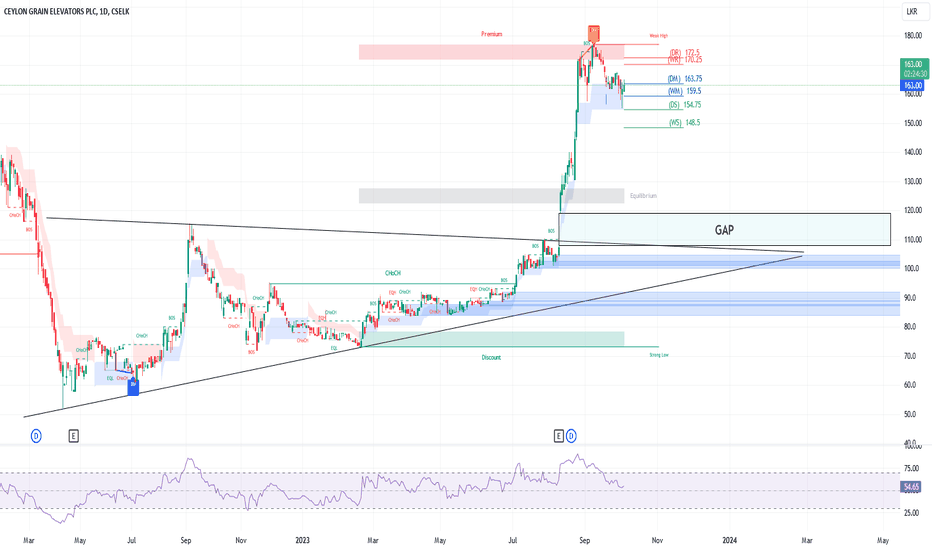
GRAN.N0000There is a gap in above chart. There is a possibility that gap will be filled in near future.
Disclaimer: The information and analysis provided in this publication are for educational purposes only and should not be construed as financial advice or recommendations to buy, sell, or hold any securities. The author and TradingView are not responsible for any investment decisions made based on the content presented herein. Always consult a financial professional before making any investment decisions.
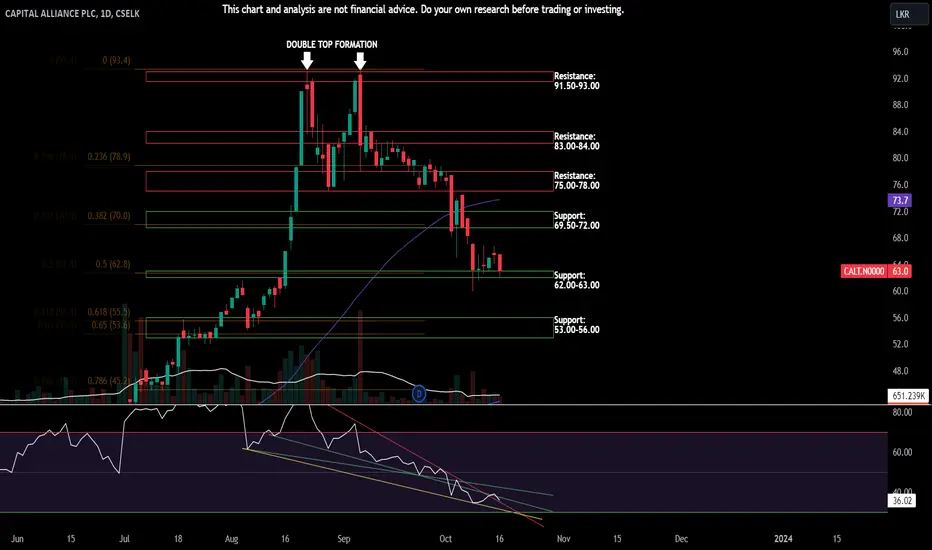
CALT.N - CAPITAL ALLIANCE PLCThis chart and analysis are not financial advice. Do your own research before trading or investing.
01. After a double top formation, the share price steadily dropped and found support at the Fibonacci 23.6% level.
02. Then it tested the support level at 38.2% but failed to close above it.
03. The share price closed below the 50-day moving average.
04. The RSI line broke below the supporting trend line.
CALT creating a double bottom!!!CALT has broken its ATH twice and has retraced, but is holding support well as a few big guns seem to be collecting and waiting for its next Q results.
By the looks of it, CALT is creating a double-bottom pattern as it awaits further reduction of Interest rates and its next Q results.
Only a matter of time before the security breaks out and goes towards new heights.
An attractive dividend of 3.04 is also up for grabs as its XD date approaches us on the 21st of September.
Let's watch and see how it would perform!!!
Clearly not investment advise, DYOR!!!
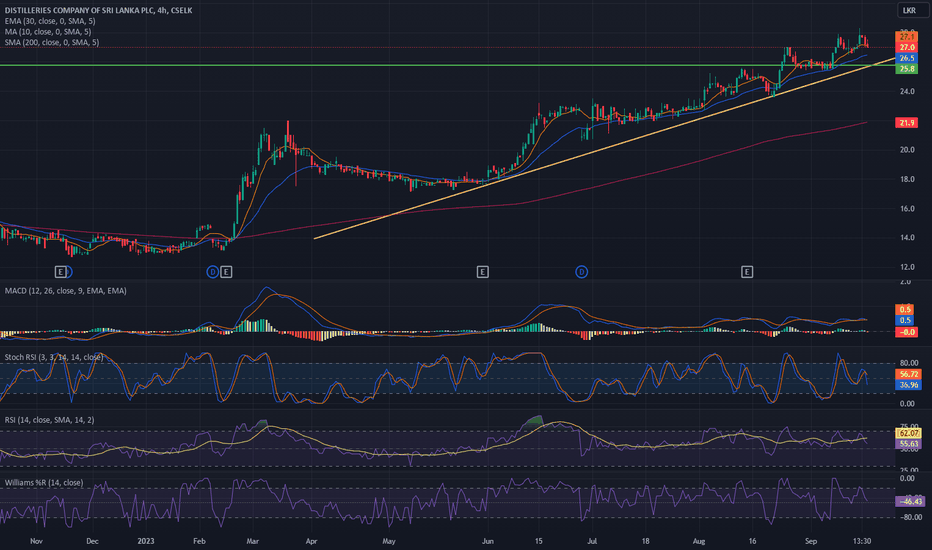
DIST - Navigating Challenges and Thriving 27 -> 36**Financial Disclaimer:** The information presented is for informational purposes only and should not be considered as financial or investment advice. It does not constitute a recommendation to buy, sell, or hold any financial instruments. All investments carry inherent risks, and past performance is not indicative of future results. Before making any financial decisions, conduct thorough research, assess your individual financial situation and objectives, and consult a qualified financial advisor. The financial markets are subject to volatility, and prices can change rapidly and unpredictably. Any actions taken based on the information provided are at your own risk, and we bear no responsibility for resulting losses or damages. Additionally, please note that financial regulations and market conditions may vary by region, so compliance with local rules and regulations is crucial.
Symbol: DIST
Timeframe: Annual Report 2022/23
Overview:
The Chairman's Statement from DCSL's annual report for 2022/23 showcases the company's remarkable resilience in the face of economic adversity in Sri Lanka. This presents a compelling opportunity for investors.
Key Points:
1. Economic Challenges: Sri Lanka grappled with severe economic challenges, including inflation, political turmoil, and commodity price surges. Despite these hurdles, DCSL demonstrated strength and adaptability.
2. Robust Financials: DCSL reported an impressive 15% increase in turnover to Rs. 123 billion, with a noteworthy profit after tax of Rs. 18.8 billion. This underscores the company's strong financial position and effective cost management.
3. Credit Rating: DCSL maintains an enviable National Long-Term Rating of "AAA" with a Stable Outlook from Fitch Ratings, highlighting its resilience during tough business conditions.
4. Taxation Issues in Alcohol Industry: The statement sheds light on taxation challenges within the alcohol industry, a sector where DCSL operates. Investors should closely monitor how regulatory changes could impact the company's future earnings.
5. Corporate Governance: DCSL's commitment to stringent corporate governance practices signals responsible and transparent business operations, making it an attractive prospect for long-term investors.
Trading Plan:
With DCSL's impressive financial performance and demonstrated resilience, consider the following trading plan:
- Entry: Look for an opportune entry point as the stock exhibits stability and upward momentum.
- Stop-Loss: Implement a stop-loss order just below a significant support level to manage risk effectively.
- Target: Set a profit target based on thorough technical analysis and your risk tolerance.
Risks:
- Economic Uncertainty: The persistence of economic instability in Sri Lanka may affect DCSL's performance.
- Regulatory Changes: Any unfavorable alterations in taxation or industry regulations could impact the company's profitability.
- Market Sentiment: Keep abreast of broader market sentiment and relevant news that might influence DCSL's stock.
Always conduct meticulous research and assess your risk tolerance before making trading or investment decisions.
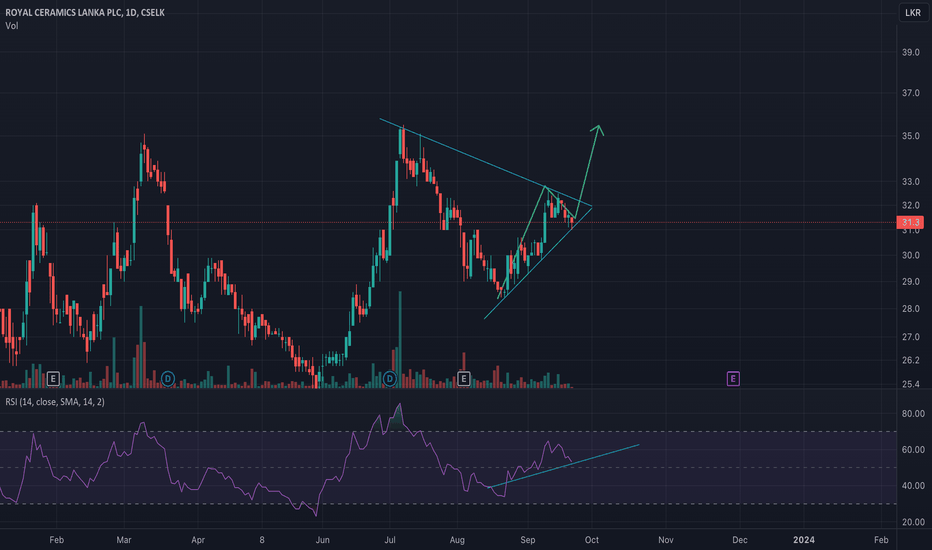
RCL.N - ROYAL CERAMICS LANKA PLCDisclaimer: This chart and analysis are not meant to be, and do not constitute, financial, investment, trading, or other types of advice or recommendations. Do your own due diligence before trading or investing in any stock exchanges, Indices, Stocks, Forex, Crypto etc.
CSELK:RCL.N0000
CALT.N - CAPITAL ALLIANCE PLCDisclaimer: This chart and analysis are not meant to be, and do not constitute, financial, investment, trading, or other types of advice or recommendations. Do your own due diligence before trading or investing in any stock exchanges, Indices, Stocks, Forex, Crypto etc.
CSELK:CALT.N0000