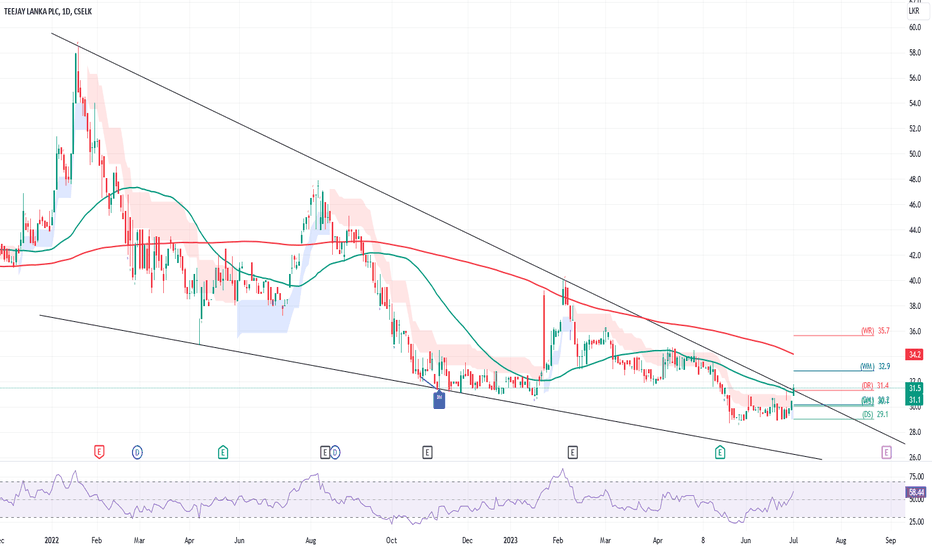
TEEJAY LANKA PLC - Falling Wedge PatternEntry Point: 30 to 31
Profit Target: 40
Stop-Loss: 28
Disclaimer: The information and analysis provided in this publication are for educational purposes only and should not be construed as financial advice or recommendations to buy, sell, or hold any securities. The author and TradingView are not responsible for any investment decisions made based on the content presented herein. Always consult a financial professional before making any investment decisions.
SLT.N - SRI LANKA TELECOM PLCDisclaimer: This chart and analysis are not meant to be, and do not constitute, financial, investment, trading, or other types of advice or recommendations. Do your own due diligence before trading or investing in any stock exchanges, Indices, Stocks, Forex, Crypto etc.
CSELK:SLTL.N0000
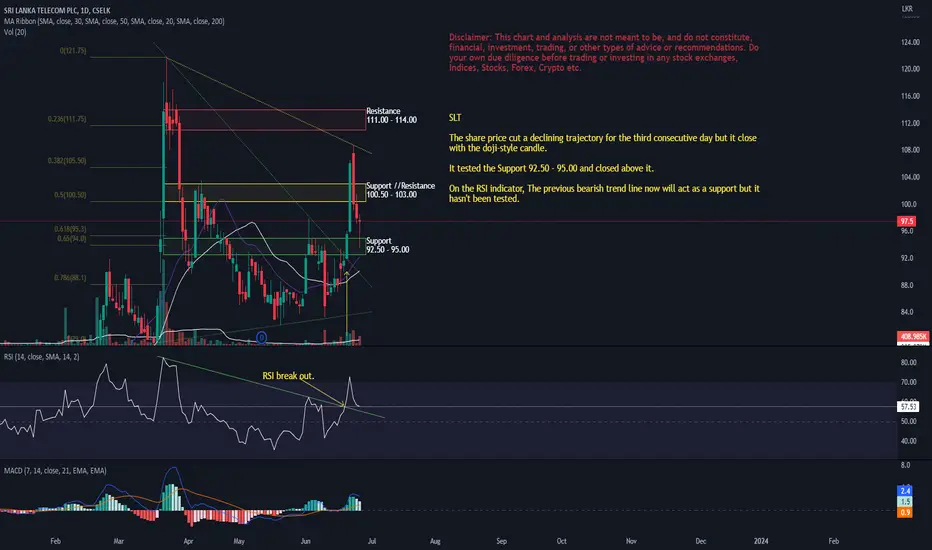
SLT
The share price cut a declining trajectory for the third consecutive day but it close with the doji-style candle.
It tested the Support 92.50 - 95.00 and closed above it.
On the RSI indicator, The previous bearish trend line now will act as a support but it hasn't been tested.
SCAP.N - SOFTLOGIC CAPITAL PLCDisclaimer: This chart and analysis are not meant to be, and do not constitute, financial, investment, trading, or other types of advice or recommendations. Do your own due diligence before trading or investing in any stock exchanges, Indices, Stocks, Forex, Crypto etc.
CSELK:SCAP.N0000
MARA - Ready for Run?Increased volumes signals renewed Interest on MARA post its rights issue at LKR 2.00. The Hotel was ranked the best "All Inclusive Hotel" in Sri Lanka by Trip Advisor and 11th in Asia. The company reported a positive EPS of 0.33 in Q4 FY23.Historically, LKR 2.00 has appeared to be a price of support. Yet trading below 100 / 50 EMA, a break-out from LKR 2.4 would likely see it reach LKR 3.0 - LKR 3.4.
RCL.N - ROYAL CERAMICS LANKA PLCDisclaimer: This chart and analysis are not meant to be, and do not constitute, financial, investment, trading, or other types of advice or recommendations. Do your own due diligence before trading or investing in any stock exchanges, Indices, Stocks, Forex, Crypto etc.
CSELK:RCL.N0000
RCL Weekly
Checking on the weekly chart we see that it has broken the downward trend line and close above it.
MA 30 is now Flattening out which will eventually create stage one.
Currently, it is very resistance and just closed on it.
During trading hours we so high volume moments during the week.
RCL Daily
Checking on the daily chart it is at the MA 200 resistance.
Breaking above and keeping above the MA 200 will be a huge impact on the share price.
AGST.N - AGSTAR PLCDisclaimer: This chart and analysis are not meant to be, and do not constitute, financial, investment, trading, or other types of advice or recommendations. Do your own due diligence before trading or investing in any stock exchanges, Indices, Stocks, Forex, Crypto etc.
CSELK:AGST.N0000
DPL.N - DANKOTUWA PORCELAIN PLCDisclaimer: This chart and analysis are not meant to be, and do not constitute, financial, investment, trading, or other types of advice or recommendations. Do your own due diligence before trading or investing in any stock exchanges, Indices, Stocks, Forex, Crypto etc.
CSELK:DPL.N0000
DPL Weekly
On the weekly chart, we can still see that the share price is intact with the MA 30, which means it is still in stage 2.
Currently, it is taking the support on the zones 25 to 26 range.
Additionally, it has created a descending trend line with the previous week's candle now will act as resistance.
DPL Daily
On the daily chart, it is noticeable that MA 50 is curving upwards towards the MA 200. If this can create a golden cross it will be hugely effective for the share price movement.
LIOC.N - LANKA IOC PLCDisclaimer: This chart and analysis are not meant to be, and do not constitute, financial, investment, trading, or other types of advice or recommendations. Do your own due diligence before trading or investing in any stock exchanges, Indices, Stocks, Forex, Crypto etc.
CSELK:LIOC.N0000
LIOC Weekly
Looking at the stage analyzing method in the weekly chart the stock price is at the stage 4 level now. it has taken support from the Fibonacci golden pocket and seems to be holding that range in the daily chart.
On the weekly chart, the RSI trend line hasn't been broken.
LIOC Daily
On the daily chart, the MA 20 is the immediate resistance which is also near the GP.
Breaking above the supporting trend line created by the descending wedge might take the price level to MA 50 levels which is resistance also in Confluence with the upper trendline of the descending wedge.
CALT.N - CAPITAL ALLIANCE PLCDisclaimer: This chart and analysis are not meant to be, and do not constitute, financial, investment, trading, or other types of advice or recommendations. Do your own due diligence before trading or investing in any stock exchanges, Indices, Stocks, Forex, Crypto etc.
CSELK:CALT.N0000
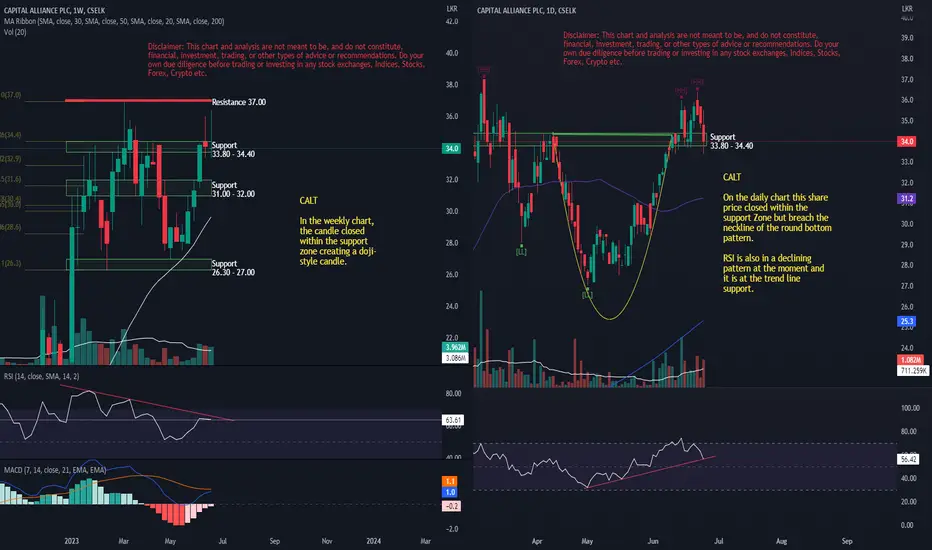
CALT
In the weekly chart, the candle closed within the support zone creating a doji-style candle.
CALT
On the daily chart this share price closed within the support Zone but breach the neckline of the round bottom pattern.
RSI is also in a declining pattern at the moment and it is at the trend line support.
SLT.N - SRI LANKA TELECOM PLCDisclaimer: This chart and analysis are not meant to be, and do not constitute, financial, investment, trading, or other types of advice or recommendations. Do your own due diligence before trading or investing in any stock exchanges, Indices, Stocks, Forex, Crypto etc.
CSELK:SLTL.N0000
SLT
The share price took a declining path for the last 2 days. but today the selling volume was less when compared to yesterday. It lost the support of Fibonacci level 0.5 after breaking about it.
Now we are looking at the next support level Fibonacci level golden pocket Zone which is also confluence with the previous trend line. MA 30 on the daily chart it's also going to provide support.
This share price might test both trend lines in the RSI indicator and on the Candlestick chart.
SLT.N - SRI LANKA TELECOM PLCDisclaimer: This chart and analysis are not meant to be, and do not constitute, financial, investment, trading, or other types of advice or recommendations. Do your own due diligence before trading or investing in any stock exchanges, Indices, Stocks, Forex, Crypto etc.
CSELK:SLTL.N0000
SLT
With the investor interest shifted to SLT.N the share price has broke out the trend line in both candle stick chart and also in RSI indicator.
CALT.N - CAPITAL ALLIANCE PLCDisclaimer: This chart and analysis are not meant to be, and do not constitute, financial, investment, trading, or other types of advice or recommendations. Do your own due diligence before trading or investing in any stock exchanges, Indices, Stocks, Forex, Crypto etc.
CSELK:CALT.N0000
CALT
In the weekly chart share price is taking a support at level 33.80 and 34.40 .
As per the stage analysis method the price is still in stage 2 and showing no signs for MA 30 flattening out.
CALT
In the daily chart we can see a round bottom pattern and the price has maintained above the neck line.
The share volume traded in daily basis looks good while RSI will enter the over bought territory.
SAMP.N - SAMPATH BANK PLCDisclaimer: This chart and analysis are not meant to be, and do not constitute, financial, investment, trading, or other types of advice or recommendations. Do your own due diligence before trading or investing in any stock exchanges, Indices, Stocks, Forex, Crypto etc.
CSELK:SAMP.N0000
SAMP
The weekly chart created a CnH pattern. Additionally if used the stage analysis method it is in early stage 2.
It has broken the upper level of the handle with a massive 12 million volume.
The MACD is looking positive while the MACD line is showing a sharp upward direction.
LOFC.N - LOLC FINANCE PLCDisclaimer: This chart and analysis are not meant to be, and do not constitute, financial, investment, trading, or other types of advice or recommendations. Do your own due diligence before trading or investing in any stock exchanges, Indices, Stocks, Forex, Crypto etc.
CSELK:LOFC.N0000
LOFC
After making a HL on 7 th June the shape price took a sharp upward movement and crated a HH which also cause to produce some profit booking opportunities.
On the last trading day the share price tested the support at 5.30 - 5.60 zone but manage to close above it.
The descending trendline is in a confluence in this support zone.
RSI took a cooldown while MACD is also slightly curved down.
CALT.N - CAPITAL ALLIANCE PLCDisclaimer: This chart and analysis are not meant to be, and do not constitute, financial, investment, trading, or other types of advice or recommendations. Do your own due diligence before trading or investing in any stock exchanges, Indices, Stocks, Forex, Crypto etc.
CSELK:CALT.N0000
CALT
Share price is taking a support at level 33.80 and 34.40 .
Both the MA 20,50 in daily charts are inclined while MA 20 is sharply inclined.
RSI has dipped and might be looking for a cool down with the profit taking.
GLAS1. During the previous run to ATH it happened in 4 phases with % reducing.
This time first three phases happened with marginal reduce in %
2. Last time when 52 week high was broken the following week went up by 30%
3. When the previous channel was attempted to breakout, it got rejected and ended up breaking down. After the most recent attempt to breakout channel, it held at midway of channel and moving towards another attempt to BO
4. Moving Averages aligned and turned upwards
5. Trading above Volume Weighted MA
6. Compared to the first impulse, other impulses happened with low volume.
BIL.N - BROWNS INVESTMENTS PLCDisclaimer: This chart and analysis are not meant to be, and do not constitute, financial, investment, trading, or other types of advice or recommendations. Do your own due diligence before trading or investing in any stock exchanges, Indices, Stocks, Forex, Crypto etc.
CSELK:BIL.N0000
BIL closed above the 25 week trendline support and 30 DMA.
FIB 0.786 is current resistance and price is inline with that level.
MACD is looking to move towards the positive side while RSI is also looking good.
LOFC.N - LOLC FINANCE PLCCSELK:LOFC.N0000
Disclaimer: This chart and analysis are not meant to be, and do not constitute, financial, investment, trading, or other types of advice or recommendations. Do your own due diligence before trading or investing in any stock exchanges, Indices, Stocks, Forex, Crypto etc.
LOFC
After a continuous decline from its support zone share price to a turnaround. The volume traded in last 2 market days were above the average.
Share price touched the resistance zone 5.40-5.60 and closed below Daily MA 30.
Resistance zone 5.40-5.60 , DMA 50 and trend resistance line seems to be getting in to a confluence.
BRWN.N - BROWN & COMPANY PLCCSELK:BRWN.N0000
Disclaimer: This chart and analysis are not meant to be, and do not constitute, financial, investment, trading, or other types of advice or recommendations. Do your own due diligence before trading or investing in any stock exchanges, Indices, Stocks, Forex, Crypto etc.
BRWN
Bounced from FIB level 0.786 area. There was bullish divergence in RSI and MACD indicators.
MA 30 is showing resistance and next resistance zone might be the golden pocket area.
BIL.N - BROWNS INVESTMENTS PLCCSELK:BIL.N0000
Disclaimer: This chart and analysis are not meant to be, and do not constitute, financial, investment, trading, or other types of advice or recommendations. Do your own due diligence before trading or investing in any stock exchanges, Indices, Stocks, Forex, Crypto etc.
BIL has broke its falling wedge upper trend line.
Also there was bullish divergence no we can assume that it has been validated.
It touched the resistance line created by the supporting trend line of 52 week low. and closed on it.
Overall volume wise there need to be more improvement.
Rs 53.80 to put buyers back in controlWhilst the long term trend remains very much in favor of the buyers, traders should be looking to buy strength as prices have a successful move through the AVWAP from the most recent high.
Right now, prices seem to be building up for another leg higher but our jobs is not to speculate but rather react as the market gives us good probability signals. Clearing 53.80 would put the buyers back in control and likely see prices retest the 57 - 58 area. Breaching through this would likely see a move towards the mid 65 - 67 range.
Watch out for the AVWAP from the recent highs!With solid fundamentals backing the current move in GLAS, this could just be the early phase of the uptrend. The AVWAP from the current highs is around Rs 21.10 - Buyers need to keep an eye on this level. Closing above this on high volume would likely put the buyers back in control and initiate a strong upside move.
Right now, the stock is trading above a rising 50 and 200 day MA meaning that both the medium and long term trend is very much favoring the buyers.