PACK | Testing Anchored VWAPThe stock has created a bearish divergence on the relative strength index (RSI) by failing to break above anchored volume-weighted average price (VWAP) and Fibonacci retracement levels around Rs. 16.70 twice.
The stock cannot be considered bullish unless the previous higher high and anchored VWAP resistance levels are broken.
Disclaimer: This chart and analysis are not meant to be, and do not constitute, financial, investment, trading, or other types of advice or recommendations. Do your own due diligence before trading or investing in this stock.
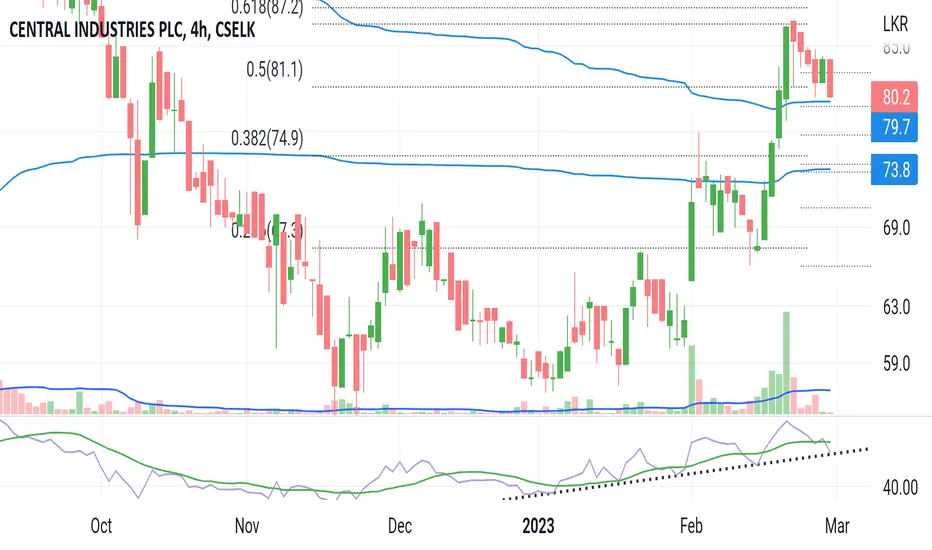
HAYLThe stock has encountered resistance around the 200-day moving average and the expanding triangle pattern top. With the formation of a lower high, it is safer to set the stop-loss below the previous higher low of Rs. 73.90.
A cup and handle pattern will be created If the stock manages to break above the previous higher high of Rs. 78.90.
Disclaimer: This chart and analysis are not meant to be, and do not constitute, financial, investment, trading, or other types of advice or recommendations. Do your own due diligence before trading or investing in this stock.
EXPO - being shipwrecked?EXPO once a major index moving counter has lost a major support (170) is heading towards its next support levels (yellow fib lines)
i have used multiple fib charts to get a more accurate setup. golden pocket can be seen around 149-152 range where more buyers will rally to buy.
RSI seemed to have retested and crashed before price action came in.
EShort
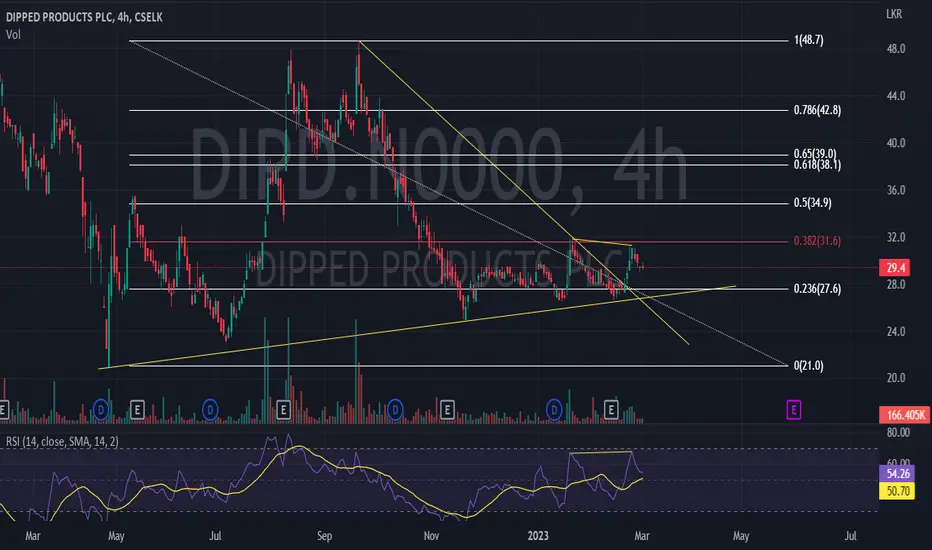
VONEThe stock has been encountering resistance near the descending trendline and there may be a possible inverted head and shoulder pattern forming. As this pattern formation is still uncertain, it's best to monitor the stock closely and consider setting the stop-loss below the recent higher low of 33 rupees to limit potential losses.
Disclaimer: This chart and analysis are not meant to be, and do not constitute, financial, investment, trading, or other types of advice or recommendations. Do your own due diligence before trading or investing in this stock.
CHOTWith the stock moving above the descending trendline and breaking out of the horizontal price channel at Rs. 17.70 with above-average volumes, there is a high possibility of gaining momentum towards the Fibonacci retracement level of 0.5 at Rs. 19.50 levels.
Disclaimer: This chart and analysis are not meant to be, and do not constitute, financial, investment, trading, or other types of advice or recommendations. Do your own due diligence before trading or investing in this stock.
CTC | Stage 1 BaseThe stock has formed a stage 1 base after a long stage 4 downtrend. If the stock manages to break above the ascending triangle pattern at the 674 level, it may move towards the 781 levels to potentially retest the long-term descending trendline.
Disclaimer: This chart and analysis are not meant to be, and do not constitute, financial, investment, trading, or other types of advice or recommendations. Do your own due diligence before trading or investing in this stock.
BFL | At the Edge of ResistanceBased on the formation of a bullish divergence on the Relative Strength Index (RSI) and the price moving along the edge of the descending trendline, the stock may be indicating a reversal to the upside.
To manage risk, it is best to wait for a breakout above the previous lower high level of Rs. 145 before taking a long position and if deciding to enter at these levels the stop-loss should go below Rs. 136 since failure to stay above these levels indicating a bearish continuation.
Disclaimer: This chart and analysis are not meant to be, and do not constitute, financial, investment, trading, or other types of advice or recommendations. Do your own due diligence before trading or investing in this stock.
SHOT | Filling the GapThe stock has broken out of the ascending triangle pattern at the 8.90 level to fill the exhaustion gap made on 12/12/2022. With the high volumes being traded, it is possible that it may fill the gap entirely up to the 10.40 levels.
Disclaimer: This chart and analysis are not meant to be, and do not constitute, financial, investment, trading, or other types of advice or recommendations. Do your own due diligence before trading or investing in this stock.
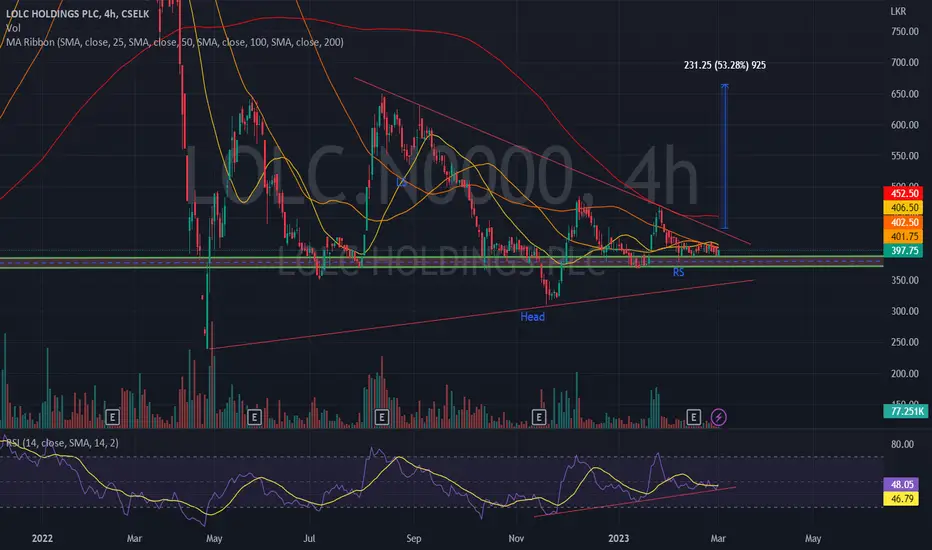
LOL SeeCounter everyone laughing up on and beaten down is now trying to find support around 380-400 zone. Prices are below moving average ribbon, being consolidated within a symmetrical triangle. If the given trendline resistance broken, counter might complete an inverse HNS pattern, and likely to break up!
SCAP | Unworthy RiskBy breaking the previous higher low to the downside, the stock has the potential to fill the long wick and reach the 9.30 level. If those levels are also broken, it may try to find support around the he 200-day moving average.
Without the creation of a higher high, the stock may carry risk for traders who are uncertain where to set their stop-loss.
LOLCA close above Ascending triangle at 410 will indicate a bullish continuation in the short-term while taking the price towards the resistance level of the Symmetrical triangle pattern. A close below the Ascending Trendline may indicate a bearish reversal.
Disclaimer: Please conduct your own research before making any investment decisions and note that this is not investment advice.
AAICBy breaking the previous lower low to the downside, the stock could fill the long wick and reach the 85.5 level. If those levels are also broken, it may try to find support around the Fibonacci 1.618 level and the 200-day moving average of 69.5 levels while potentially creating a Head and Shoulders pattern.
Without the creation of a higher high, the stock may carry risk for traders who are uncertain where to set their stop-loss.