hSenid Business Solutions PLC : HBS.N0000 : CSEOverview
HBS is an application software development company mainly catering to HR segment.
Strategy
A trade based on technical analysis.
Technical Analysis (Chart Patterns)
* HBS had created a bottom with a triple divergence.
* Friday 11th April HBS broke out from the Descending Wedge formation with good volume.
Potential Pattern Targets
* Pattern Target : LKR 12.60 (> 14% upside)
* If price sustained above UC line we can aim for higher targets towards LKR 16/17 area.
Invalid
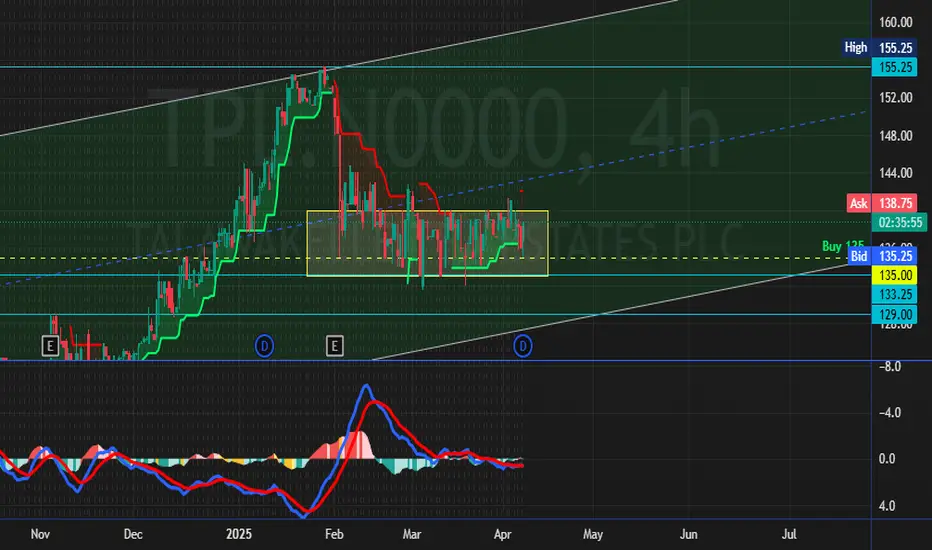
TPL.NDisclaimer;
The information provided on this website does not constitute investment advice, financial advice, trading advice, or any other advice, and you should not treat any of the website’s content as such. We do not recommend buying, selling, or holding any stock. Nothing on this website should be taken as an offer to buy, sell or hold a stock. Conduct your due diligence and consult your financial advisor before making investment decisions.
I do not accept any responsibility and will not
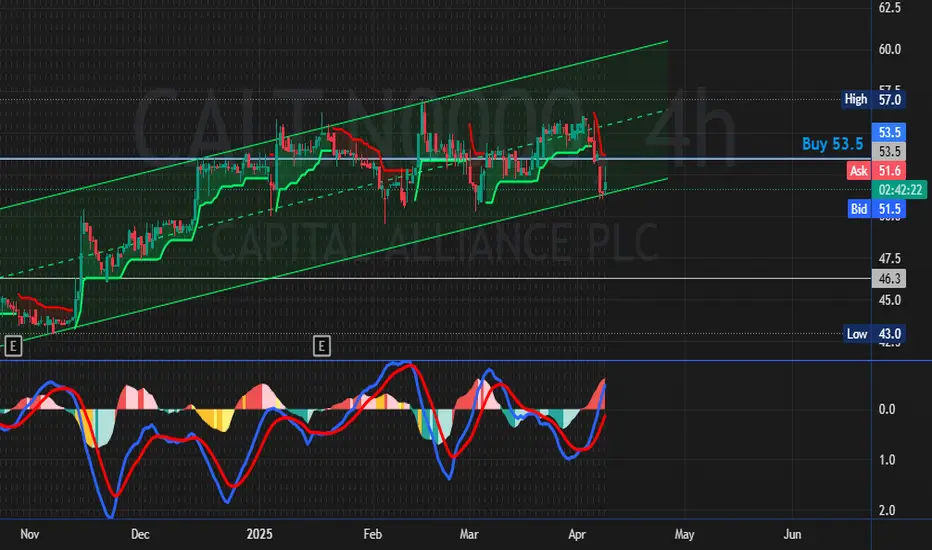
CALT.NDisclaimer;
The information provided on this website does not constitute investment advice, financial advice, trading advice, or any other advice, and you should not treat any of the website’s content as such. We do not recommend buying, selling, or holding any stock. Nothing on this website should be taken as an offer to buy, sell or hold a stock. Conduct your due diligence and consult your financial advisor before making investment decisions.
I do not accept any responsibility and will not
SAMP.NDisclaimer;
The information provided on this website does not constitute investment advice, financial advice, trading advice, or any other advice, and you should not treat any of the website’s content as such. We do not recommend buying, selling, or holding any stock. Nothing on this website should be taken as an offer to buy, sell or hold a stock. Conduct your due diligence and consult your financial advisor before making investment decisions.
I do not accept any responsibility and will not
MGT.NDisclaimer;
The information provided on this website does not constitute investment advice, financial advice, trading advice, or any other advice, and you should not treat any of the website’s content as such. We do not recommend that any stock should be bought, sold, or held by you. Nothing on this website should be taken as an offer to buy, sell or hold a stock. Conduct your due diligence and consult your financial advisor before making any investment decision.
I do not accept any responsib
JINS.N0000 Janashakthi Insurance - Cup & Handle BOBreaking 46 will make a C&H Break Out.
Dividend Pending
* Amount > LKR 5 (JINS can distribute tax free dividend received from CFVF.N0000)
Profit Expectations
* Earnings should be good.
* Majority of BOND portfolio is classified under 'Financial Assets at Fair Value Through Profit
or Loss'. Hence capital gains due to rate cuts will reflect in P&L.
NAV
* LKR 60.64 / PBV 0.75 (All other life insurance companies in CSE are trading above NAV.)
HELA APPAREL HOLDINGS - HELA.N0000 (CSE/Colombo Stock Exchange)Strategy
Expected recovery in Garment & Textiles Industry & HELA's 180-degree turnaround strategy implementation
- Cost Reductions
- Capacity optimization (maintaining demand base capacity)
- Benefits from acquiring of Focus Brands Limited
Historical Facts
* IPO Price - LKR 15.00
* IPO Debut price - LKR 22.00
* HELA got affected from garment industry crisis during CY 2023 (Supply Glut)
* 52 Week High/Low LKR 8.60/LKR 4.80
Technical Analysis (Chart Patterns)
* If HELA managed to cro
LFIN.NThe information and analysis provided in this publication are for educational purposes only and should not be construed as financial advice or recommendations to buy, sell, or hold any securities. The author and Trading View are not responsible for any investment decisions made based on the content presented herein.
Always do the own research on stock market before making any investment decisions.
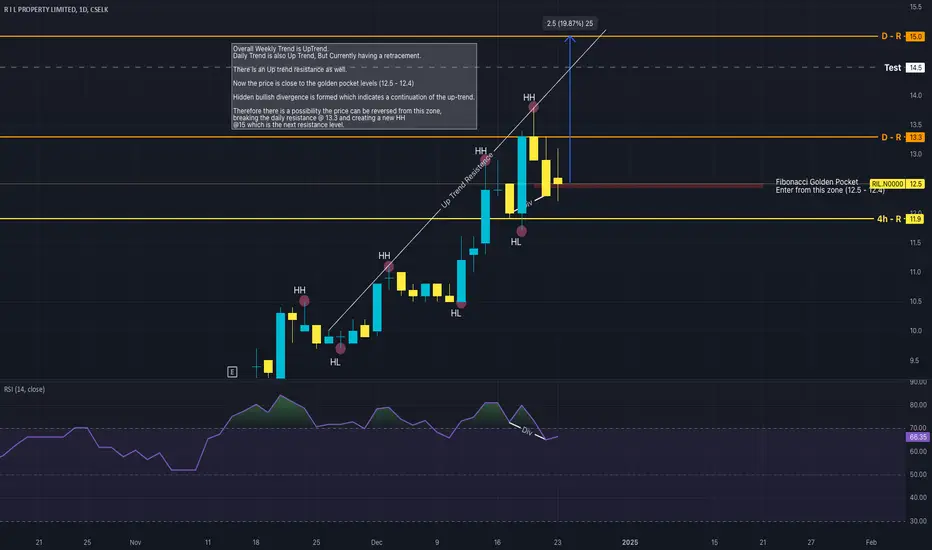
RIL Prediction (2024 Dec 24) - RetracementNot a BHS recommendation. Just Sharing my idea.
CSELK:RIL.N0000 - The overall weekly trend is uptrend.
Timeframe - Daily
Higher High is formed @13.80 and Retracement is already happening
Possible reversal between 12.5-12.4 (From the highlighted red box)
Confirmations for the reversal:
Close to Fibonacci golden pocket
Hidden bullish divergence is formed
Fundamentals:
NAV is according to the latest financial statement (2024 Sept quarter) is 25.52. So PBV is below 1.
RIL has 51% owner
PLC.N0000 - Long term viewWait for pullback to 7 to 9
Disclaimer: The information and analysis provided in this publication are for educational purposes only and should not be construed as financial advice or recommendations to buy, sell, or hold any securities. The author and TradingView are not responsible for any investment decisions made based on the content presented herein. Always consult a financial professional before making any investment decisions.
PARQ - The LeaderThis is not an advice. Purely a personal opinion.
CSELK:PARQ.N0000
In the Stage Analysis method, the Advancing stage occurs when the stock breaks free from the Base and 30-week moving average.
The price of CALT moved up rapidly after breaking out the Base from the 30-week moving average.
After the breakout, it increased its advancement by a staggering 677%.
Similarly, PARQ is in its advancing phase and is backed by strong fundamentals.
It has only gained 165% gain from its breakout.
LIOC.N00001. Key Technical Observations:
Price Breakout:
The stock has broken above a critical resistance level at 122 LKR (DR). This breakout indicates strong bullish momentum in the short term.
Trendline Resistance:
The stock is currently testing the descending trendline resistance (black diagonal line). A clear breakout above this trendline with volume confirmation could trigger a move toward higher levels.
Support and Resistance Levels:
Immediate Resistance: 124.50 LKR (current level) – needs a dail
AEL Prediction (2024 Dec 11) - Retracement Not a BHS recommendation. Just Sharing my idea.
CSELK:AEL.N0000 - The overall trend is uptrend.
TimeFrame - Daily
Higher High is formed @31.80 and Retracement is already happening
Possible reversal @29.80 (From the highlighted green box)
Confirmations for the reversal -
Fibonacci levels (0.66 and 0.618)
The Previous Up-Trend Resistance has now become a Resistance
Hidden Regular Divergence is possible which is a Trend Continuation Divergence
Expecting Reach the Price to 35 whic
AEL.N Prediction (2024 Dec 04)Not a BHS recommendation. Just Sharing my idea.
CSELK:AEL.N0000 - The overall trend is uptrend.
TimeFrame - Daily
Confirmations for a pullback:
The Up Trend Resistance Line is touching the wick. In previous instances, when the trendline touched the wicks, the price respected and reacted to the line.
There is a daily resistance at 29
Possibility of forming a Regular Bearish Divergence, Hence price drop.
What could be the next level to be bounced back? There are a few confirmations.
BERU.N WeeklyThis chart and analysis are not financial advice. Do your own research before trading or investing.
CSELK:BERU.N0000
Trend and Structure Analysis:
The price has been in a strong uptrend after a long accumulation phase near the support zone of 0.80–1.50, breaking into a higher range.
Currently, the price is consolidating just below the 3.20 resistance, suggesting a potential breakout if the buying pressure continues.
Support and Resistance Zones: Support Levels:
2.40–2.60: A crucial s