TKYO.N BEARISH PROJECTIONThe stock established a strong uptrend from June 2025, defined by the solid Trend Line which acted as dynamic support. This uptrend led the price to challenge and briefly break above the significant Resistance zone around LKR 91.5 - LKR 94.0 in October.
Current Technical Status
The key development is the recent breakdown of the ascending Trend Line, which the chart labels as a "Bearish Breakout."
Failed Breakout: The move above the LKR 91.5 - LKR 94.0 Resistance zone proved to be unsustainable, resulting in a false breakout (or bull trap). The price rapidly moved back into the previous trading range and then decisively fell through the major uptrend line.
Breakdown Confirmation: The current price of LKR 87.0 is now trading below the broken Trend Line, confirming the loss of short-term upward momentum and a shift in market control to the sellers.
Projection
The immediate technical bias is bearish, following the failed breakout at the top and the confirmed breakdown of the uptrend line.
The most likely projection is a continued decline towards the next major support level, which is the "Key Level" zone around LKR 78.5 - LKR 81.5. This zone previously acted as strong resistance through the first half of 2025 before the breakout in August and is now expected to provide significant support.
Should the LKR 78.5 - LKR 81.5 Key Level fail to hold, it would indicate a substantial reversal of the 2025 uptrend and suggest a deeper correction. However, the initial target for the current bearish movement is clearly the Key Level zone.
Would you like me to search for any recent construction sector news or company-specific updates that could be influencing the recent price action of Tokyo Cement? That's an excellent follow-up question. Analyzing the fundamentals alongside the technical breakdown provides a much clearer picture.
The recent news search reveals a contradiction between the overall positive fundamental outlook for the sector and the current bearish technical price action.
Fundamental Context (Bullish)
Construction Sector Rebounding: Recent Purchasing Managers' Index (PMI) data shows strong expansion in Sri Lanka's construction sector, with the September 2025 PMI (67.6) marking the strongest increase since late 2021 and new orders/project availability increasing significantly, particularly in road rehabilitation.
Company Performance: Tokyo Cement reported a solid Q2 FY25/26 (ending Sept 2025) with a turnover of LKR 16.322 billion, up from LKR 13.833 billion YoY. The construction sector is noted as having a "sustained boom," with September recording the highest cement sales volumes since the 2022 economic crisis.
Outlook: The outlook is positive, citing sustained growth momentum due to low interest rates, a stable currency, subdued inflation, and government investment in infrastructure and housing (like the Urban Regeneration Programme).
Technical vs. Fundamental Synthesis
The technical analysis shows a Bearish Breakdown (failed breakout at LKR 94.0, confirmed loss of the uptrend line), projecting a decline to the LKR 78.5 - LKR 81.5 Key Level.
The fundamental news, however, indicates a Strong Bullish Sector Recovery coinciding with the period the price was near its highs (June to October 2025). The short-term bearish technical move is therefore likely not a result of a fundamental collapse, but rather:
Profit-Taking/Distribution: Investors who bought earlier in the year are taking profits after the stock successfully ran up in anticipation of the improving sector results, leading to the failed breakout (bull trap) and sharp correction.
Margin Contraction: Tokyo Cement's Q2 Profit After Tax (PAT) of LKR 1,003 million was slightly lower than the previous year (LKR 1,082 million), despite higher revenue. The company noted that profit margins contracted due to the capitalization of its Trincomalee expansion projects. This might be the specific fundamental trigger for the selling pressure seen in late October/early November, as investors react to the slight drop in profitability amidst increasing volume.
Revised Projection (Integrated View)
The technical projection remains a decline to the LKR 78.5 - LKR 81.5 Key Level. However, given the robust fundamental backdrop (strong sector growth and record sales volumes), this drop is likely a buying opportunity rather than the start of a deep bear market.
The LKR 78.5 - LKR 81.5 zone is a high-probability reversal area where the technical support aligns with the strong long-term fundamental recovery story. A bounce is expected from this level as value investors and long-term traders look to enter based on the positive sector outlook.  Short
Short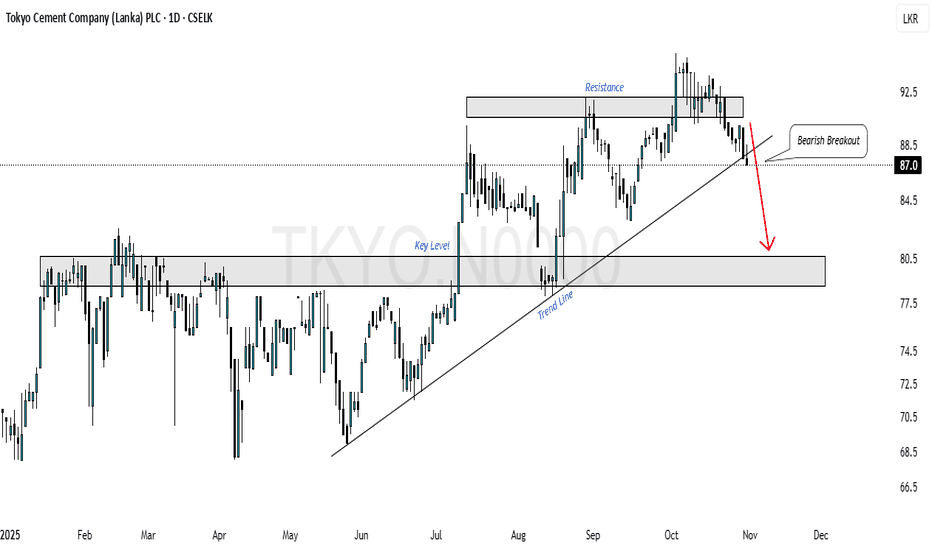
ALUM.N PULLBACK ON TOPThe stock is in a clear long-term uptrend starting from mid-2022, defined by the major ascending trendline. Since early 2024, the price action has accelerated within a tighter ascending channel (dashed lines).
The key technical development is the recent interaction with the long-term Resistance zone established in early 2022, located between approximately LKR 17.0 and LKR 18.5. The stock successfully broke above this significant resistance zone in mid-2025 and is currently trading above it. This breakout from a multi-year consolidation pattern is a strong bullish signal.
Current Price Action and Support
The current price of LKR 20.2 is showing signs of a potential pullback after testing the upper boundary of the tighter ascending channel. The most recent weekly candle closed lower, indicating short-term selling pressure.
Immediate Support: The primary and most critical support level is the recently broken Resistance zone (LKR 17.0 - LKR 18.5), which is now expected to act as a strong support (a principle known as "role reversal").
Dynamic Support: The lower trendline of the tighter ascending channel also offers dynamic support just above this horizontal zone.
Projection
The overall technical structure is bullish, driven by the multi-year uptrend and the breakout above the major 2022 resistance.
The most likely projection is a bullish continuation. The current short-term weakness is likely a healthy retest of the broken resistance zone (LKR 17.0 - LKR 18.5). If the price holds above this level, it confirms the breakout, and the stock is projected to resume its uptrend, targeting new highs. The immediate long-term target, based on the height of the previous consolidation, could project towards the LKR 25.0 - LKR 26.0 area.
A significant weekly close below the former resistance zone of LKR 17.0 would invalidate the strong bullish structure and suggest a deeper correction toward the long-term major trendline (currently near LKR 15.0). However, the current momentum and structure favor the upside.  Short
Short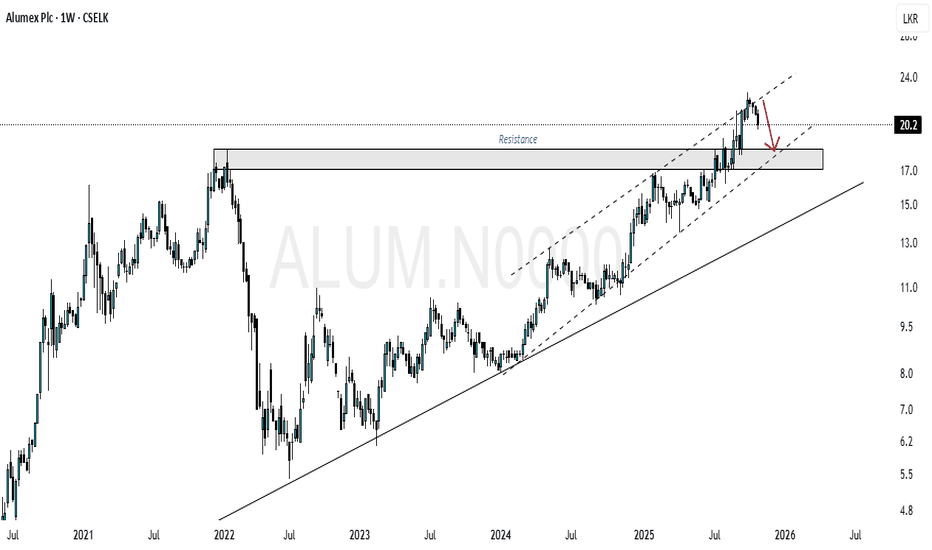
JKH.N RISING WEDGE The stock has been trading within a Rising Wedge pattern since late 2019/early 2020. This pattern is generally considered a bearish reversal pattern, suggesting that a decisive break below the lower trendline could lead to a significant downtrend.
The price has recently been testing the lower trendline of the Rising Wedge. The current weekly candle, as circled, is right at this critical support line, indicating an immediate inflection point. The stock closed the week at LKR 21.1, down 1.40%.
Key Levels and Support
The primary support in the near term is the lower trendline of the wedge.
Breakdown Scenario: A definitive weekly close below the lower trendline would confirm the breakdown of the Rising Wedge pattern. The next significant support would be the horizontal "Key Level" zone around LKR 17.0 - LKR 17.8. A break below this key zone would then target the subsequent long-term "Support" zone around LKR 13.0 - LKR 13.5.
Reversal/Continuation Scenario: If the lower trendline holds, the price could bounce back towards the upper trendline of the wedge, which is currently near the LKR 25.0 - LKR 26.0 area.
Projection
The technical structure strongly suggests a bearish projection given the nature of the Rising Wedge pattern and the price's current position right at the critical support.
The most likely projection is a breakdown below the lower trendline, leading to a move towards the LKR 17.0 - LKR 17.8 Key Level support zone. This breakdown would signal the end of the multi-year bullish consolidation represented by the wedge. Traders should look for confirmation via a decisive close below the trendline on the weekly timeframe. If the price manages to hold this line, the alternative projection would be a rally back toward the wedge's high LKR 25.0s, but the immediate technical bias favors the downside.  Short
Short
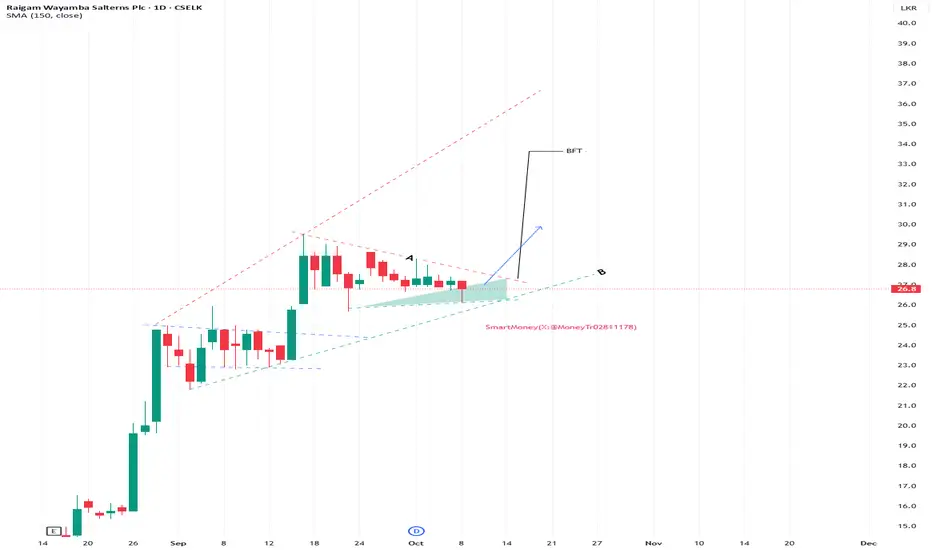
MT/LT prospects for RWSL : RECORD SALT HARVEST to drive earningsPrevious Discussions
A. Short term TA outlook (8th Oct. 2025)
B. Longterm outlook (17th April 2024)
RWSL gave a 4X return since 17th April 2024 discussion.
Revisit of 2024 Bull Thesis
The original 2024 bull thesis was anchored on expectations of dry weather following several years of adverse conditions in Sri Lanka’s salt-producing regions. The assumption was that a bumper harvest would boost topline and gross profit (GP) margins for RWSL, the largest private salt producer in the country.
However, this thesis did not materialize. Sri Lanka experienced another unexpectedly wet year, leading to a complete inventory dry-out by March 2025—especially among state-owned salt companies.
Unexpected Upside: Import-Led EPS Surge
This scarcity created a strategic opening for RWSL, which became the preferred salt importer for the government.
Key drivers of performance:
• Salt prices surged due to scarcity and a newly imposed LKR 60.00 import levy.
• Despite lower GP margins on imported salt, higher prices and volumes drove a 5X EPS increase
• LKR 0.14 in Dec 2024
• LKR 0.79 in March 2025
• LKR 0.76 in June 2025
RWSL shares rallied 4X in response to this earnings momentum.
• As per June 2025 financials, RWSL’s imported salt inventory will last through September/October 2025.
• EPS is expected to remain in line with March and June 2025 levels for the Sep. 2025 quarter.
Weather Shift: Record Harvest in Puttalam
The dry weather anticipated in the original 2024 thesis has finally arrived. Salt producers expect the 2025 Maha season harvest in Puttalam to exceed 100,000 MT— the highest in five years.
Earnings Implications
• Locally produced salt avoids the LKR 60.00 import levy and other import-related costs.
• With no public pressure to reduce retail prices, prices are expected to remain elevated.
• Once imported inventory is exhausted, RWSL’s GP margins will expand significantly, driving higher profitability and providing strong tailwinds for share price appreciation.
Strategic Opportunities
Note: The below strategic outlook is speculative and based solely on the author’s analysis. There is no known insider information or confirmation regarding PPP or acquisition discussions involving RWSL.
1. State Sector Privatization / PPP Opportunities
• Sri Lanka is moving toward liberalizing state enterprises, regardless of political party in power as happened in India post 1991.
• The government has already signaled interest in PPPs (e.g., Sevenagala Sugar Industries).
• State salt companies may follow suit.
RWSL’s strategic position:
• Largest private salt producer in the country
• Only domestic producer capable of PVD salt (high-grade industrial salt)
• Debt-free, with expected LKR 2 billion+ free cash by end of FY 2025
• Holds 10–15% market share, while state firms control about 75%
• Successful PPP participation could multiply RWSL’s scale significantly
2. Acquisition Target Potential
• RWSL is passively managed, with a self-described “risk-averse” approach.
• Historically, the company has not pursued aggressive expansion or meaningful
diversification.
• However, recent performance and assets make it attractive:
3X topline growth
Strong GP margins
Potential PPP opportunities
500+ acres of land, much of it near existing wind power infrastructure
• RWSL may come under the radar for a strategic acquisition by a more ambitious growth-oriented investor
 Long
Long
Long 
 Short
Short
 Long
Long
 Short
Short
 Long
Long
 Short
Short
 Long
Long
 Long
Long
Long 
Short 
 Short
Short
 Long
Long
 Long
Long