LMF Weekly- UpdateThis chart and analysis are not financial advice. Do your own research before trading or investing.
CSELK:LMF.N0000
H&S Pattern Breakdown
The H&S pattern consisted of a left shoulder, head, and right shoulder. The neckline appears around the support zone of 30-31 LKR. The recent bullish move with a significant breakout suggests that the H&S pattern failed to complete a bearish outcome, as prices moved upward instead of reversing lower.
Volume Spike
The breakout is accompanied by a notable volume spike, indicating strong buying interest. This volume surge validates the upward move, as high volume on a breakout can suggest sustained interest and potential follow-through.
Based on stage analysis, this stock appears to be maintaining it's stage 2 characteristics even though it broke the 30 WMA couple of weeks back.
Bullish Scenario
If the bullish momentum continues, the stock could aim for the resistance zones at 34-35 LKR and, subsequently, 38-39 LKR.
Continued support above the MA 30 line would strengthen the bull case, suggesting a move toward higher levels if buying pressure persists.
Bearish Scenario
If the price fails to hold above the 30-31 LKR support level, it may re-test the 24-26 LKR support zone.
A decline below the MA 30 and a break back below 30 LKR could indicate weakness and possibly a return to Stage 1 (Accumulation) or even a Stage 4 (Declining) if selling pressure intensifies.
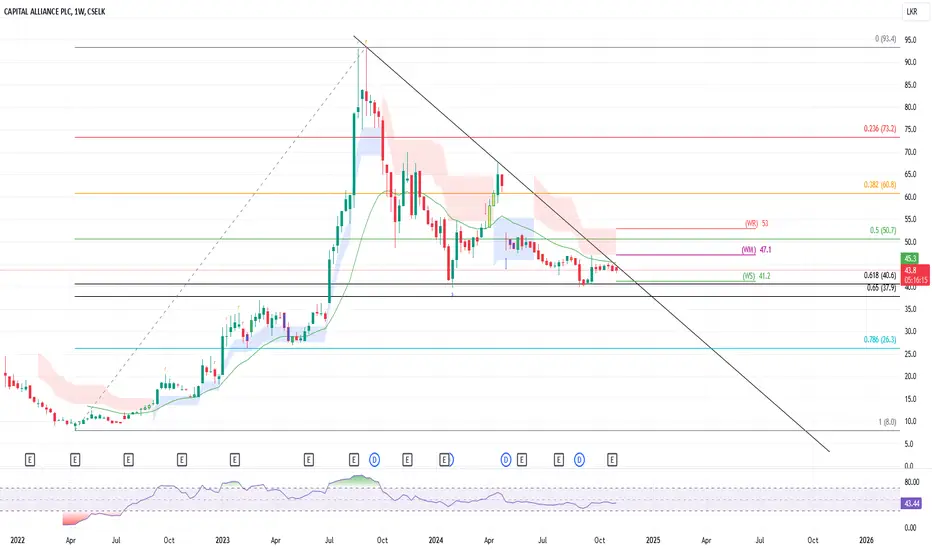
CALT.N0000 - Weekly Chart UpdateThe Fibonacci retracement levels are plotted based on the all-time high and low values, providing insight into potential support and resistance zones.
The key Fibonacci levels observed on this chart are :
0.236 Level: Around 73.2, which could act as a significant resistance if the stock starts moving up from the current levels.
0.382 Level: Around 60.8, another potential resistance.
0.5 Level: Around 50.7, often considered a pivotal level in retracement analysis.
0.618 Level (Golden Pocket): Around 40.6, which is a critical level and can act as strong support if the price approaches it from above.
Current Price and 21-Week Moving Average (Green Line) :
The price is currently around 43.8, slightly above the 0.618 Fibonacci level (40.6), suggesting the price is in a critical area.
The 21-week moving average (green line) is also near the current price level. This moving average could act as dynamic support if the price remains above it. If it breaks below, it may signal further downside risk.
Descending Trendline Resistance :
The chart shows a strong descending trendline that has been respected multiple times as resistance. The stock would need to break above this trendline to confirm a reversal or more significant bullish momentum.
Support and Resistance Levels :
Immediate Resistance: Around 47.1 (Weekly Mid Resistance) and 53 (Weekly Resistance).
Support Levels: The 0.618 Fibonacci level at 40.6 and the 0.786 level around 26.3 are key support areas. If the price falls below 40.6, the next significant support zone would be around 26.3.
Relative Strength Index (RSI) :
The RSI appears to be in a lower range, which could imply oversold conditions on the weekly chart. This may provide some support for the price, but a confirmed upward trend would still depend on breaking key resistance levels.
Summary:
The stock is in a consolidation phase near critical Fibonacci and moving average levels.
A break above 47.1 and ultimately above the descending trendline could signal the beginning of a potential reversal.
However, if the price falls below the 0.618 level (40.6), there may be a further downside risk, with 26.3 acting as the next major support.
The 21-week MA and the 0.618 level are crucial for maintaining the current consolidation or an upward move, so keeping an eye on these levels is essential.
Disclaimer : The information and analysis provided in this publication are for educational purposes only and should not be construed as financial advice or recommendations to buy, sell, or hold any securities. The author and TradingView are not responsible for any investment decisions made based on the content presented herein. Always consult a financial professional before making any investment decisions. PARQ.N DailyThis chart and analysis are not financial advice. Do your own research before trading or investing.
CSELK:PARQ.N0000
What's happening in PARQ?
Fundamental Analysis:
PARQ (SwissTec Ceylon PLC) reported exceptional year-over-year (YoY) growth in Q2 of 2024, attributed to strong performance in specific segments:
Tile Mortar and Grout Segment: Consistently delivered growth in turnover and profits, showing resilience and stability.
Aluminum Segment: This segment had a substantial positive impact on quarterly and annual growth in turnover and profit. This could be due to increased demand or strategic improvements.
Given the favorable construction sector trajectory, the company’s prospects look optimistic for Q3 and Q4.
Additionally, PARQ’s dividend-paying history suggests investors may see an attractive dividend in early 2025.
Technical Analysis:
Price Action: The stock appears to be in a strong uptrend, pushing against a key resistance level around LKR 29.50. If it breaks above this level, further upside could be expected, though it might face resistance at the next Fibonacci levels.
Support Levels: There are two notable support zones: Near LKR 27.00 - 27.50, a recent consolidation zone.
Between LKR 25.00 - 26.00, which aligns with a significant Fibonacci retracement level (50%).
Moving Averages: The 30-day moving average (DMA 30) (yellow line) trends upwards, indicating short-term bullish momentum. This can act as dynamic support if the price pulls back.
Volume: Higher volume in recent upswings suggests buyer strength and institutional interest in this stock.
RSI (Relative Strength Index):
The RSI is hovering around 75.93, indicating an overbought condition. While this reflects strong momentum, it may also hint at a potential pullback or consolidation in the near term.
Summary:
Given the combination of strong fundamentals and technical indicators:
Bullish Scenario: A breakout above LKR 29.50 could signal a continuation of the uptrend. Investors could consider this a buying opportunity, though mindful of overbought RSI.
Bearish Scenario: If the stock fails to break above LKR 29.50, a retracement to the support zones around LKR 27.00 - 27.50 or LKR 25.00 - 26.00 could present potential entry points for those looking to enter at a lower price.
 Long
Long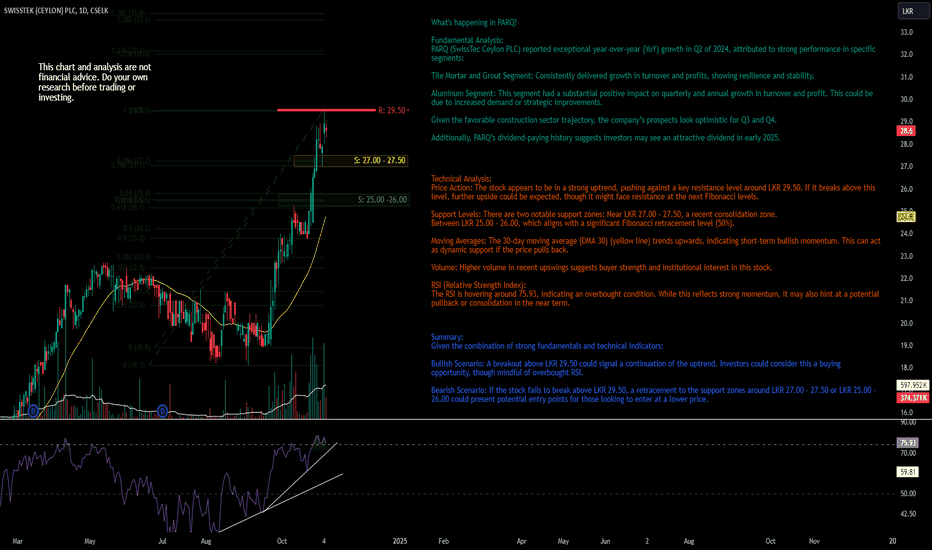
 Long
Long
LMF.N Weekly chartThis chart and analysis are not financial advice. Do your own research before trading or investing.
$CSELK: LMF.N0000
Moving Averages:
30-week Moving Average (MA 30): The yellow line represents the 30-week moving average, a key trend indicator.
The price is close to this moving average, which slows upward but seems flattening. This indicates a potential shift in trend as the price consolidates after a strong upward move.
Stage Analysis: Stage 2 (Advancing Phase):
The stock experienced a strong upward trend, reflected by the steep rise in the price and the increasing slope of the 30-week MA earlier in the chart.
The price has reached a peak near 34.50, which matches the top of the "Head" in the Head & Shoulders pattern. This is a sign that the stock has entered the latter part of Stage 2.
Potential Transition to Stage 3 (Distribution Phase):
The flattening 30-week MA and the formation of the H&S pattern suggest the possibility of a transition from Stage 2 (Advancing) to Stage 3 (Distribution).
Volume is also an important factor, and we can see a decline in volume during the formation of the right shoulder compared to the earlier price rise. This supports the distribution phase idea, where the stock is potentially being sold off after a long run-up.
If the price breaks below the support zone of 24.00 - 26.00 (S: 24.00 - 26.00, marked in green), the H&S pattern will likely be confirmed, and a bearish reversal could follow.
Relative Strength Index (RSI):
The RSI at 61 is still in bullish territory, indicating some upward momentum left. However, if the RSI starts to fall below 50, it would confirm a bearish shift in momentum, further supporting the H&S breakdown.
EDEN.N DailyThis chart and analysis are not financial advice. Do your own research before trading or investing.
Price Trend:
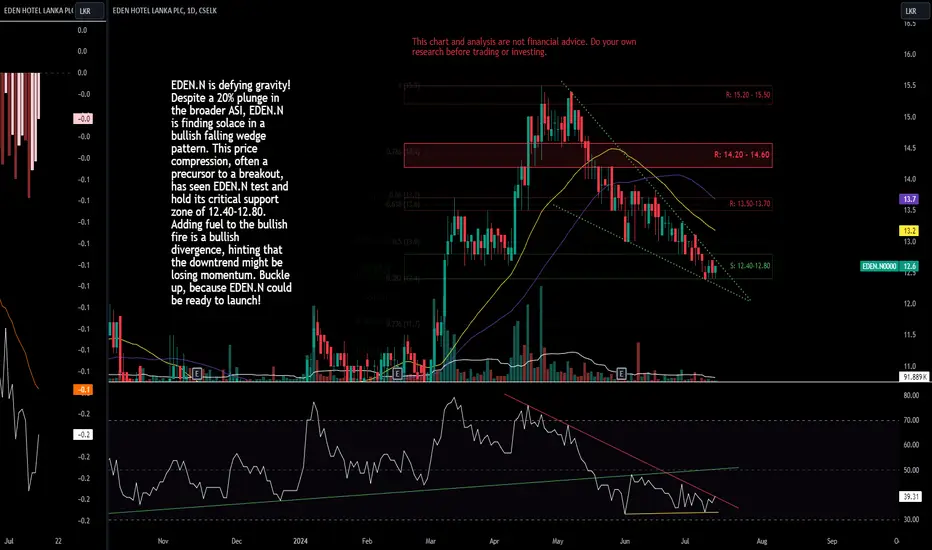
The stock is consolidating within a triangle pattern, which suggests a potential breakout soon. This means that the price is squeezing between two converging lines, and when it breaks out of the pattern, a larger move (either up or down) can be expected
Support and Resistance Levels:
The price fluctuates within the support/resistance zone of LKR 14.20 to 14.60 (highlighted in yellow). These are important levels where the price has historically struggled to move beyond or below.
The chart also shows several Fibonacci levels that indicate possible areas where the stock may face resistance if it moves higher (R: 15.20-15.50 and R: 16.60-17.40) or support if it declines (S: 13.30-13.70).
Moving Average Analysis:
DMA 20 (Yellow Line) is close to the current price, indicating the stock oscillates around its short-term trend. A move above this could suggest a short-term upward move.
DMA 50 (Purple Line) is slightly below the current price, supporting the medium-term bullish (upward) trend.
DMA 200 (Blue Line) is far below the current price, which confirms that the long-term trend is still positive. When the price is above the 200-day moving average, it’s a sign of general strength in the stock.
RSI (Relative Strength Index):
It's around 67.77, which is still under 70, suggesting there's room for more upward movement.
Potential Move:
The triangle pattern suggests a breakout could be imminent. A breakout above the upper resistance line could push the price towards the next target at around LKR 15.20-15.50.
Bullish Scenario: If the stock breaks above LKR 14.60 (the upper side of the triangle), the next targets are LKR 15.20-15.50 and possibly LKR 16.60-17.40. The stock is above its 50-day- and 200-day moving averages, supporting a long-term uptrend.
 Long
Long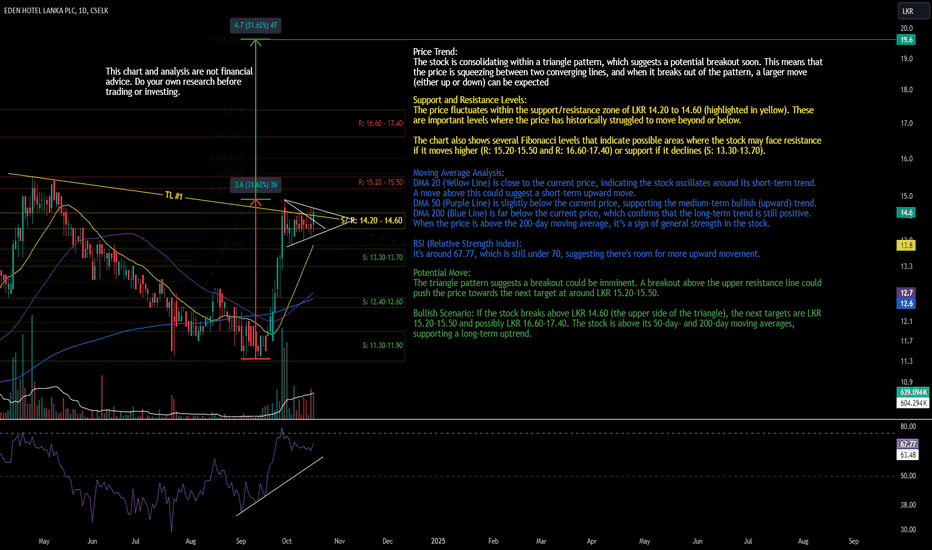
SwissTek (Ceylon) PLC (CSE: PARQ)This chart and analysis are not financial advice. Do your own research before trading or investing.
Bullish Observations:
Price Surge with Momentum: The stock price has risen to 23.20 LKR (+3.57%), showing strong bullish momentum. It has cleared the important 21.40-22.70 resistance zone, turning it into new support, which signals potential for further upward movement.
Upward Breakout: The price has broken above a descending trendline, signaling that the downward pressure has been overcome. Breakouts above trendlines typically mark the start of a new bullish trend.
Golden Cross (Purple 50-day MA): The 50-day moving average (purple) is about to cross over the 200-day moving average (blue), forming a golden cross. This is a classic bullish signal suggesting further upward momentum.
Bullish RSI Divergence: The RSI shows a bullish divergence where the stock made lower lows, but the RSI made higher lows previously. This often indicates building bullish momentum, which has already materialized with the price breakout.
High Volume: The breakout is confirmed by strong trading volume, which suggests that the price rise is supported by market interest. This is another positive indicator of a sustained upward move.
Support Zones: The stock has established solid support levels at 21.40-22.70 and further below at 20.10-20.50. This gives it a strong base for further upward moves, with a potential next target at 24.50-25.00.
Potential Risks:
RSI Overbought: The RSI is currently at 72.03, which indicates the stock is in the overbought zone. This can sometimes lead to a short-term pullback or consolidation before further upward movement.
Resistance Around 24.50-25.00: The stock is approaching a resistance zone around 24.50-25.00. If it struggles to break through this, a retracement toward the newly formed support at 21.40-22.70 may happen.
Volume Concerns: While the breakout volume has been strong, any significant drop in volume could indicate a false breakout or weakening buying interest, which might cause the price to revisit lower support zones. EDEN.N Daily ChartThis chart and analysis are not financial advice. Do your own research before trading or investing.
Bullish Observations:
Strong Price Surge: Recently, the price has surged to 14.5 LKR, up by +7.41%, indicating strong buying momentum. This price action broke above the 13.30-13.70 resistance (marked as S: 13.30-13.70), a bullish signal.
Golden Cross: We see the short-term moving averages (yellow and purple lines, likely 50-day and 100-day MAs) crossing above the longer-term blue moving average (probably the 200-day MA). This is often a "golden cross," signaling the start of a new uptrend.
Volume Spike: The large spike in volume recently indicates that the price movement has strong support from the market. High volume on a price rise is generally a positive signal, suggesting strong interest from buyers.
RSI Bullish Divergence: The RSI indicator has a bullish divergence. While the price was previously making lower lows, the RSI was making higher lows. This divergence often signals a potential trend reversal, which has already started to show up with the current price rise.
Fibonacci Levels: The price has broken above several key Fibonacci retracement levels (23.6%, 38.2%, and 50%), which adds to the bullish sentiment. If it continues, the next target could be 14.20-14.60 (the next resistance), followed by 15.20-15.50 at the 1.0 Fib extension.
Trendline Break: The stock has broken above a key downward trendline (TL #1), which indicates that the bearish pressure is subsiding, and a possible new uptrend is forming.
Potential Risks:
Overbought RSI: The RSI is nearing the overbought zone (currently at 78.84). An RSI above 70 can sometimes suggest the asset is overbought and may face a pullback or consolidation soon before continuing higher.
Resistance Ahead: The price faces significant resistance in the 14.20-14.60 zone. If the stock fails to break this level, it could trigger some profit-taking and lead to a minor pullback towards the support zone of 12.40-12.60.
False Breakout Risk: The recent breakout above the downtrend and Fibonacci levels needs sustained volume and buying pressure to confirm its strength. If the volume weakens, there’s a risk of a false breakout and the price returning to previous levels. BIL.N Daily ChartThis chart and analysis are not financial advice. Do your own research before trading or investing.
Bullish Signals:
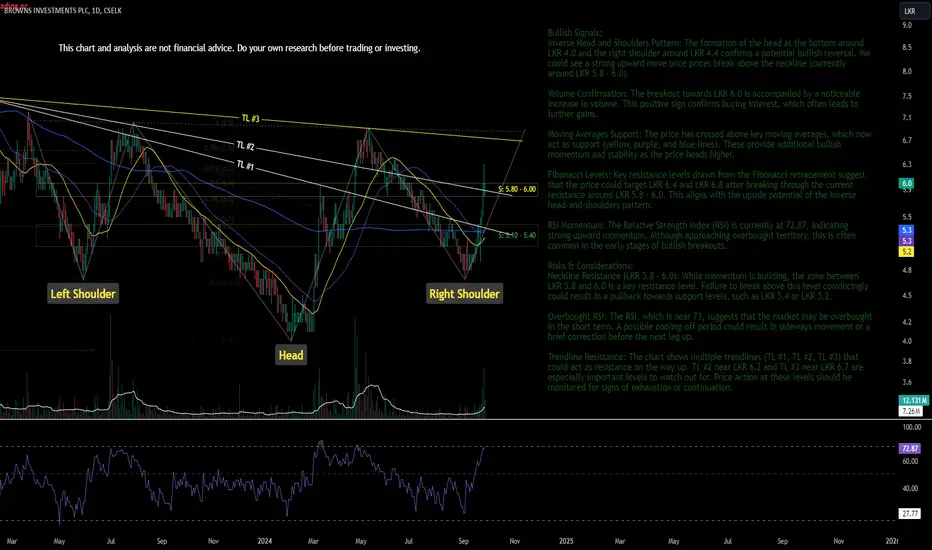
Inverse Head and Shoulders Pattern: The formation of the head at the bottom around LKR 4.0 and the right shoulder around LKR 4.4 confirms a potential bullish reversal. We could see a strong upward move once prices break above the neckline (currently around LKR 5.8 - 6.0).
Volume Confirmation: The breakout towards LKR 6.0 is accompanied by a noticeable increase in volume. This positive sign confirms buying interest, which often leads to further gains.
Moving Averages Support: The price has crossed above key moving averages, which now act as support (yellow, purple, and blue lines). These provide additional bullish momentum and stability as the price heads higher.
Fibonacci Levels: Key resistance levels drawn from the Fibonacci retracement suggest that the price could target LKR 6.4 and LKR 6.8 after breaking through the current resistance around LKR 5.8 - 6.0. This aligns with the upside potential of the inverse head-and-shoulders pattern.
RSI Momentum: The Relative Strength Index (RSI) is currently at 72.87, indicating strong upward momentum. Although approaching overbought territory, this is often common in the early stages of bullish breakouts.
Risks & Considerations:
Neckline Resistance (LKR 5.8 - 6.0): While momentum is building, the zone between LKR 5.8 and 6.0 is a key resistance level. Failure to break above this level convincingly could result in a pullback towards support levels, such as LKR 5.4 or LKR 5.2.
Overbought RSI: The RSI, which is near 73, suggests that the market may be overbought in the short term. A possible cooling-off period could result in sideways movement or a brief correction before the next leg up.
Trendline Resistance: The chart shows multiple trendlines (TL #1, TL #2, TL #3) that could act as resistance on the way up. TL #2 near LKR 6.2 and TL #3 near LKR 6.7 are especially important levels to watch out for. Price action at these levels should be monitored for signs of exhaustion or continuation.