Chart types available on TradingView
TradingView Supercharts offer 20+ chart types — from classic line and candlesticks to advanced options with built-in indicators, like time price opportunity (TPO) and session volume profile (SVP). All chart types can be customized and adjusted to fit your unique strategy. In this article, we'll go through each one, highlight their capabilities, and find use cases across different trading styles.
CONTENTS:
What are chart types and how to read them
Chart types are technical analysis visualization tools used to display various information, including price, time, trading volume, volatility over time, and more.
As a visualization approach to studying tradable assets and other financial data, charts use two axes — the vertical for price and the horizontal for time. As time progresses, a chart's lines and figures move up or down, but always to the right. However, there are price-based charts that don't use time as their basis and rely solely on price.
Different types of charts use unique methods to plot lines, bars, and other visual elements. But all use the same data, which comes from the exchange where the asset is traded.
For example, when someone refers to Nvidia's stock price, they're usually talking about the price from the Nasdaq exchange — because it's the primary listing venue for Nvidia's stock.
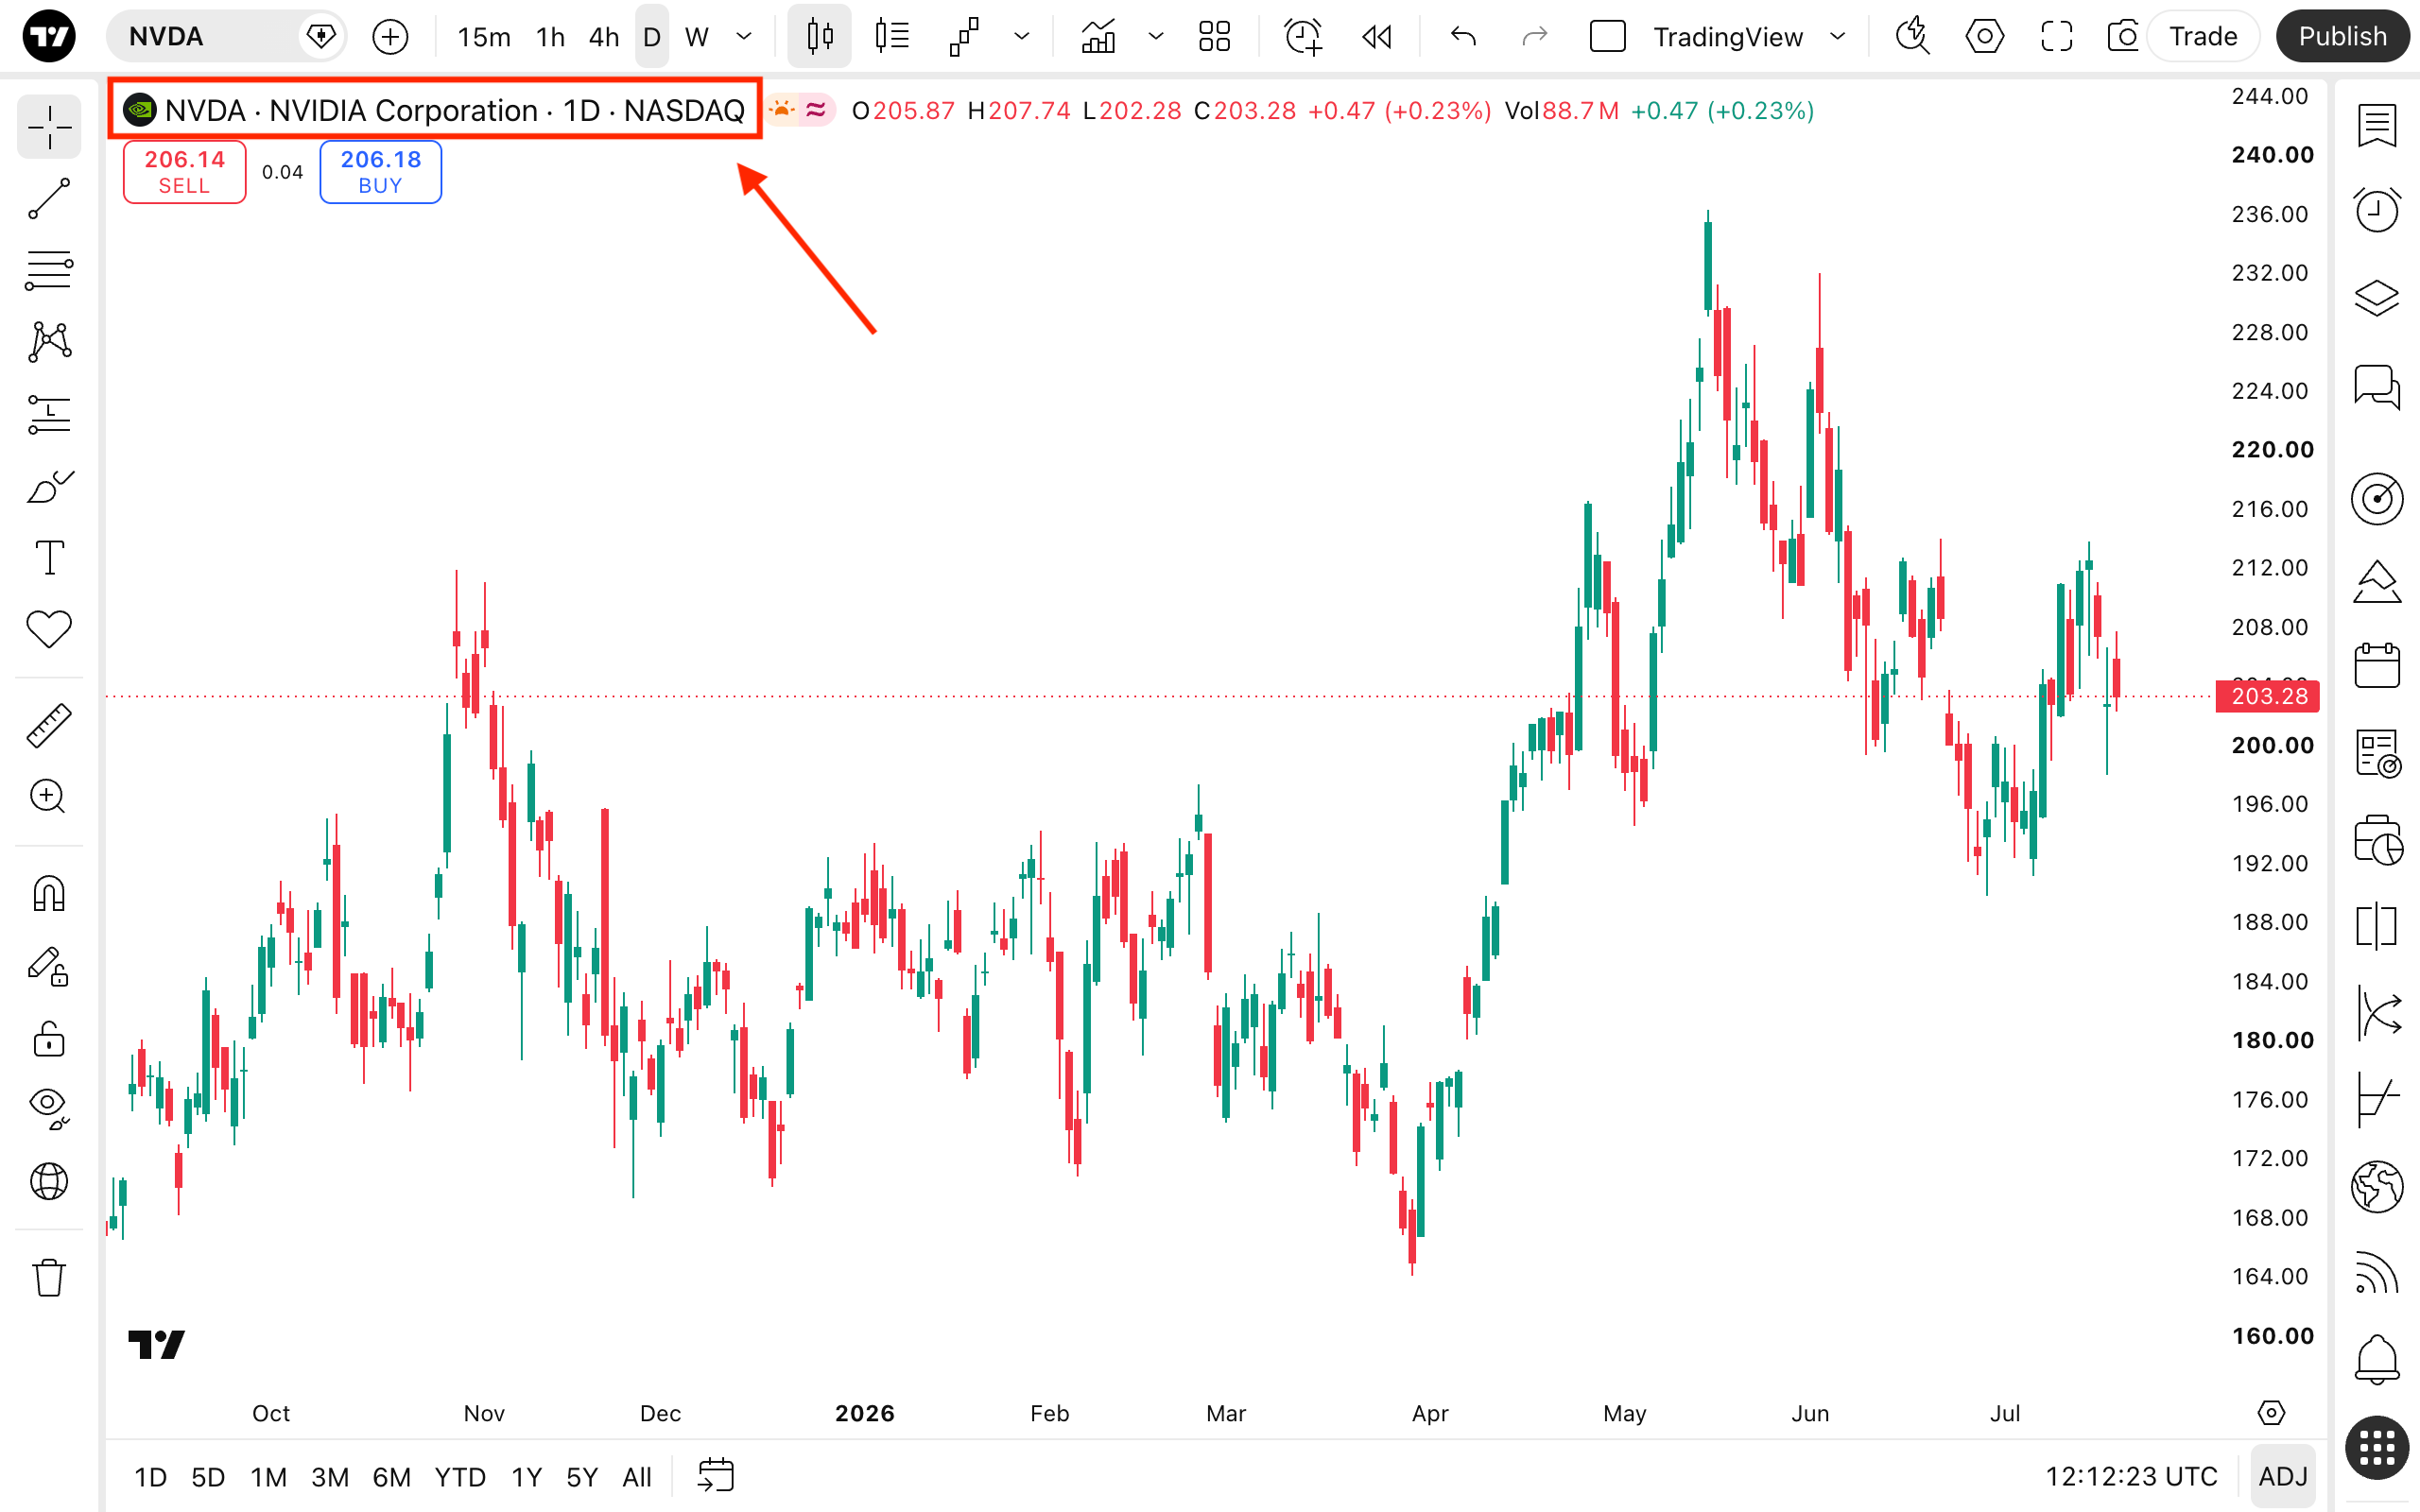
However, the same company's stock — or other assets such as cryptocurrencies and Forex pairs — can be traded on multiple exchanges simultaneously. Be aware of this, so you don't end up using incorrect data in your trading.
For example, if you open a Bitcoin chart with data from both Kraken and Coinbase and apply the same chart type to each, you'll see different charts. This is because chart types reflect exchange-specific data — traders on Kraken and traders on Coinbase place different orders, which results in different prices.
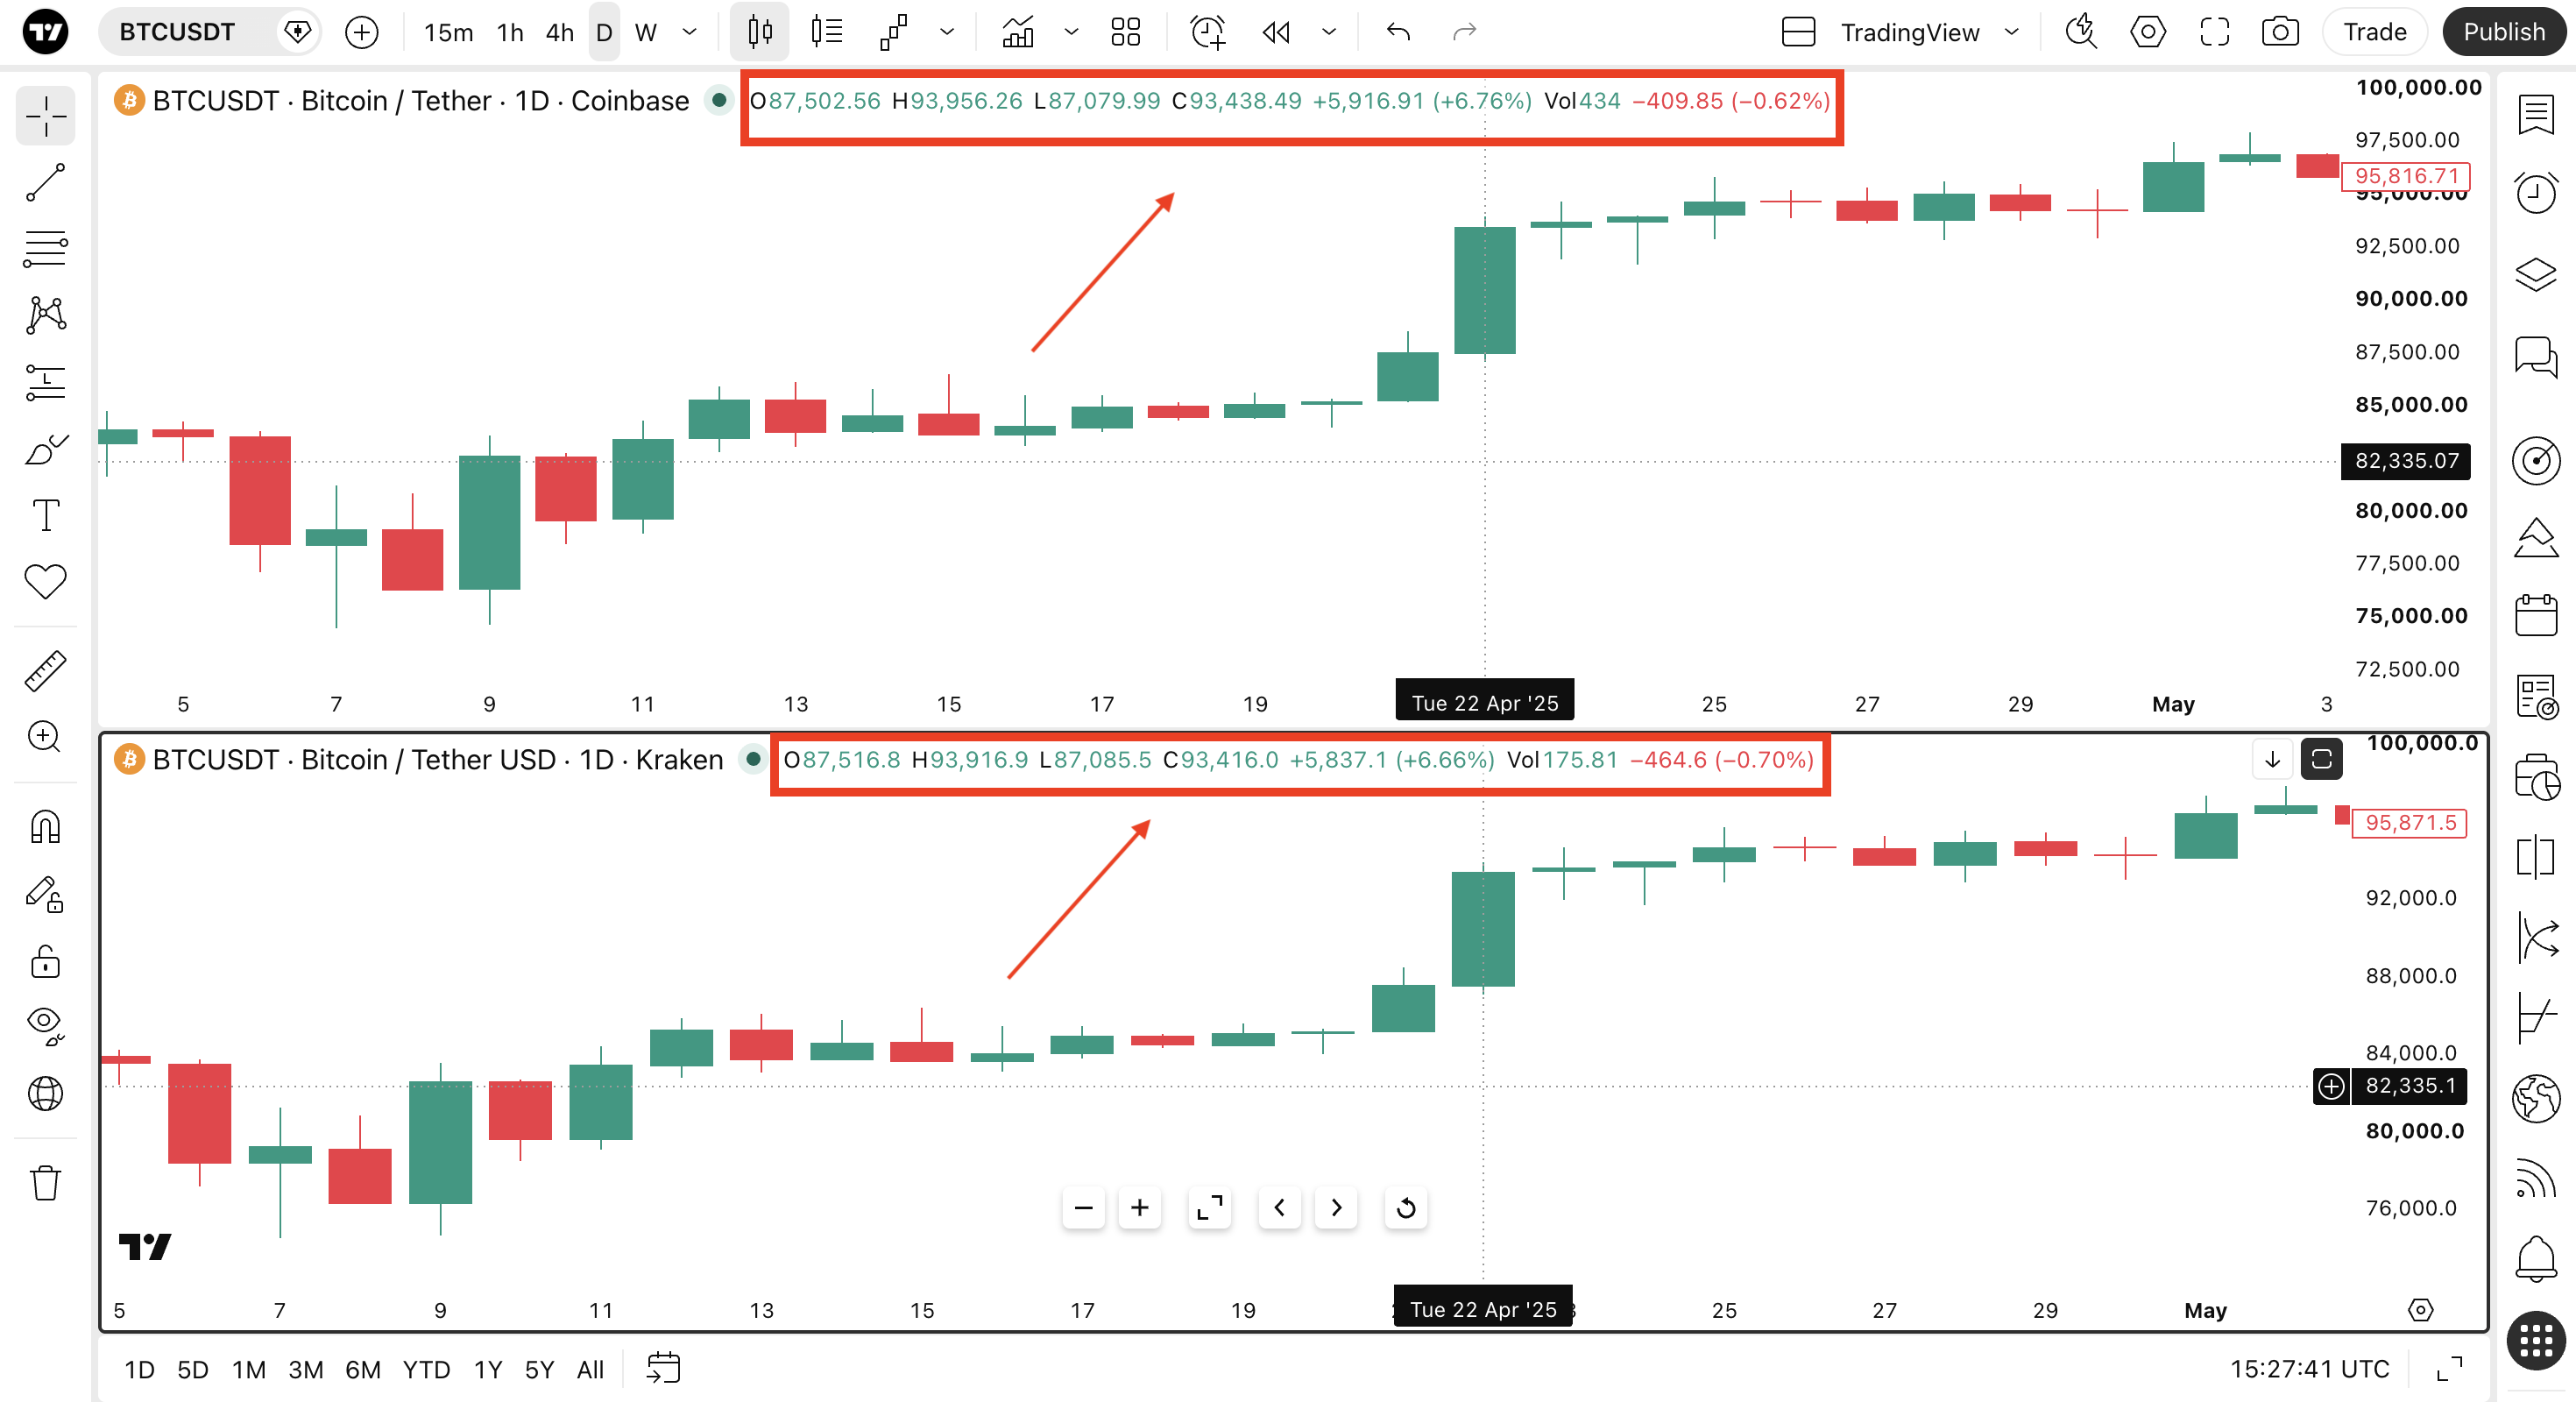
To better understand the differences, let's go further and see how to apply different chart types to enhance your technical analysis.
TradingView chart types
Different charts allow you to perform different types of analysis. They can be categorized depending on their method of visualization, the basis for calculation, and intended use case.
Time-based and price-based charts
As mentioned earlier, charts can be either time-based or price-based, depending on what triggers the appearance of new chart elements.
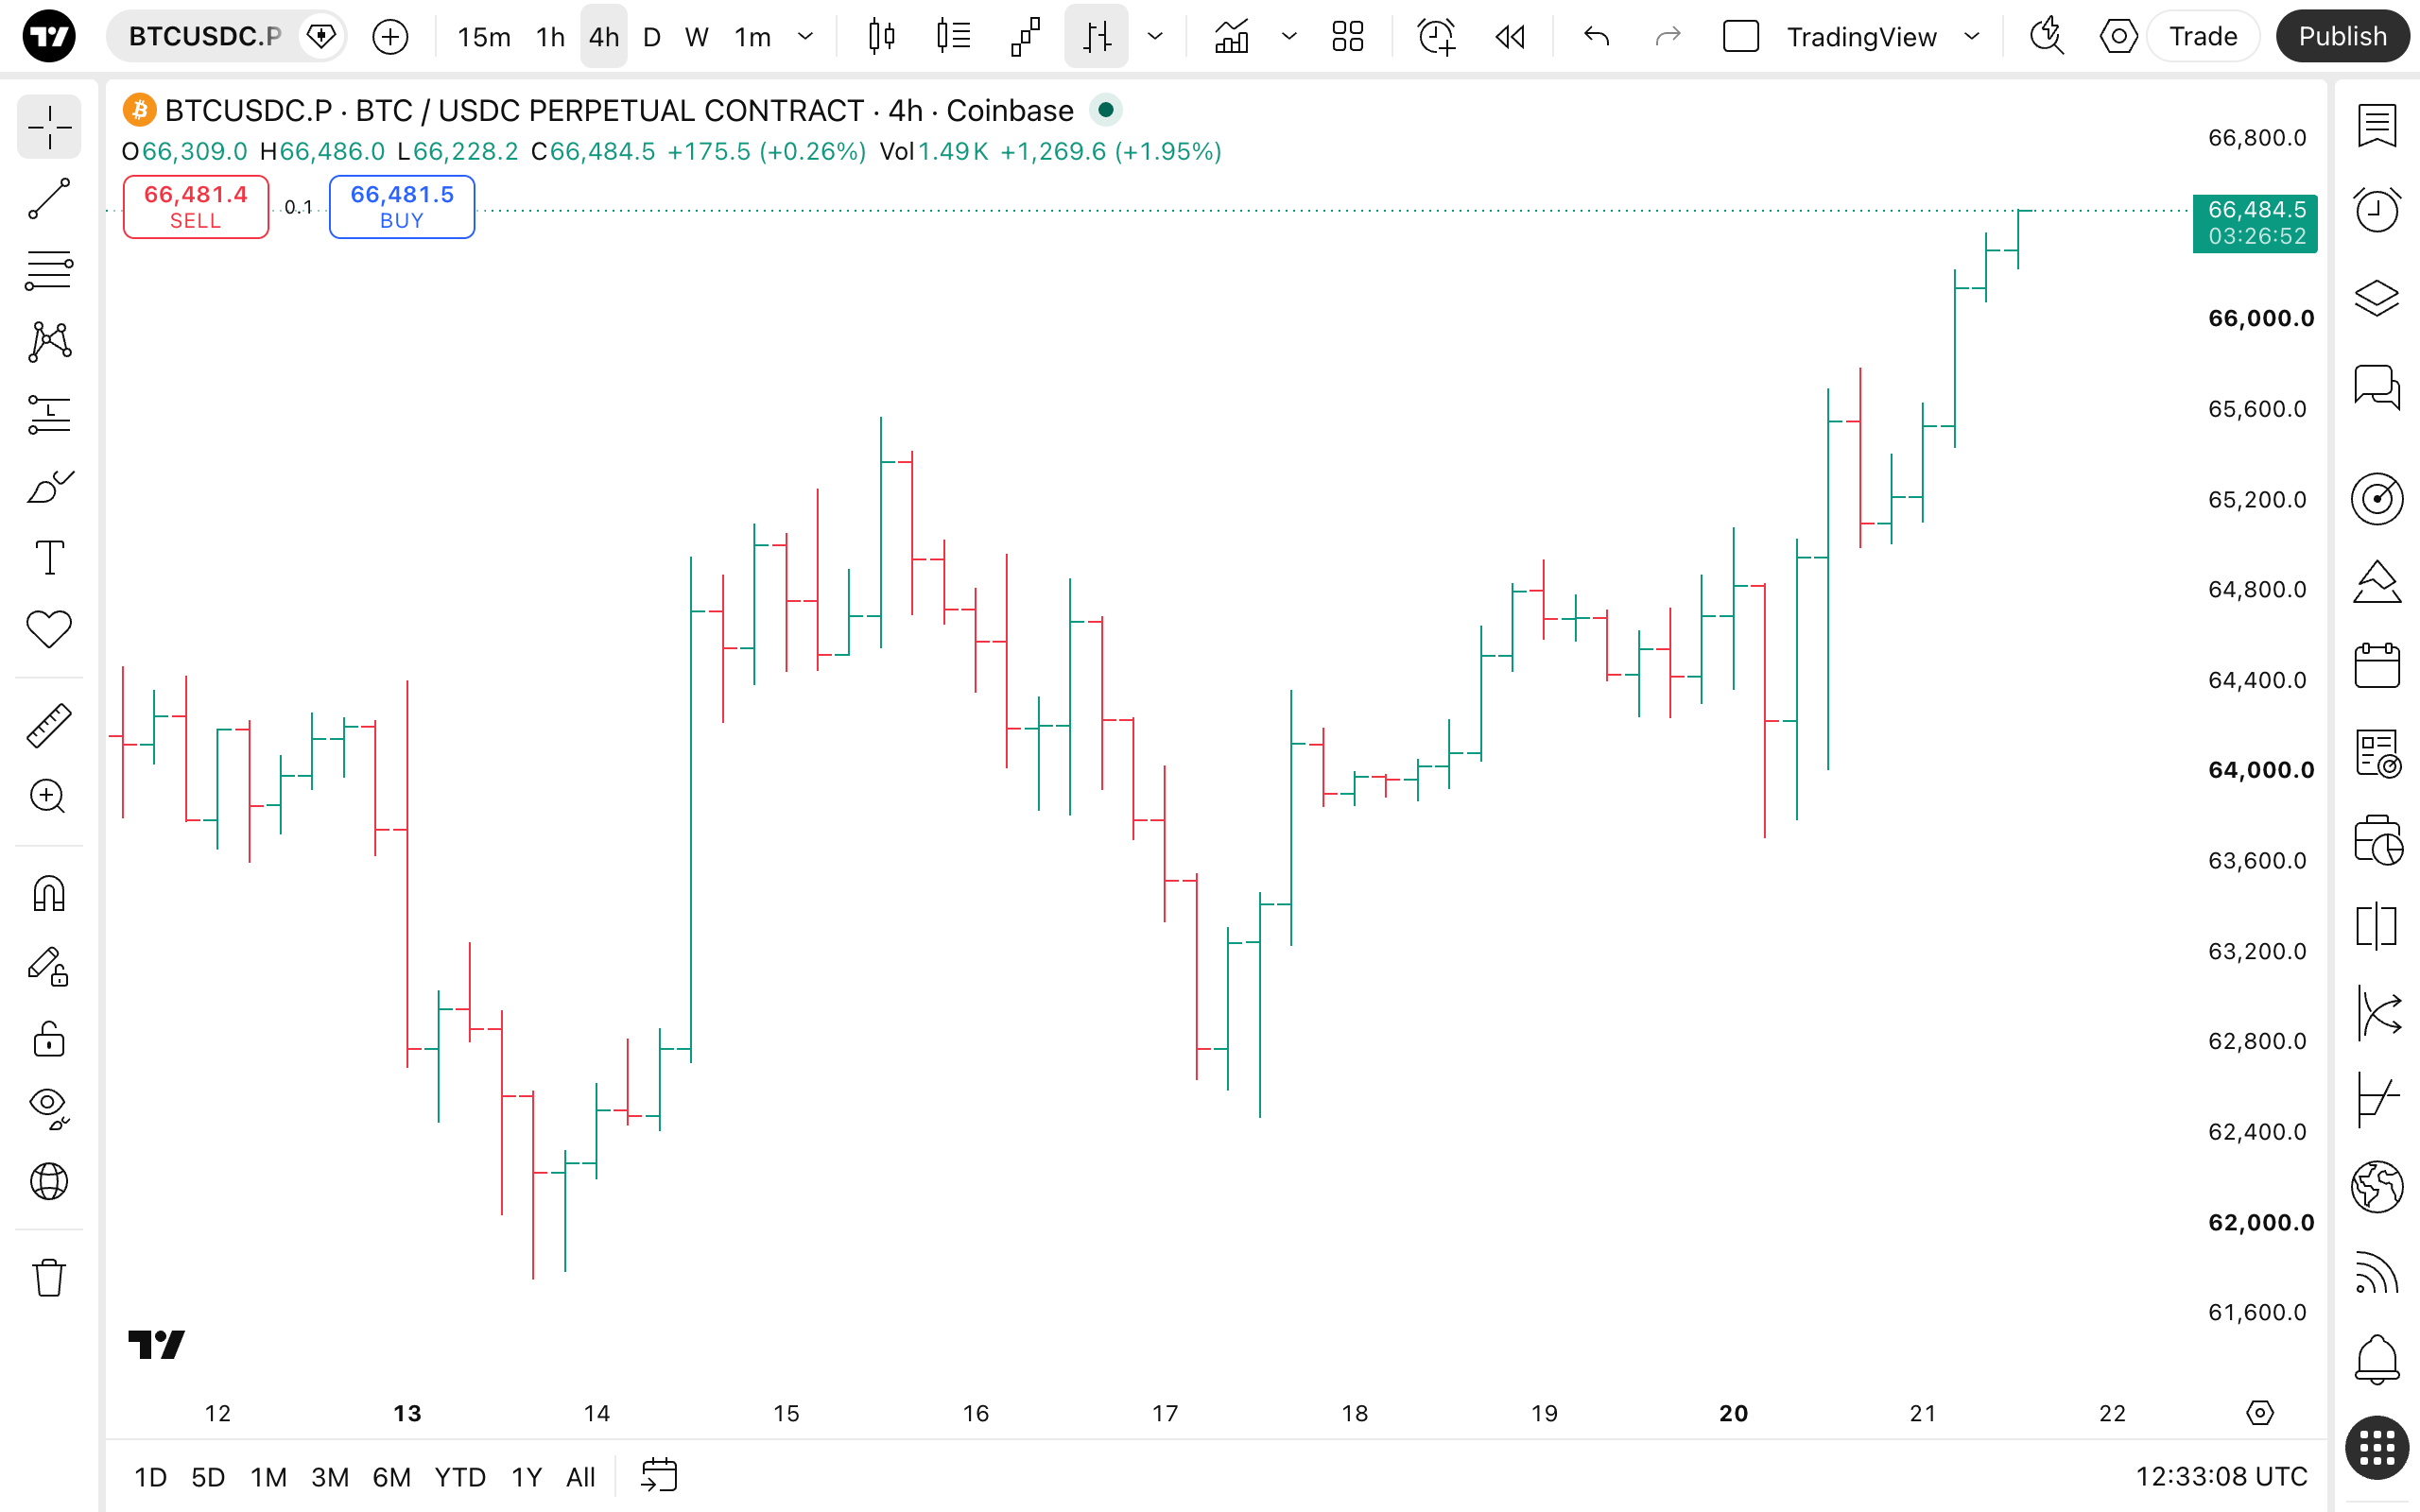
Time-based charts use time as the basis for drawing new chart elements. Time is displayed linearly along the horizontal axis. Each element represents an equal unit of time that is consistent across the chart.
For example, on this four-hour bar chart, each bar represents four hours of trading. If you hover your mouse over a bar, you'll see the starting time of that bar. All the trading activity that occurred during those four hours is included.
Price-based charts don't factor in time — they draw chart elements only when a specified price change occurs.
For example, Kagi charts draw vertical and horizontal lines as long as the downward or upward movement continues. In this screenshot, you can see that the same distance between the right periods are shorter than the left ones. This is because the movement later was more sharp.
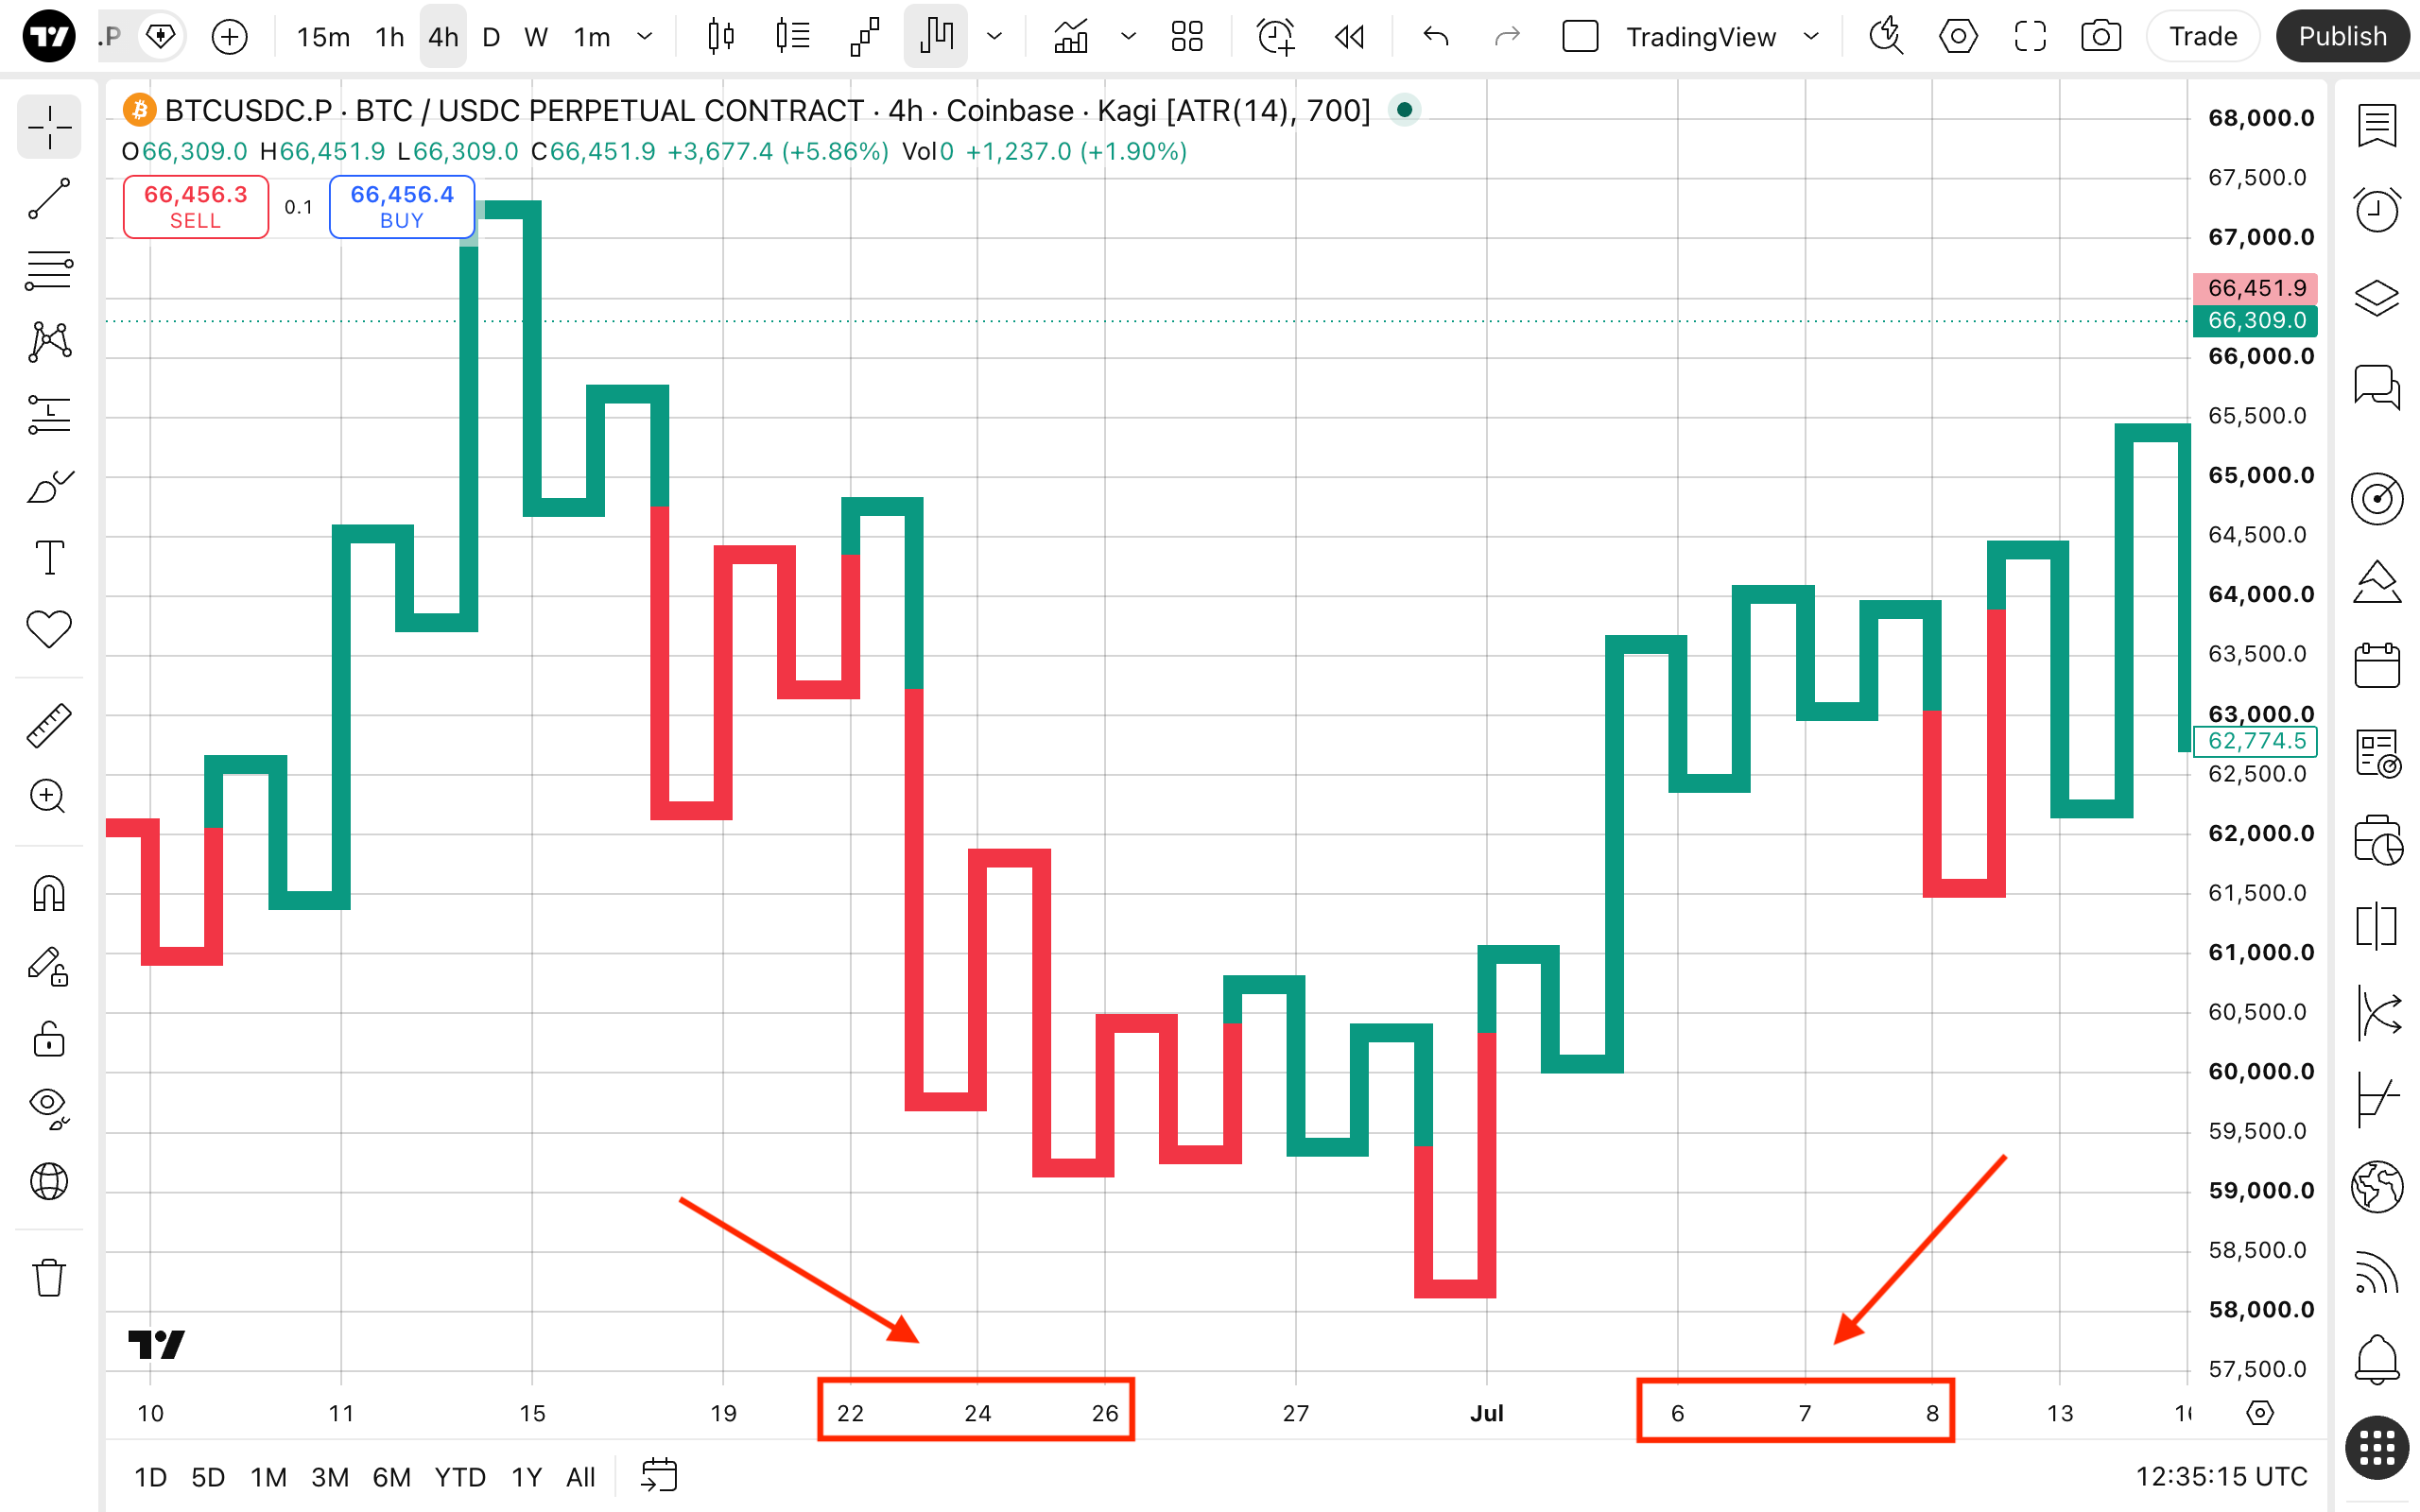
There's a common saying that price-based charts "help traders filter out time noise." However, we can't say this is always true — some trading strategies rely on time and don't view it as noise.
On TradingView, you can access the following price-based chart types:
All other chart types on TradingView are time-based.
Classic chart types
Line charts, bar charts, and candles charts are the most common types due to their simplicity and comprehensiveness. They are called "classic" because they are the oldest — tried and true trading classics. Because nearly every trader is familiar with them, they are typically the starting points for studying technical analysis.
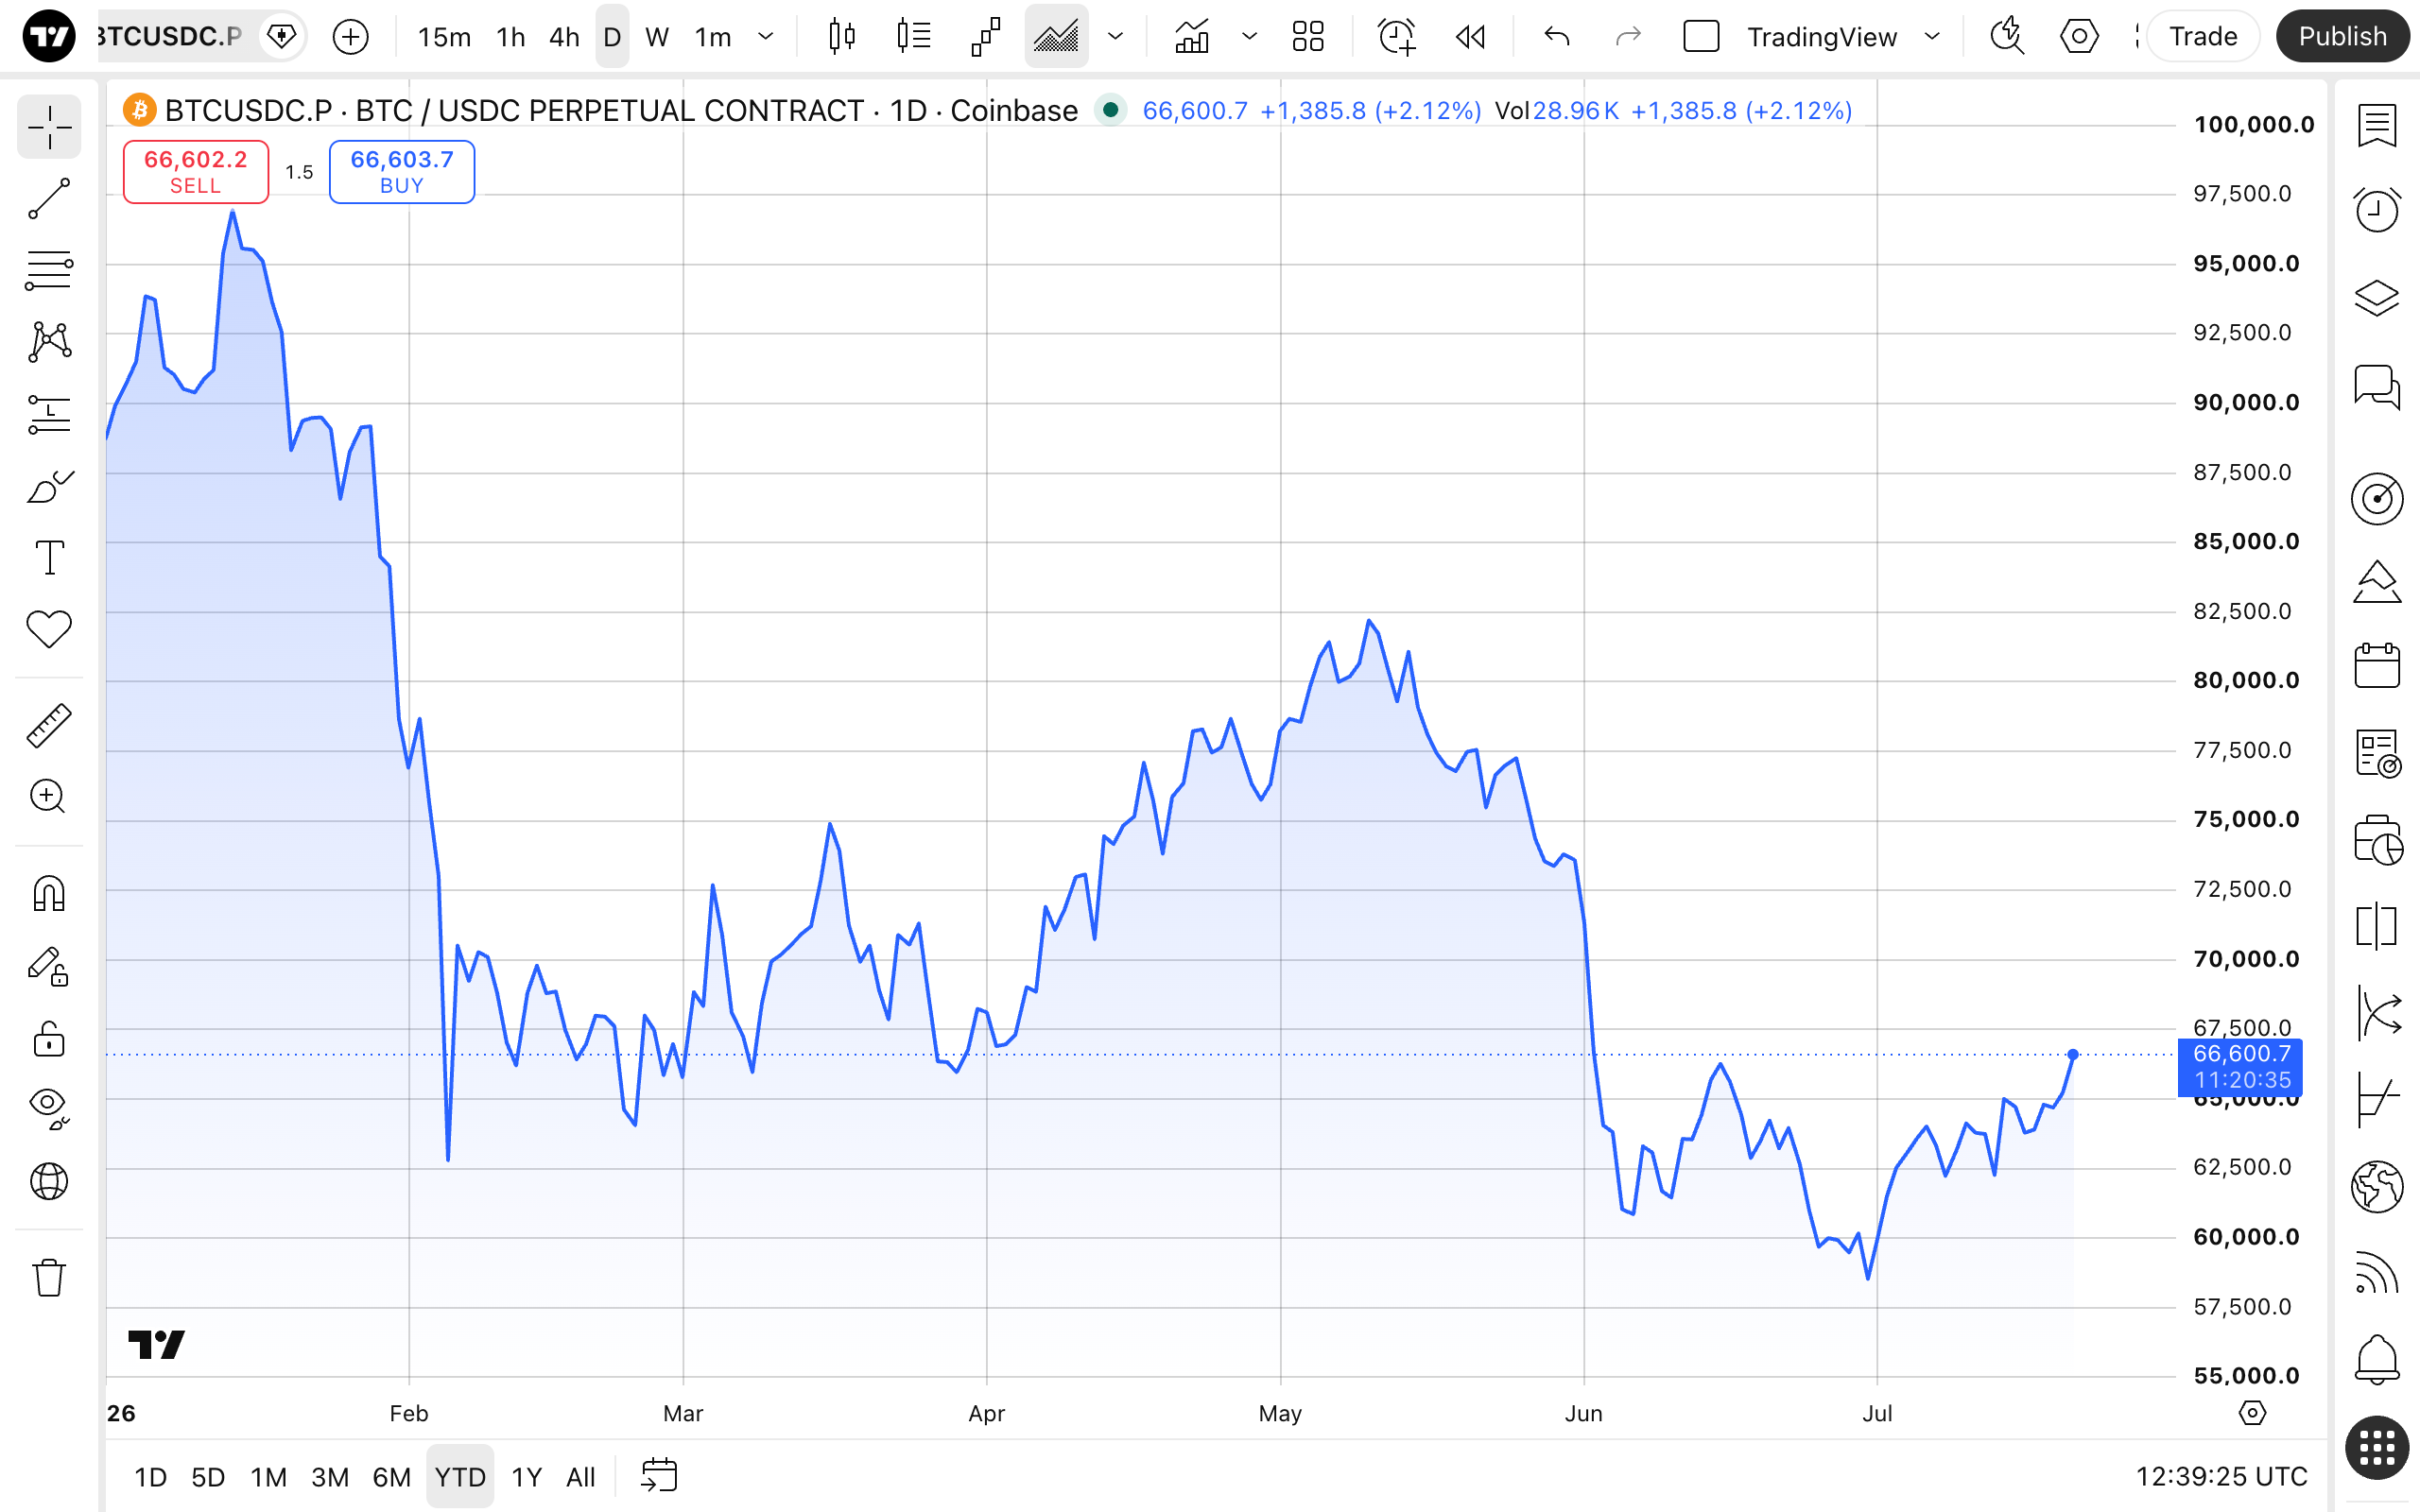
On TradingView, line charts come in different variations:
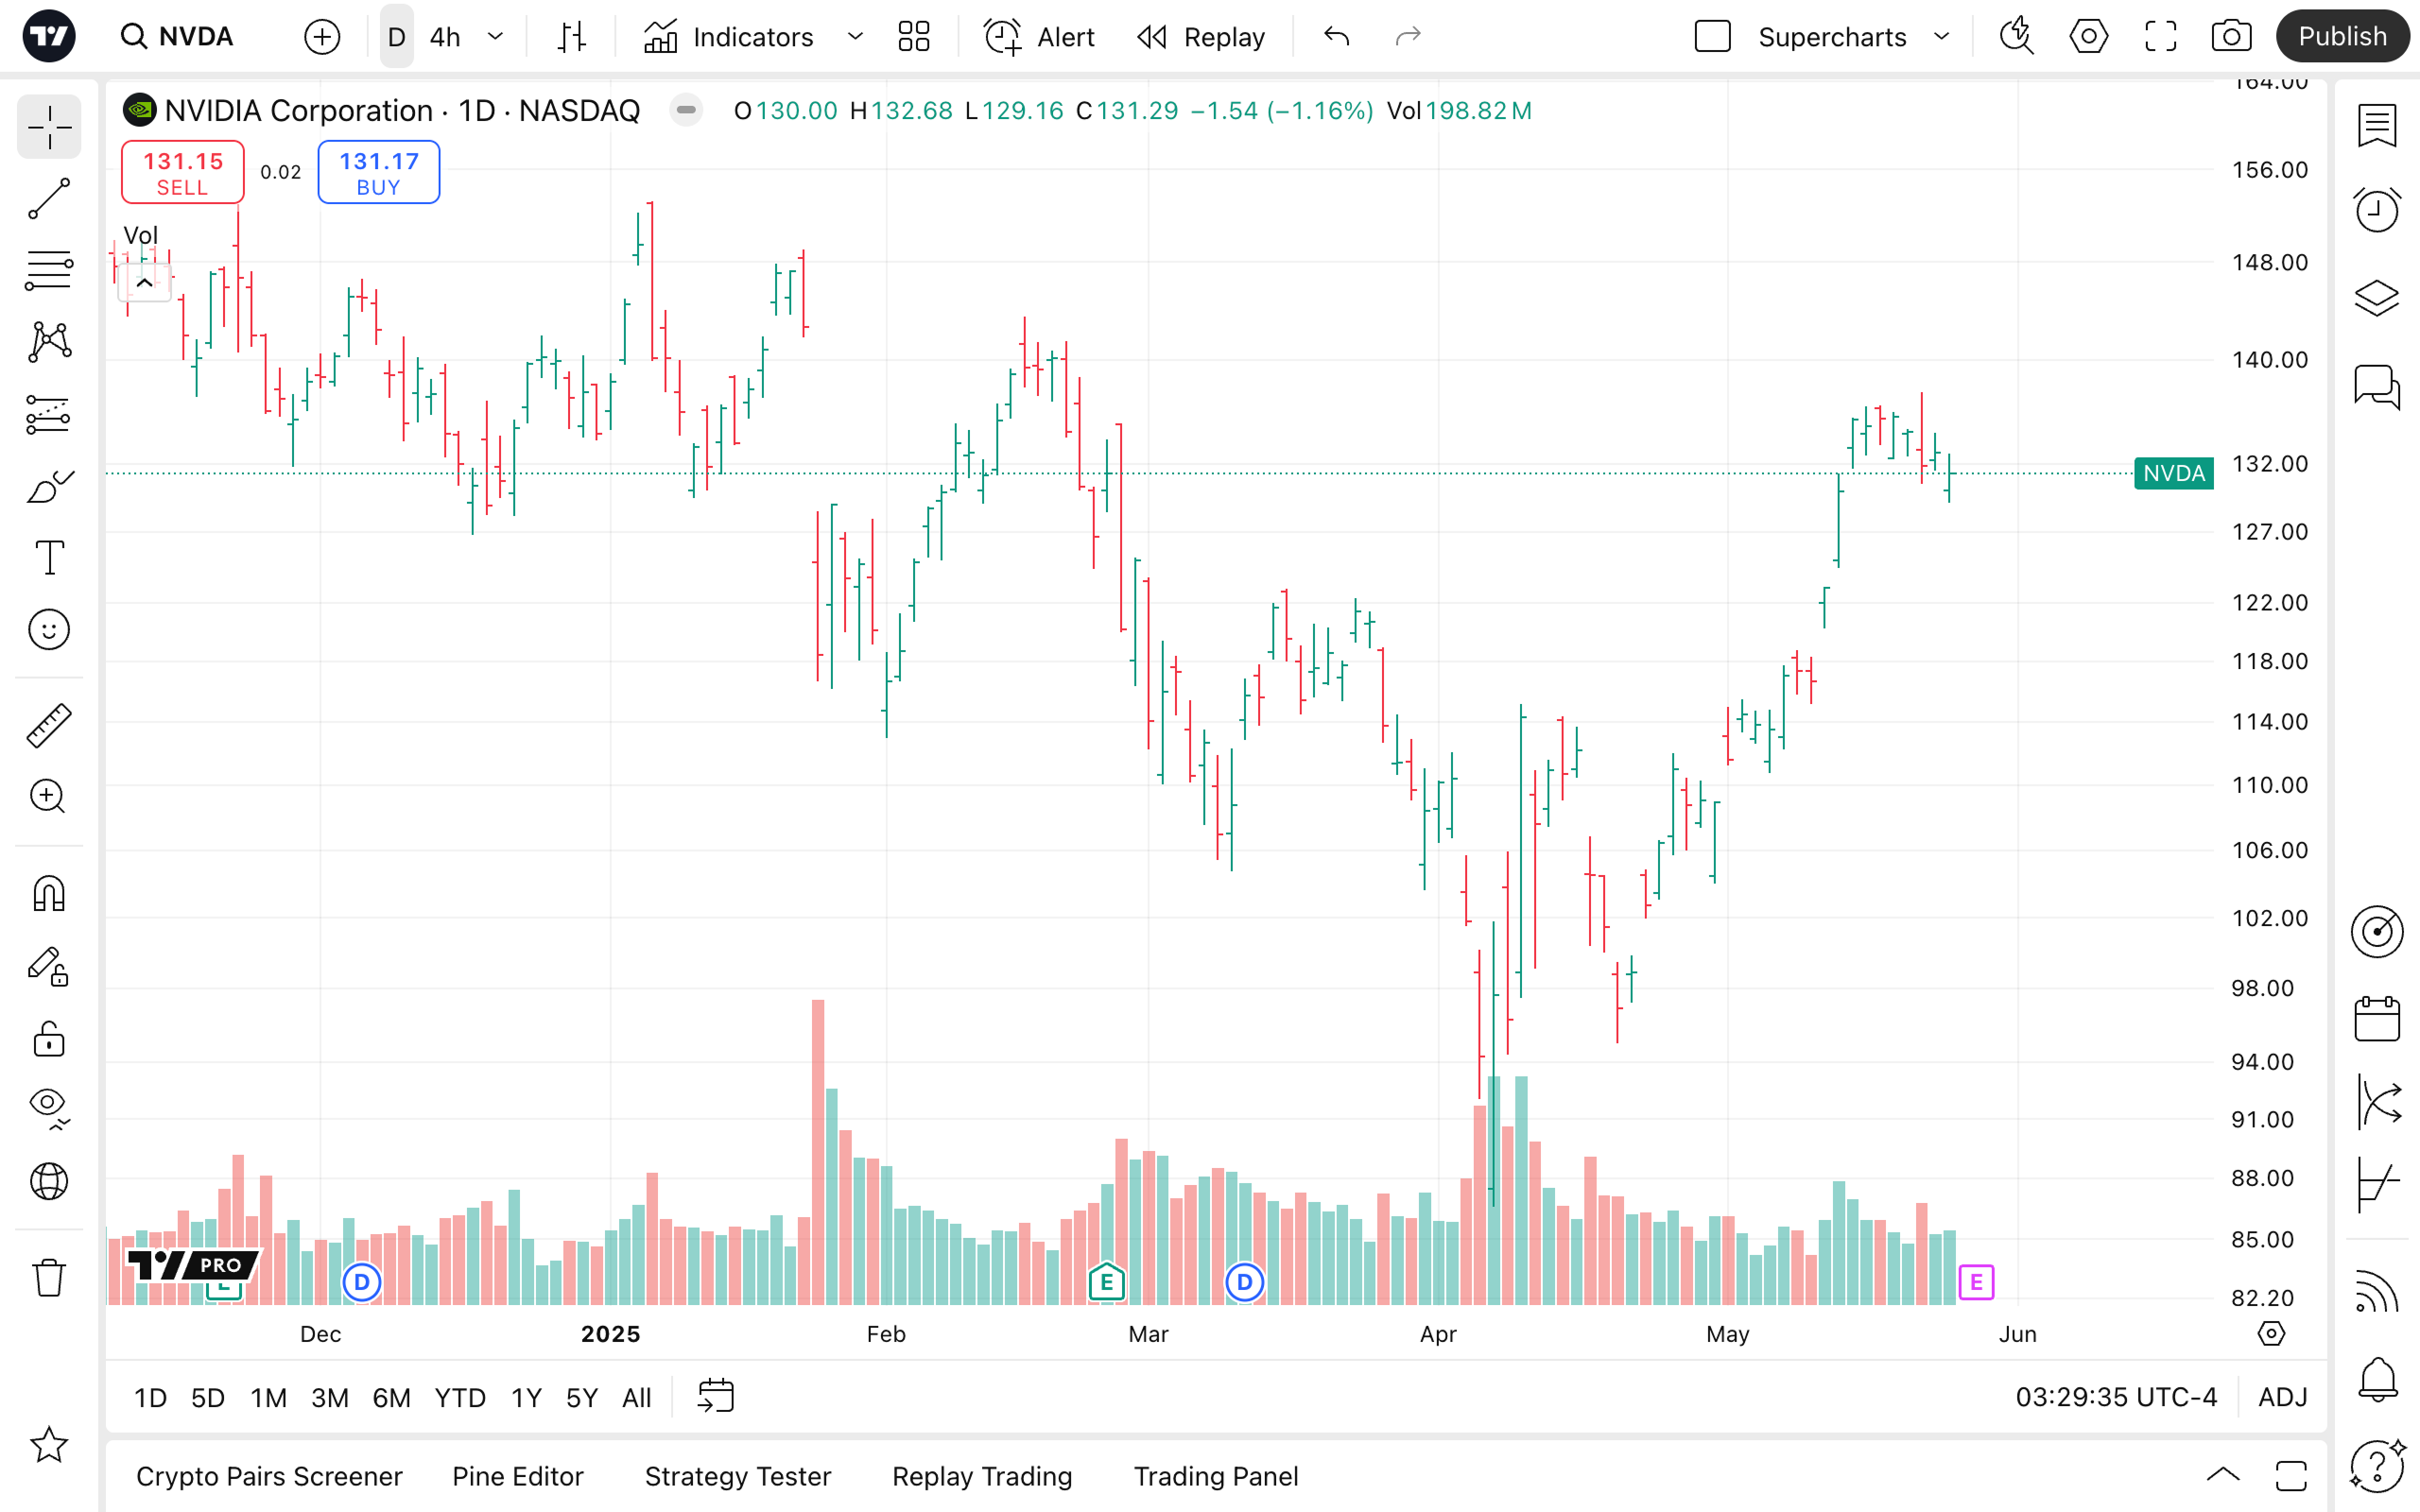
Bars are presented as:
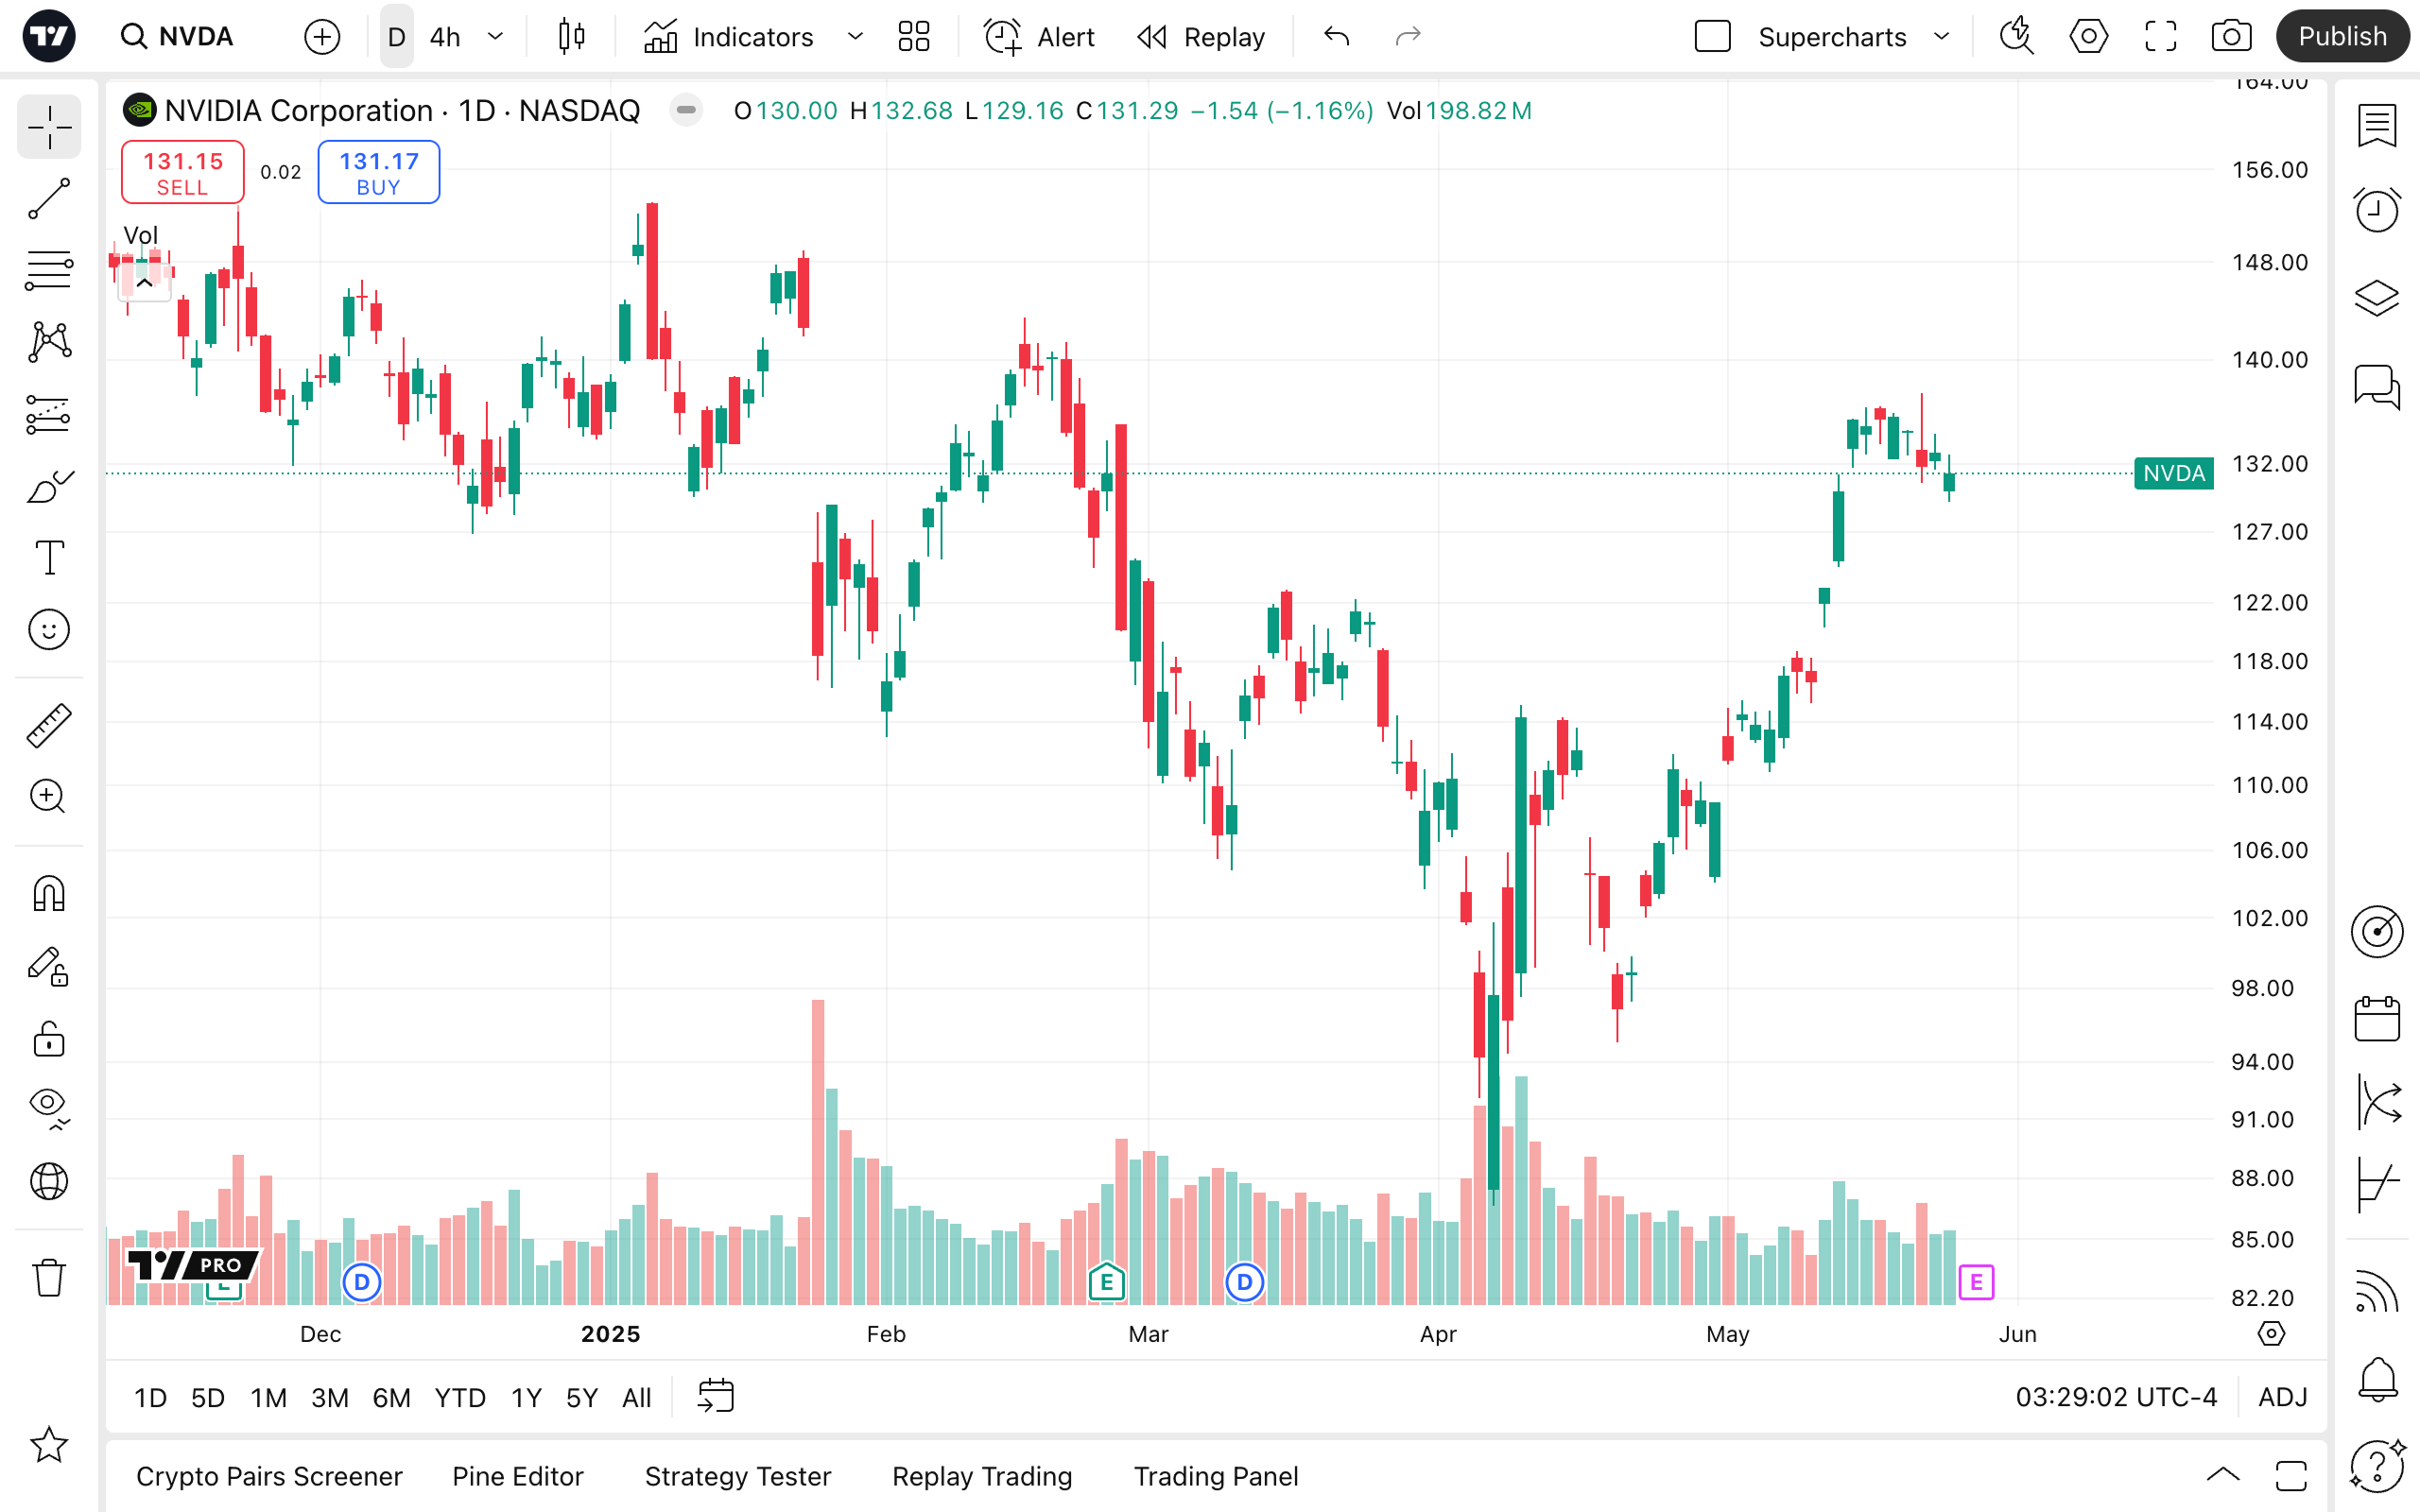
Japanese charts available as:
Indicator-based chart types
The deeper you dive into charting, you may eventually notice that some chart types provide more information than certain indicators.
Let's look at this screenshot: our split layout contains two candlestick charts.
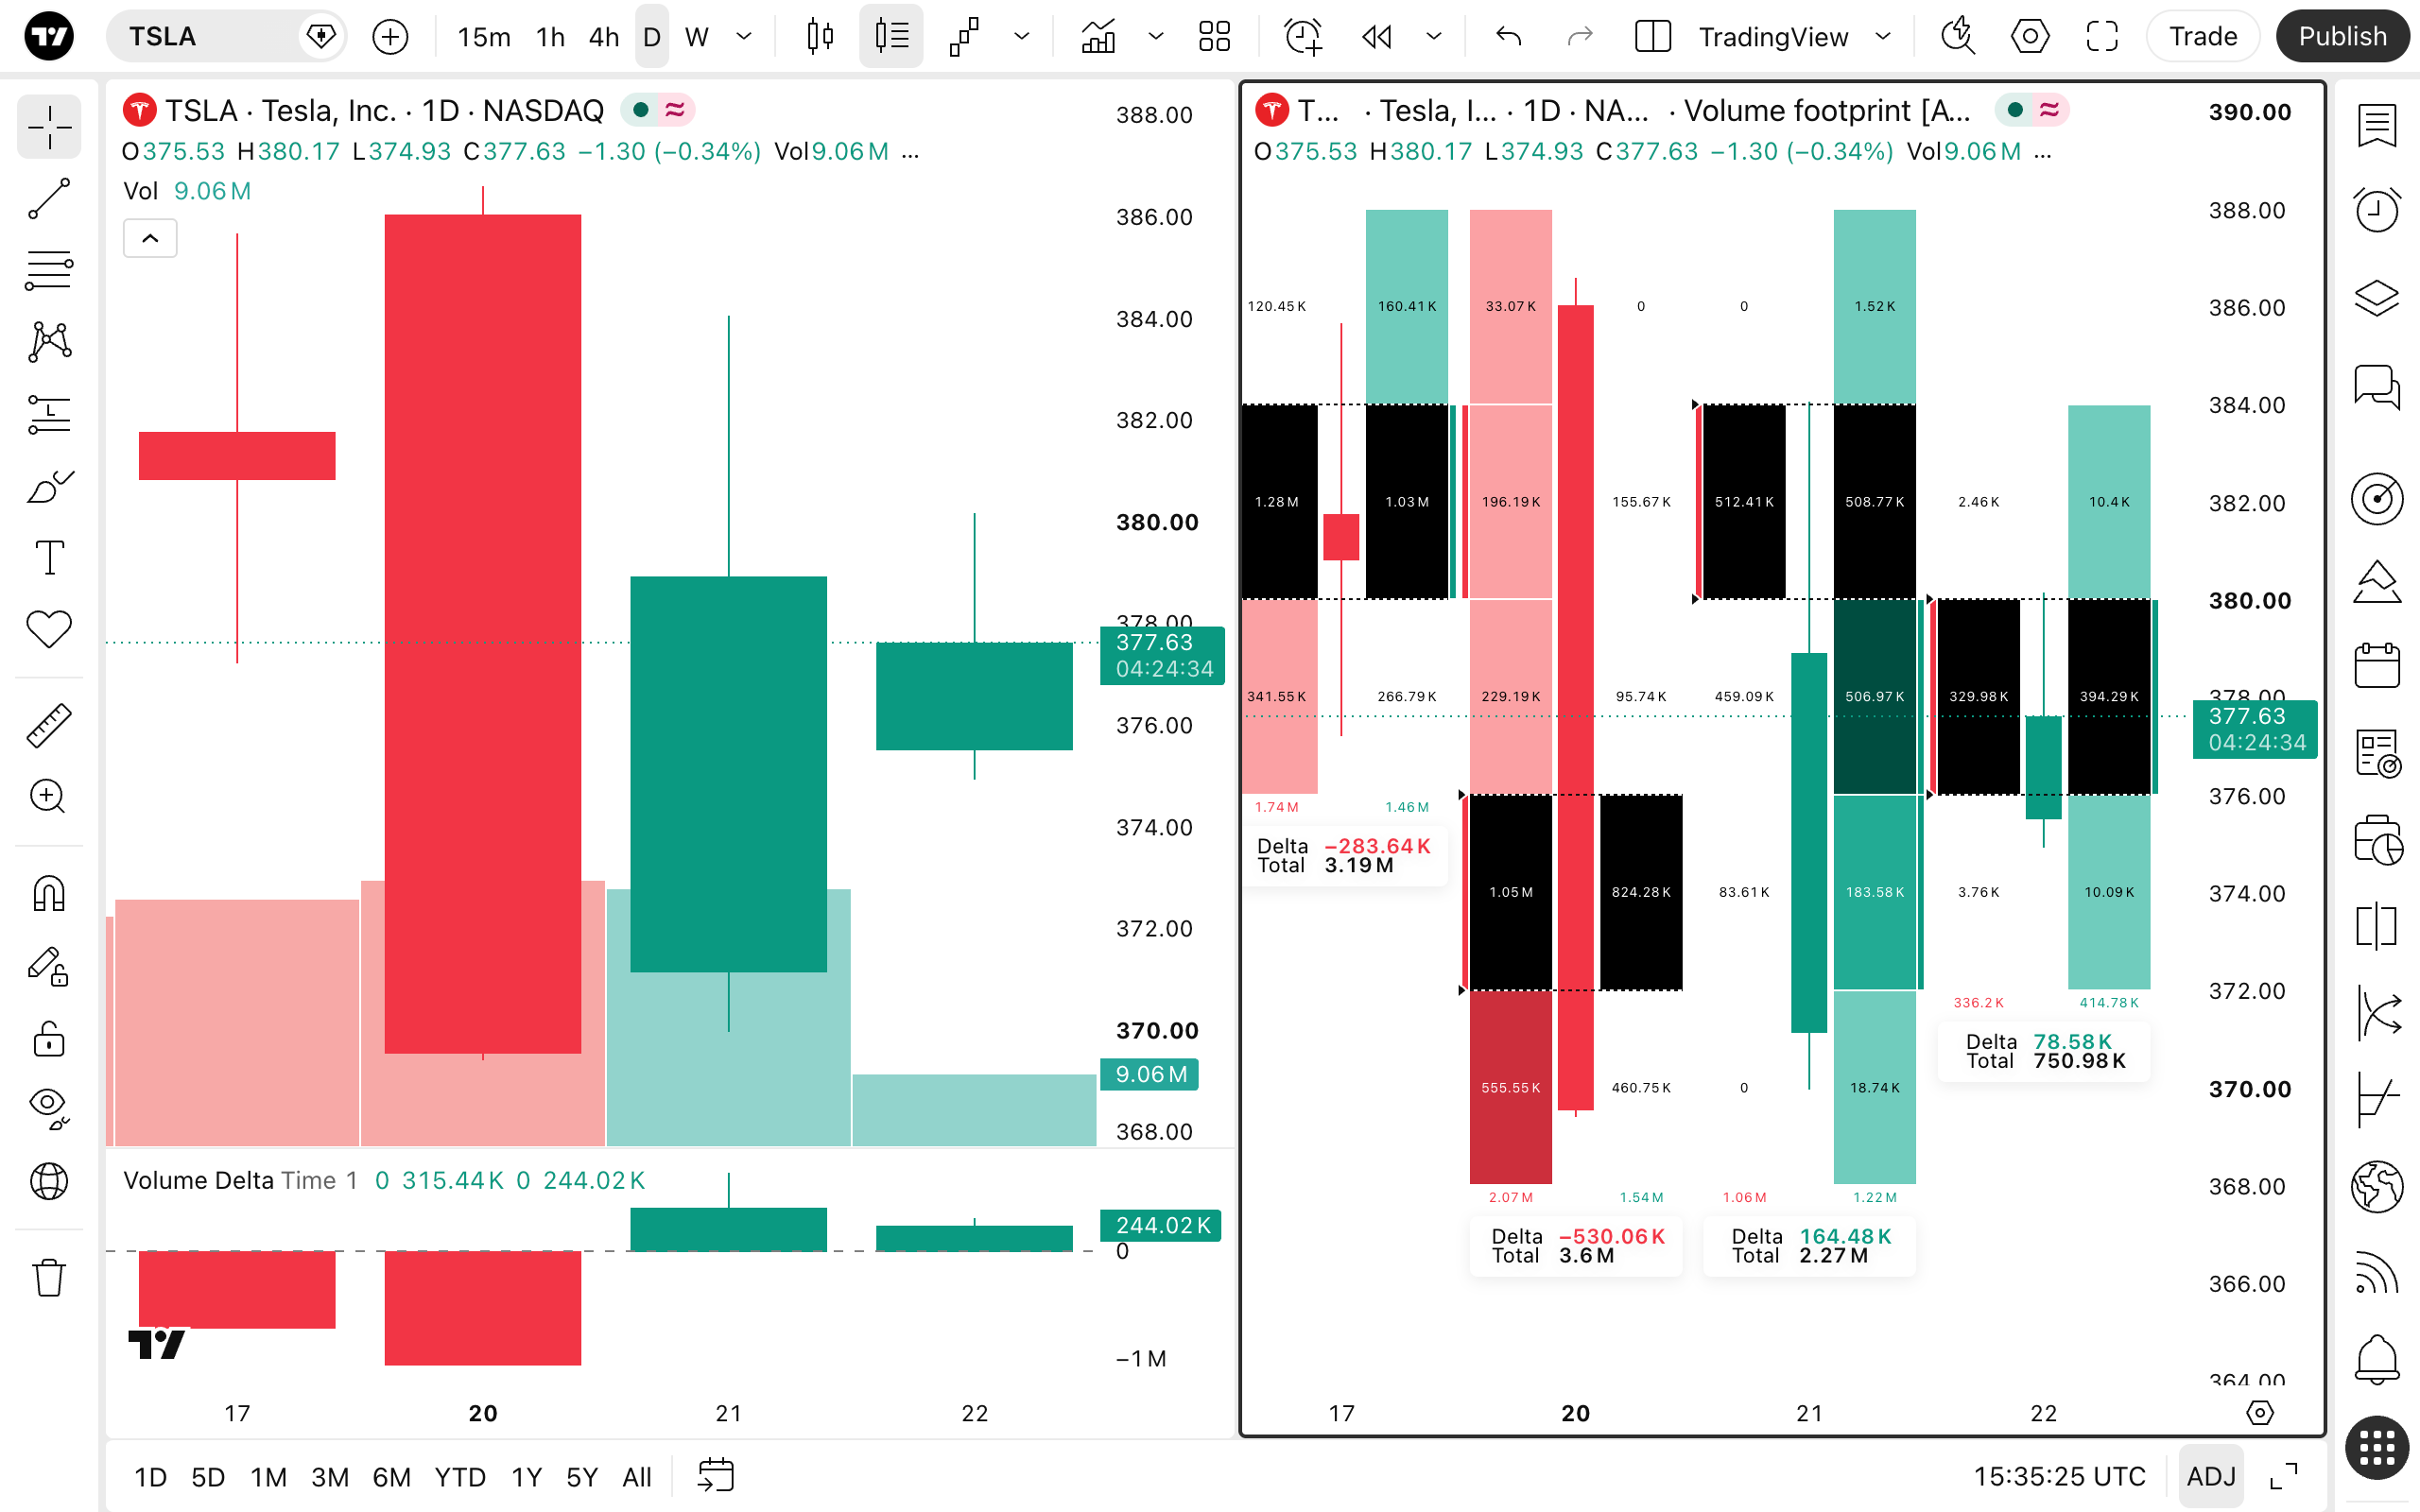
The left chart uses Japanese candlesticks with the volume and volume delta indicators.
Candles show you high, low, open, and close prices for each selected timeframe — in this case, one day.
The volume indicator shows total trading volume in units — here, for Tesla's stock.
The volume delta indicator reflects the difference between buy and sell volume. A positive delta means buyers are stronger than sellers, and vice versa.
The right part displays a volume footprint chart. It shows the same candles, total trading volume, and volume delta — but also visualizes the distribution of buy and sell volume at different price levels within each 1-hour candle. A single chart can show you more information than a chart with two separate indicators.
On TradingView, you can access the following chart types with such features:
Column chart type
Both technical and fundamental analysis are commonly used together. Their metrics and indicators help evaluate the health of global markets and national economies.
With column charts, economic indicators such as GDP, interest rates, or inflation rates are presented as a consecutive array of green and red columns, helping you easily spot macroeconomic trends and shifts.
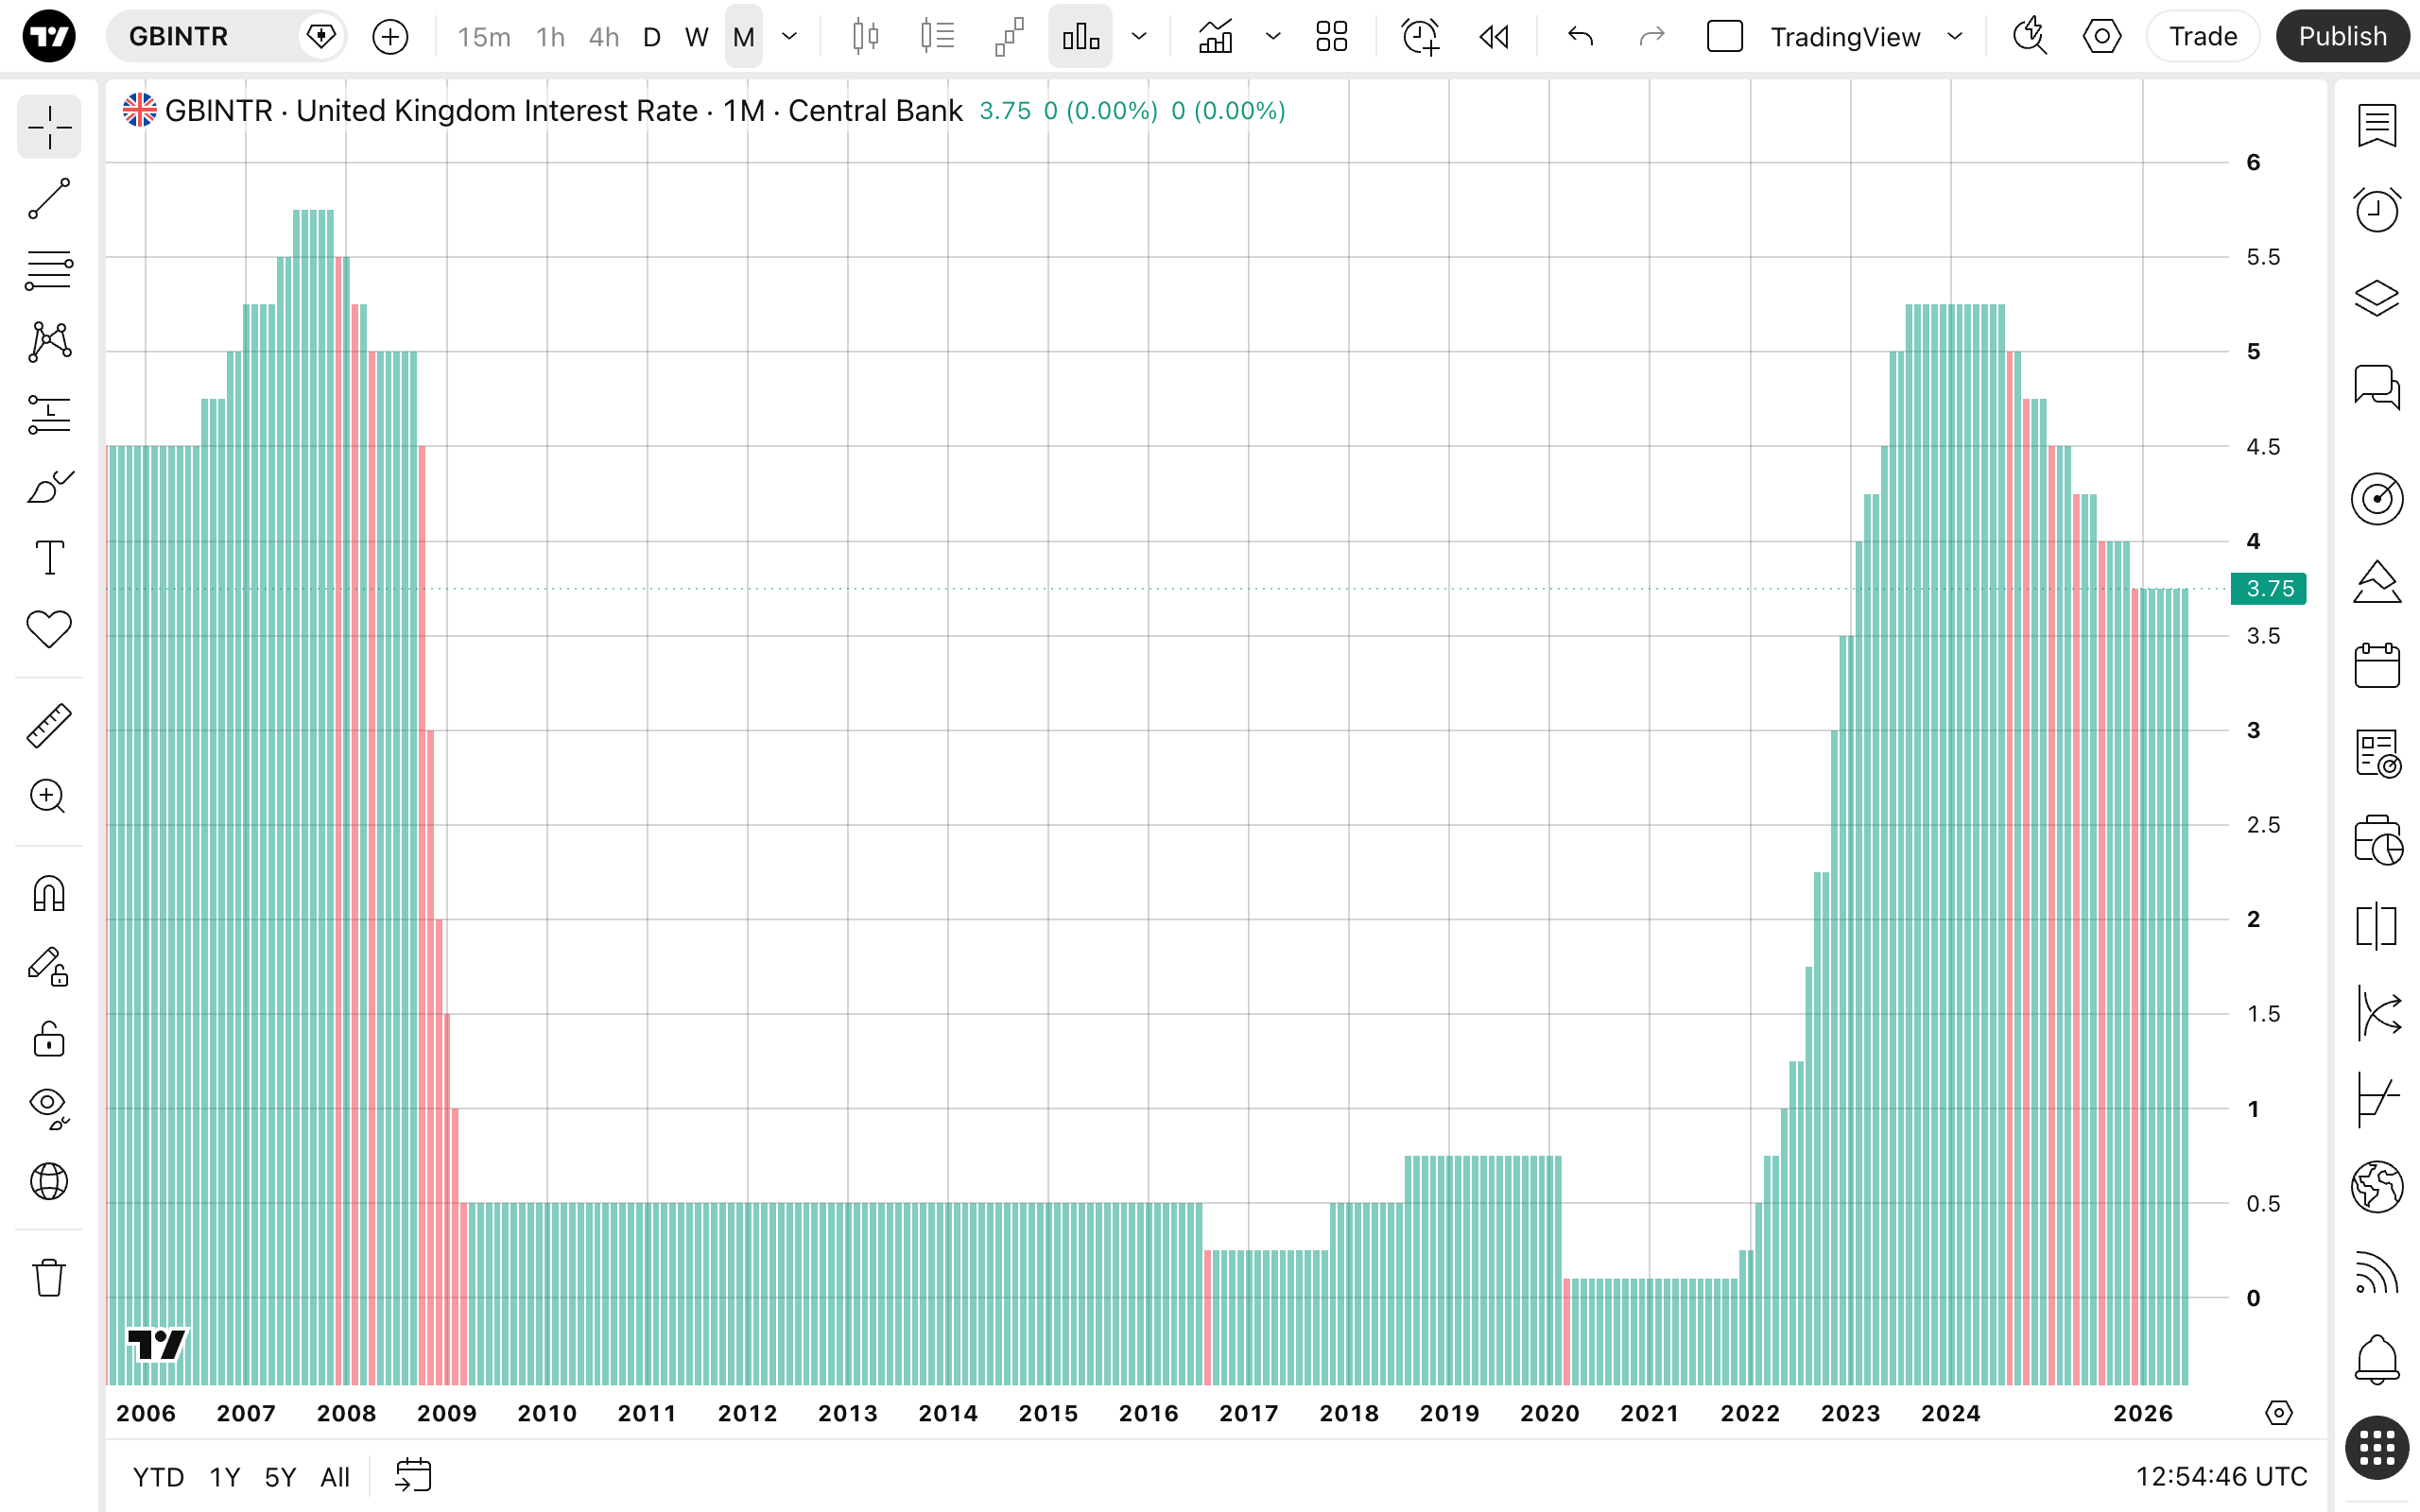
Columns aren't limited to charting financial indicators — you can use them however you see fit. Compare how they visualize data with other chart types and find what works best for you.
The bottom line
TradingView offers a broad range of tools to conduct robust financial analysis. If you're just beginning your journey into trading, each chart type can serve as your entry point into the tradingverse. Each chart type is unique and compliments the others, helping you seek out the answers before you leap.
To master technical analysis, combine chart types with TradingView indicators and learn how to make the most of TradingView layouts. Feel more confident and improve your trading and investing by studying both technical analysis and fundamental analysis — and learning all you need to know about Supercharts.
Also read: