Long
Long
Konami Just Unlocked a New Achievement, Record ProfitsFor years Konami was treated like the final boss that gamers loved to hate
Between the departure of Hideo Kojima, the company's heavy focus on pachinko, and the long silence from beloved franchises, many players thought the studio had rage quit AAA gaming. Fast forward to 2026, and the narrative has completely changed
Konami is quietly putting together one of the strongest comeback stories in gaming while delivering record financial results that most publishers would happily speedrun
The biggest reason behind Konami's success is that it isn't relying on a single "Game of the Year" launch every few years.. Instead, it has built a diversified ecosystem of recurring revenue. Mobile hit eFootball continues to expand its global player base, surpassing one billion downloads, while YuGi Oh! remains a cash printing machine through both physical trading cards and digital games
Meanwhile, classic franchises including Metal Gear Solid Δ: Snake Eater and Silent Hill have reignited excitement among longtime fans, proving Konami's legendary IP library still has plenty of extra lives left
Revenue climbed 17.1% year over year to ¥493.7 billion, while operating profit jumped 33.3% to ¥135.9 billion. Net income reached a record ¥100 billion, up nearly 34%, marking the company's third consecutive year of record revenue and profit.. The Digital Entertainment division, which includes console, PC, mobile and card games, generated ¥371 billion in revenue, up 21.5%, with business profit surging 37.5% to ¥136 billion. Those numbers highlight just how profitable Konami's gaming business has become, especially compared to publishers that depend heavily on blockbuster launches every few years
One of Konami's biggest competitive advantages is its portfolio
Unlike publishers that live or die by one franchise, Konami earns money from multiple segments including gaming, arcade systems, casinos, sports clubs, and digital entertainment. This diversification helps smooth out earnings during weaker game release cycles. At the same time, the company owns some of gaming's most recognizable intellectual property, including Metal Gear, Silent Hill, Castlevania, YuGi Oh!, eFootball, Suikoden, and Contra. That's an inventory most publishers would happily loot
AAA game development has become increasingly expensive, and fans now expect high quality remakes rather than quick nostalgia cash grabs
Mobile gaming also remains fiercely competitive, while Chinese publishers continue to dominate global live-service games. In addition, Konami's non gaming businesses, including gaming systems and sports operations, generally grow at a much slower pace than Digital Entertainment. Investors will want to see whether the current revival of classic franchises can translate into sustainable long term growth instead of being a one time combo streak
Konami no longer looks like a company living off old save files .. It has successfully respawned as a diversified entertainment giant with record earnings, expanding live service games, evergreen card franchises, and a growing lineup of premium releases. For investors, the biggest question isn't whether Konami still has legendary IP because that's obvious.
The question is whether management can keep chaining together critical hits with new releases while maintaining the incredible profitability that has made FY2026 one of the strongest years in the company's history. If they can, this stock may still have another level to unlock
 Long
Long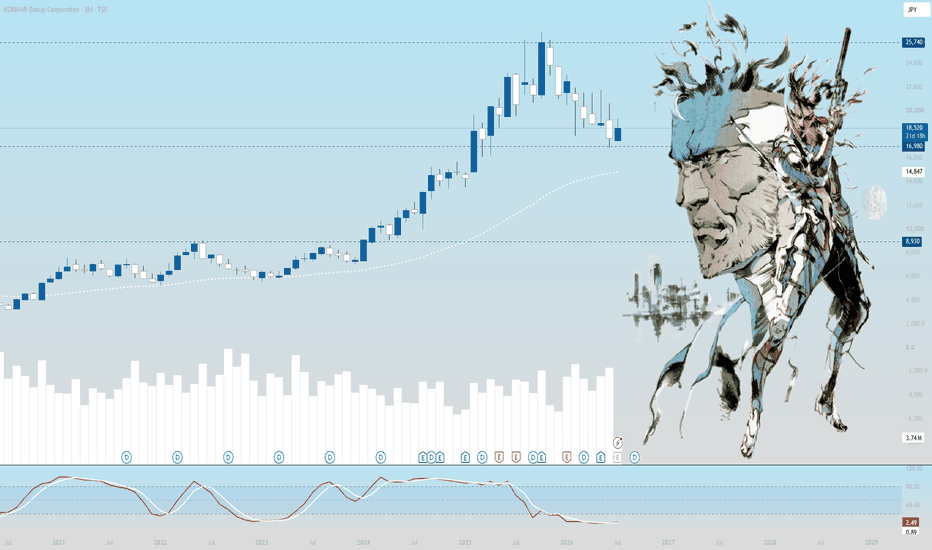
 Long
Long
 Long
Long
 Long
Long
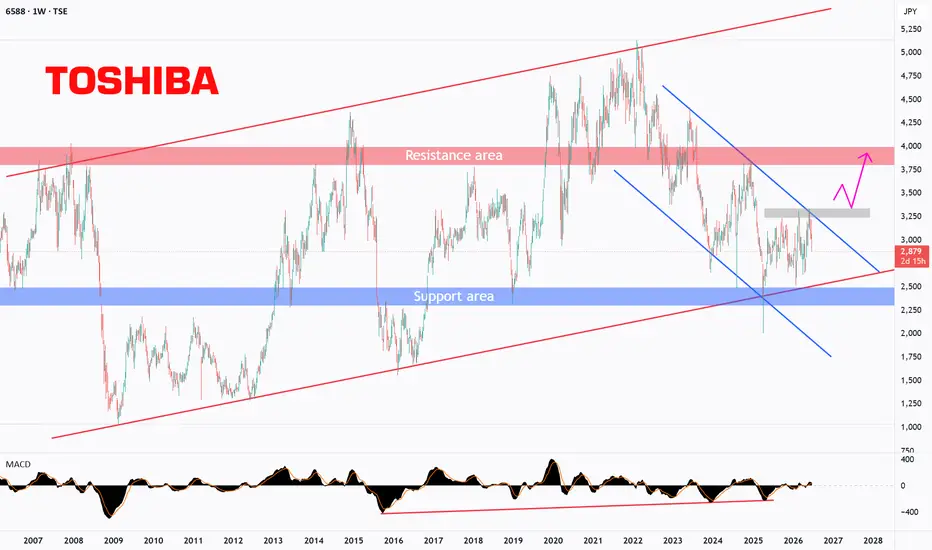
Toshiba — Corrective Phase Near Major Support !For investors with a long-term horizon, Toshiba may be an interesting stock to keep on the watchlist.
From a broader perspective, price has been respecting a large ascending red channel for many years, reflecting a long-term upward structure despite periods of correction.
At the moment, the stock appears to be moving through a corrective phase, trading inside a shorter-term descending blue channel within the broader bullish structure.
What makes the current location especially interesting is that price is now testing an important blue support area that has been respected multiple times since 2018 without a successful breakdown.
This support also aligns with the lower boundary of the broader ascending channel, creating a strong technical confluence zone.
In addition, we can observe the development of bullish divergence, suggesting that downside momentum may be weakening and that the market could be preparing for a shift in direction.
From here, two scenarios become relevant:
→ Bullish scenario:
If support continues holding and buyers regain momentum, this area may become an attractive region to monitor for the next long-term bullish phase. However, for stronger confirmation, price would ideally need to break above the selected grey area around 3350, as this could signal the beginning of a broader recovery phase.
→ Bearish scenario:
If support eventually fails to hold and the broader channel loses structure, the corrective phase may extend and delay the long-term bullish outlook.
For now, the focus is not on predicting the reversal — but on watching whether price can defend support and reclaim key resistance levels.
This is a scenario-based analysis — not a prediction.
Disclaimer: This analysis is shared for educational purposes only. It reflects personal market observations and does not constitute financial advice or a trading recommendation.
Rayan Nasser
#Toshiba #Stocks #LongTermInvesting #TechnicalAnalysis #PriceAction #Investing #StockMarket #RiskManagement  Long
Long
 Long
Long
The Asian Technology Sector Is Still UndervaluedWhile U.S. technology stocks have dominated financial markets for several years, can opportunities still be found elsewhere in the world? Valuation data indeed shows that many Asian technology companies remain significantly cheaper than their American counterparts, despite strong market positions and favorable growth prospects.
One of the main indicators used to assess a company is the forward price-to-earnings ratio (forward P/E). Several Asian giants display multiples far below those observed in the United States. For example, SK Hynix, a major player in electronic memory, shows a forward ratio of around 9, compared with more than 20 for some U.S. sector leaders. Similarly, Kioxia Holdings, Samsung Electronics, and Sony Group are trading at relatively moderate valuation levels despite their strategic importance in the global semiconductor and electronics industry.
This discount is partly explained by a higher perceived risk regarding Asian markets. Geopolitical tensions, export dependence, and regulatory uncertainty lead international investors to demand a higher risk premium.
Asia today occupies a central position in the global technology value chain. The region concentrates a significant share of semiconductor production, electronic components, telecommunications equipment, and artificial intelligence-related technologies. Companies such as TSMC, MediaTek, and Foxconn play a crucial role in the global digital ecosystem and directly benefit from growing demand in computing, data centers, and AI.
The table below shows the ranking of global technology stocks by forward P/E, from the cheapest to the most expensive. Asia features stocks that remain relatively cheap based on the forward P/E ratio.
In addition, growth prospects remain strong. The rise of artificial intelligence, cloud computing, electric vehicles, and industrial automation should support revenues of Asian technology companies for many years. Yet their valuations remain lower than those of comparable U.S. firms, as shown in the table above.
For long-term investors, this situation may represent an interesting opportunity. The Asian technology sector combines solid fundamentals, a strategic position in the global economy, and still reasonable valuations. In an environment where some Western technology stocks trade at elevated levels, Asia appears as a credible alternative offering meaningful revaluation potential.
For example, below is Sony, whose forward P/E remains relatively low, along with an interesting technical structure and long-term bullish supports close to current price levels.
The chart below shows Sony Group weekly Japanese candlesticks with the long-term support role of the 200-week moving average.
The chart below shows Sony Group monthly Japanese candlesticks with the Ichimoku cloud acting as long-term support.
DISCLAIMER:
This content is intended for individuals who are familiar with financial markets and instruments and is for information purposes only. The presented idea (including market commentary, market data and observations) is not a work product of any research department of Swissquote or its affiliates. This material is intended to highlight market action and does not constitute investment, legal or tax advice. If you are a retail investor or lack experience in trading complex financial products, it is advisable to seek professional advice from licensed advisor before making any financial decisions.
This content is not intended to manipulate the market or encourage any specific financial behavior.
Swissquote makes no representation or warranty as to the quality, completeness, accuracy, comprehensiveness or non-infringement of such content. The views expressed are those of the consultant and are provided for educational purposes only. Any information provided relating to a product or market should not be construed as recommending an investment strategy or transaction. Past performance is not a guarantee of future results.
Swissquote and its employees and representatives shall in no event be held liable for any damages or losses arising directly or indirectly from decisions made on the basis of this content.
The use of any third-party brands or trademarks is for information only and does not imply endorsement by Swissquote, or that the trademark owner has authorised Swissquote to promote its products or services.
Swissquote is the marketing brand for the activities of Swissquote Bank Ltd (Switzerland) regulated by FINMA, Swissquote Capital Markets Limited regulated by CySEC (Cyprus), Swissquote Bank Europe SA (Luxembourg) regulated by the CSSF, Swissquote Ltd (UK) regulated by the FCA, Swissquote Financial Services (Malta) Ltd regulated by the Malta Financial Services Authority, Swissquote MEA Ltd. (UAE) regulated by the Dubai Financial Services Authority, Swissquote Pte Ltd (Singapore) regulated by the Monetary Authority of Singapore, Swissquote Asia Limited (Hong Kong) licensed by the Hong Kong Securities and Futures Commission (SFC) and Swissquote South Africa (Pty) Ltd supervised by the FSCA.
Products and services of Swissquote are only intended for those permitted to receive them under local law.
All investments carry a degree of risk. The risk of loss in trading or holding financial instruments can be substantial. The value of financial instruments, including but not limited to stocks, bonds, cryptocurrencies, and other assets, can fluctuate both upwards and downwards. There is a significant risk of financial loss when buying, selling, holding, staking, or investing in these instruments. SQBE makes no recommendations regarding any specific investment, transaction, or the use of any particular investment strategy.
CFDs are complex instruments and come with a high risk of losing money rapidly due to leverage. The vast majority of retail client accounts suffer capital losses when trading in CFDs. You should consider whether you understand how CFDs work and whether you can afford to take the high risk of losing your money.
Digital Assets are unregulated in most countries and consumer protection rules may not apply. As highly volatile speculative investments, Digital Assets are not suitable for investors without a high-risk tolerance. Make sure you understand each Digital Asset before you trade.
Cryptocurrencies are not considered legal tender in some jurisdictions and are subject to regulatory uncertainties.
The use of Internet-based systems can involve high risks, including, but not limited to, fraud, cyber-attacks, network and communication failures, as well as identity theft and phishing attacks related to crypto-assets.
 Education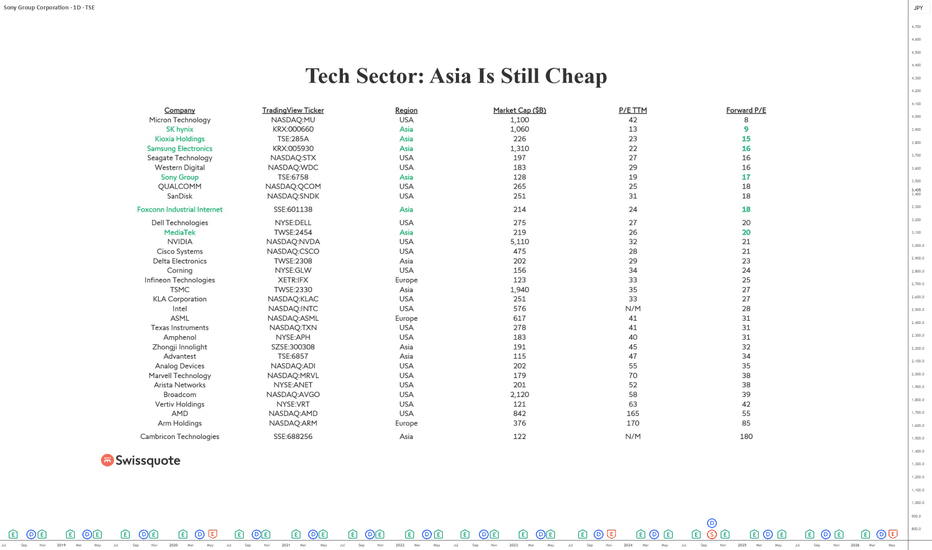
 Long
Long
 Long
Long
 Long
Long
M3 (2413) — Wave 4 Completion and Long-Term StructureM3 (2413) — A Decade-Long Correction May Have Ended | The Architecture of a Potential Supercycle Wave 5
This study examines M3 (TSE:2413) through a deep-time structural lens, highlighting what may be the most technically significant inflection point in the stock’s modern history. By contextualizing the price evolution since 2005 within an Elliott Wave framework, this analysis aims to illuminate the broader architecture that could guide the next multi-year phase.
🔹 Why This Moment Matters
For nearly a decade, M3 has been navigating an extended W–X–Y corrective structure following its major Wave 3 peak. This was no ordinary pause—it was one of the longest and most complex retracements ever recorded in this symbol.
Despite its depth, the correction respected the higher-timeframe trend impeccably:
Termination at the 0.5–0.618 Fibonacci cluster
Structure consistent with a completed higher-degree Wave 4
Price stabilization occurring precisely where long-term cycles often reset
Such convergence across timeframes is rare and often meaningful.
🔹 A Framework for What Comes Next
If Wave 4 has indeed completed, M3 may be entering the foundational phase of Supercycle Wave 5 , historically the most structurally powerful leg in an established growth trend.
This chart outlines two macro trajectories:
Primary Path (Institutional Scenario)
A measured, sustainable advance toward the 1.618 Fibonacci extension , aligning with classical Wave 5 proportion and long-term market symmetry.
Extended Path (Innovation Cycle Scenario)
A more ambitious arc projecting into the 3.618–5.618 zone , reflecting behavior seen in past secular expansion phases—particularly in companies whose growth reaccelerates after prolonged consolidation.
Both paths are illustrated with curvature rather than straight-line projections to better represent the non-linear acceleration patterns commonly observed in late-cycle impulsive structures.
🔹 What the Chart Shows
The completed W–X–Y pattern marking the Wave 4 trough
A multi-year prior impulse (Wave 3) whose Fibonacci relationships remain intact
Historical highs and structural inflection zones for orientation
Two potential long-term trajectories, color-coded for clarity
A convergence of geometry, momentum stabilization, and structural completion—all aligning at the current price region
This confluence forms a compelling technical environment rarely seen on high-timeframe charts.
🔹 Strategic Perspective
This analysis does not make deterministic predictions.
Instead, it provides a macro-structural framework for institutions, portfolio strategists, and long-horizon investors seeking to understand where M3 may be positioned within its secular growth cycle.
Episodes of prolonged corrective unwinding often precede decisive shifts in trend character. If this framework proves correct, M3 may be transitioning from one of its largest consolidations into one of its most expansionary cycles.
🔹 Final Note
This chart is for educational and analytical purposes only.
It does not constitute financial advice.
If you found this useful, feel free to comment with your interpretation of the Wave 4 structure.  Long
Long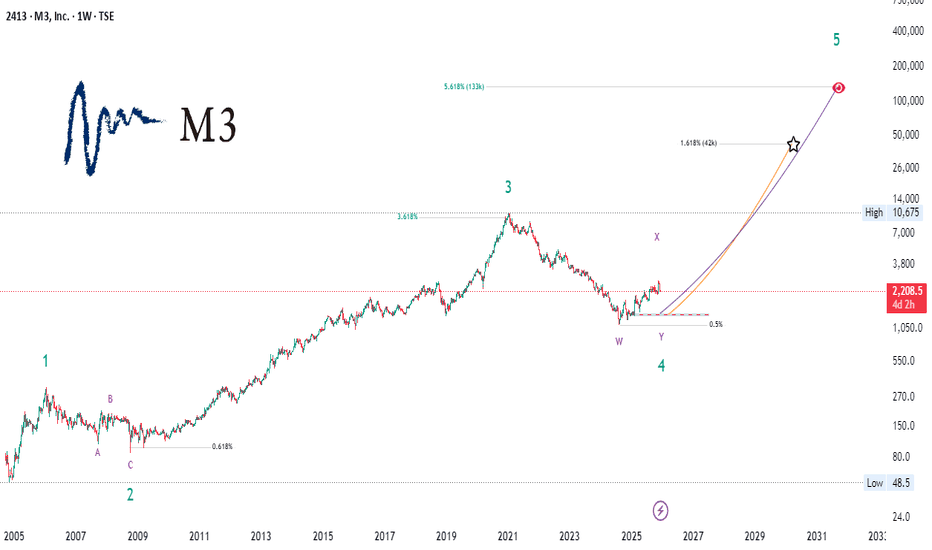
5802 (1D) — Sumitomo breaks ¥11,415 on the InP/HBM4 thesisTSE:5802
5802 (1D) — Sumitomo breaks ¥11,415 on the InP/HBM4 thesis
Sumitomo Electric Industries closes May 7 at ¥11,345 after a +14.60 % session on volume of 10.98M, opening at ¥10,710 and closing at session highs. The daily candle neutralizes the last active liquidity zone at ¥11,415 (Liquidity Zones), the only technical resistance the price had drawn above since March, and leaves the quote in technical air toward Fibonacci extension targets of the latest swing. Monthly and weekly structure remains fully intact — a near-decade lateral base between ¥1,000 and ¥1,700 broken in 2024, sustained expansion since with no single weekly close below the SuperTrend Core (¥8,433), and all EMAs stacked bullish across the three timeframes. The fundamental layer reinforces the read: Sumitomo is one of the few global producers with proprietary InP epitaxy capacity, the most critical step of the entire EML/CW laser supply chain for AI data infrastructure and HBM4 memory, and the session arrives with coherent movement across the rest of the chain (Furukawa +12.41 %, Accelink +8.93 %, YJ Semi +6.40 %, ASMPT +2.07 %), a signal of synchronized sector re-pricing rather than an isolated spike.
Monthly Analysis — the close at ¥11,345 keeps the parabolic structure active since 2024. The 2014-2023 lateral base between ¥1,000 and ¥1,700 broke up in 2024 and since then no single monthly candle has closed below the monthly EMA50. All five averages hold positive slope with clean 9>20>50>100>200 alignment, no bearish crossovers on any scale. Monthly MACD with histogram still expanding in positive zone, no acceleration loss. Monthly TRIX in active bullish cross. Monthly Multi Stochastic with slows in upper zone but embedded, reading as sustained trend strength rather than exhaustion. Monthly RSI 14 high but with no bearish divergence over the latest highs. Monthly Accumulation/Distribution rising in line with price, no visible distribution. Macro read: primary parabolic trend fully active, no structural top signal on this horizon.
Weekly Analysis — the close holds well above the entire weekly EMA stack with 9>20>50>100>200 alignment and positive slope across all five. The structure chains higher highs and higher lows from ¥4,500 without exception. Weekly MACD with positive histogram and bullish cross alive. Weekly TRIX in bullish bias with expansive momentum. Weekly Multi Stochastic with slows glued in upper zone but embedded, fasts relaxing slightly as expected after the daily impulse candle. Weekly RSI 14 in neutral-bullish zone without saturation. Weekly Accumulation/Distribution rising, aligned with monthly read. Intermediate read: fully bullish structure, momentum still in favor, no reversal signal.
Weekly SuperTrend Analysis — the dedicated capture isolates the SuperTrend Core (Balanced 70) on the weekly, holding from ¥8,433 with not a single touch piercing it in over a year. Every weekly correction of the last twelve months has rested cleanly on the indicator's green line and resumed trend, with no red reversal points generated. The price–SuperTrend distance of around +35 % reflects the verticality accumulated over the last months but the indicator continues to track the rally with positive slope. Loss of ¥8,433 on weekly close would be the first structural event that breaks the underlying bullish cycle — key reference for tacit invalidation of the multi-month thesis.
Daily Analysis — close at ¥11,345 with full EMA stack: EMA9 10,344 / EMA20 10,128 / EMA50 9,589 / EMA100 8,570 / EMA200 7,021. All five averages hold positive slope with no bearish crossovers, clean 9>20>50>100>200 alignment. Price–EMA200 distance of around +61 % reflects primary trend maturity but still with active expansion. The May 7 candle opens at 10,710 and closes at session highs of 11,345 on volume of 10.98M, clearly above the recent average — institutional breakout confirmation above the liquidity zone at 11,415 that had acted as ceiling since March. Daily MACD at 238.8 above Signal 192.1 with histogram +46.7 — momentum expanding, no slope loss. Daily TRIX Fast 0.4 above Slow 0.3 with histogram +0.1, bullish bias and expanding momentum per indicator panel. Daily Multi Stochastic by period: Stoch 89 = 83 ▲, Stoch 50 = 69 ▲, Stoch 14 = 59 ▲, Stoch 5 = 43 ▼ — three slow periods in bull zone, the fast cooling as logical after the candle. Latest 14/50 bullish cross dated 04-22-2026. Daily RSI 14 at 63.2 with momentum +13.2 over 50, neutral zone with bullish bias, no structural overbought. Daily RSI 2 at 90.2 — short-term extreme, expected after a +14.60 % candle. Daily Accumulation/Distribution at +278.2M, institutional flow accumulating sustainably with no visible distribution.
Liquidity Zones Analysis — the dedicated Liquidity Zones capture reports 5 active, 1 tested and 4 taken zones. The nearest resistance was marked at ¥11,415 (Active) over the March impulse on volume 11.197M, exactly where today's candle closes — clean neutralization with close above on institutional volume. The nearest support sits at ¥8,490 at -25.18 % from current price on volume 10.748M, zone already tested in April. Additional active supports staircased: ¥8,380 (Active, volume 8.571M), ¥7,165 (Taken in February on volume 9.57M, already consumed), ¥6,070 (Active 7.364M), ¥5,990 (Active 7.213M) and ¥5,628 (Active). The liquidity map leaves price in immediate technical air above (no zones drawn until new highs) and with a heavily staircased support pyramid below, typical of a name in price discovery phase.
ZigZag / Fib Analysis — the dedicated ZigZag capture identifies recent pivots and draws the most relevant operative swing in the ¥9,500–11,200 range, formed between the April corrective low and the prior March high. Active Fibonacci extensions project three continuation levels: 1.272 at ¥12,700 (first natural technical destination), 1.618 at ¥13,500 (classic full bullish leg target) and 2.000 at ¥14,400 (extended target if weekly close holds firm and momentum reactivates). The indicator's history shows that when price breaks a liquidity zone on volume, it usually reaches at least the 1.272 extension before the first significant pullback — pattern compatible with this idea's main bullish scenario.
Fundamental layer — Sumitomo Electric Industries is a Japanese industrial conglomerate headquartered in Osaka, founded in 1897, member of the historical Sumitomo keiretsu and one of the largest nodes in the Nikkei. The group operates five major business lines: Automotive (largest global supplier of wiring harnesses, supplying Toyota, Nissan, Honda, Mazda and virtually every Japanese OEM, in accelerated transition toward high-voltage EV architectures), Energy & Infrastructure (high and ultra-high voltage cables, direct beneficiary of the capex cycle on grid infrastructure for renewable integration and datacenter buildout), Information & Communications (fiber optics, optoelectronic devices, InP/GaAs compound semiconductors — the strategic line for this thesis), Industrial Materials (sintered products, hardmetals with real technological barriers) and Electronics (flexible PCBs). Within the bottleneck map of photonics for AI infrastructure, Sumitomo holds the most critical step of the entire chain: InP epitaxy. It is one of barely three or four global players alongside Furukawa, JX Nippon Mining and, to a lesser extent, IQE, capable of producing Indium-Phosphide wafers of quality for optoelectronic devices at industrial scale. InP epitaxy is the most severe physical bottleneck of the sector because it requires enormous capex and highly specialized processes (MOCVD for MQW layers), indium is a scarce metal with structurally constrained supply, and hyperscaler qualification cycles for new materials run 12 to 24 months. Active catalysts: acceleration of hyperscaler AI capex (estimated >$300B globally in 2026, translating directly into demand for high-speed optics and InP wafers), HBM4 / optical I/O transition multiplying CW and EML laser demand per system, photonics reshoring limiting dependency on Chinese suppliers in critical components, strength of the automotive line with high-voltage EV architectures, and weak yen favoring export competitiveness. Relevant risks: significant concentration in automotive and dependency on Toyota, long-term substitution by silicon photonics although the transition is slow and still requires external CW lasers, potential yen reversal, and post-impulse sector volatility logical after a +14.60 % candle. Synchronized sector confirmation in the same session — Furukawa +12.41 %, Accelink +8.93 %, YJ Semi +6.40 %, ASMPT +2.07 % — validates that the market is re-pricing the InP/HBM4 chain as a coherent block, not Sumitomo as an isolated spike.
Key levels
- Neutralized resistance 11,415 — last active liquidity zone, broken today with close above on volume
- Target 1 12,700 — Fib 1.272 extension of the 9,500–11,200 swing, first technical continuation target
- Target 2 13,500 — Fib 1.618 extension, classic full bullish leg target
- Extended target 14,400 — Fib 2.000 extension, valid if weekly momentum reactivates
- Support 1 10,500–10,800 — breakout zone and Daily EMA9-EMA20 cluster, first healthy pullback area
- Support 2 9,589 — Daily EMA50, base of the March-April lateral consolidation
- Support 3 8,490 — strong liquidity zone, first serious alert if lost
- Partial invalidation: daily close below 9,589 would break impulse speed without invalidating the multi-month thesis
- Structural invalidation: weekly close below 8,433 (Weekly SuperTrend Core) would cancel the underlying bullish cycle
Setup Rating — 4.5/5 ⭐⭐⭐⭐⭒ (Bullish with operative patience for pullback)
✅ Positive factors
- Monthly, Weekly and Daily EMA stack impeccable, no bearish crossovers on any scale
- Breakout candle above 11,415 on volume clearly above average — textbook institutional confirmation
- Daily Accumulation/Distribution at +278.2M and rising across all three timeframes, no visible distribution
- Slow stochastics (Stoch 89 and Stoch 50) embedded in upper zone on Monthly and Weekly — trend strength intact
- Daily MACD histogram still expanding — primary momentum has not lost slope
- Daily TRIX in active bullish cross with expansive momentum
- Weekly SuperTrend Core holding from ¥8,433 with not a single touch, very solid structural base
- Liquidity map with price in technical air above and heavily staircased support pyramid below
- Synchronized sector confirmation: Furukawa +12.41 %, Accelink +8.93 %, YJ Semi +6.40 % in the same session
- Fundamental narrative (InP epitaxy / HBM4 bottleneck) fully active with macro catalysts in favor
⚠️ Cautions
- Daily RSI 2 at 90.2 — short-term overbought logical after the candle but demands patience for clean entry
- Daily Stoch 89 at 83 — upper zone, proximity to probable short-term pause
- +14.60 % travel in a single session with no intermediate pullback — accumulated elasticity demands digestion
- Daily price–EMA200 distance ~+61 % — very high extension on the long-term dynamic, typical of mature trends
👍 Bullish scenario (most likely)
Technical pullback to the 10,500–10,800 cluster (breakout zone and Daily EMA9-EMA20) bought with volume and RSI 2 / Stoch 5 reset. Daily close defending 10,500 validates a second bullish leg toward 12,700 (Fib 1.272) on a 2-4 week horizon, with natural extension to 13,500 (Fib 1.618) if weekly close holds firm above 11,415. Variant: sideways consolidation between 10,800 and 11,500 while short overbought digests, resetting momentum without losing structure, and subsequent continuation above 11,500 reactivating the primary impulse.
👎 Bearish scenario (healthy correction, not invalidation)
Loss of 9,589 (Daily EMA50) on daily close opens intermediate correction toward 8,490 (strong liquidity zone). This correction would not break the multi-month structural thesis — Daily stack would remain intact above EMA100 and A/D would not show distribution as long as price holds above the Weekly SuperTrend (8,433). Only a weekly close below 8,433 would be the first event forcing review of the structural breakout narrative.
Direct continuation or pullback to breakout before the next leg? 👇
 Long
Long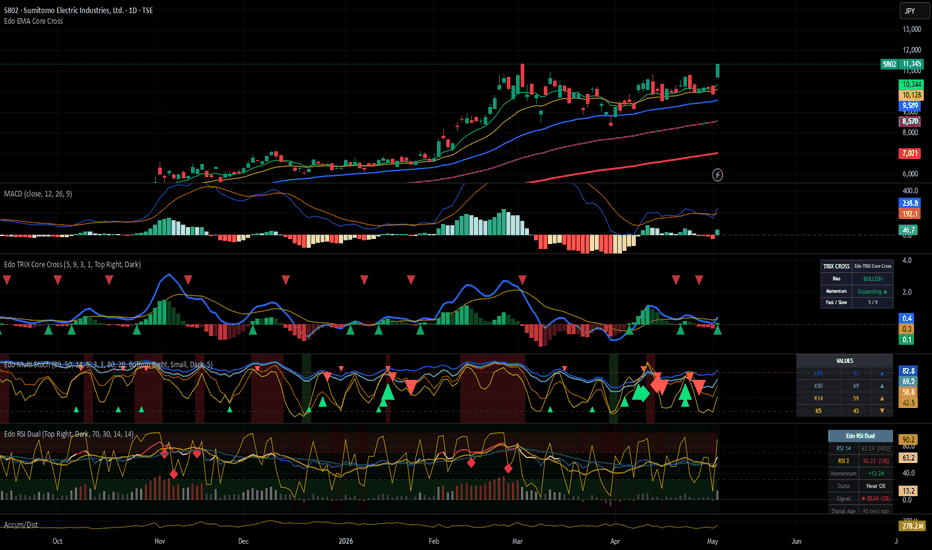
 Long
Long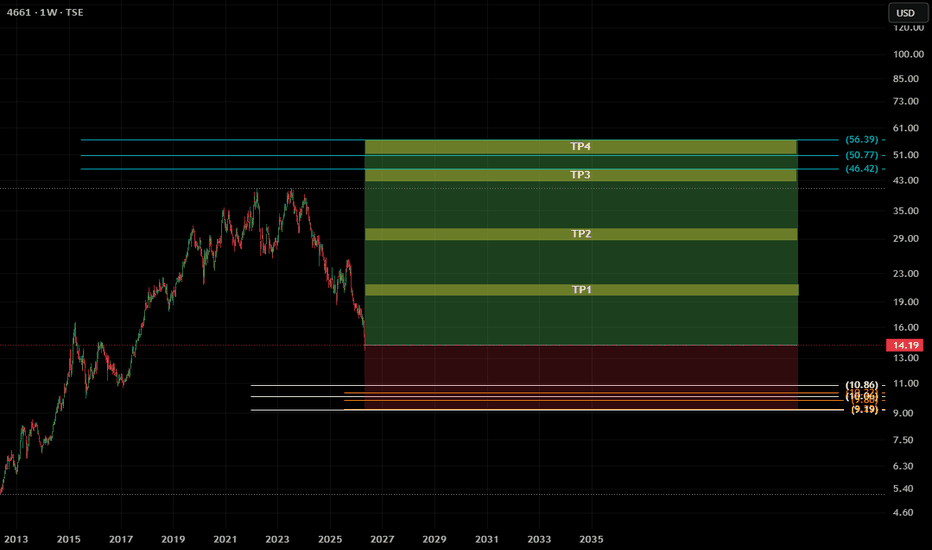
$ORIENTAL LAND CO , IDEAOriental Land Co — Weekly structure after a multi-year distribution. Watching for a full recovery cycle.
$4661 · TSE · 1W
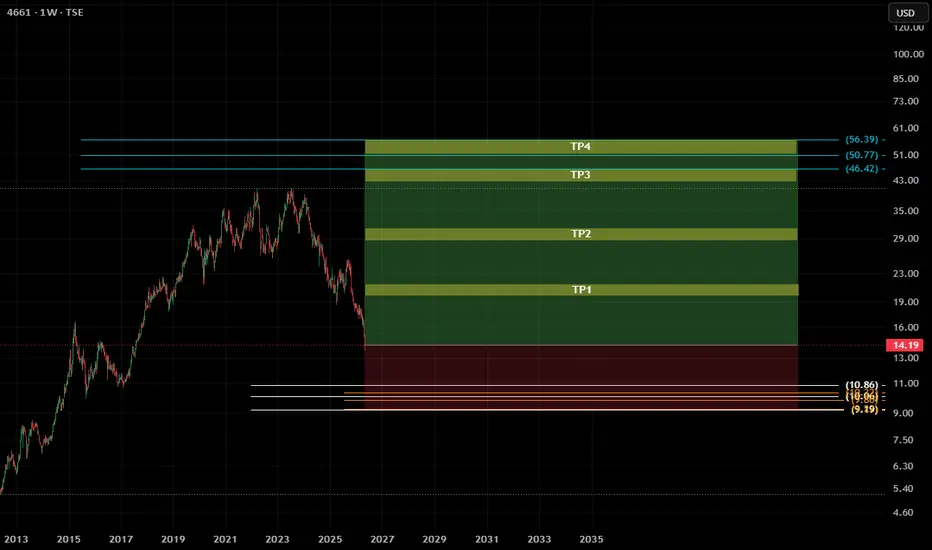
Price completed a significant topping pattern between 2018 and 2024, followed by a sharp markdown phase. Current price is sitting just above the invalidation zone, at what the EQC system identifies as a potential long-term re-accumulation level.
The setup maps four distinct recovery targets based on prior structure:
TP1 — first meaningful resistance from the 2022 consolidation range
TP2 — mid-distribution zone, where sellers previously absorbed demand
TP3 — upper distribution boundary
TP4 — full cycle recovery, testing the 2022 highs
The invalidation zone sits clearly below current price. A weekly close inside the red region removes the thesis entirely.
This is a long-duration position idea — the timeframe on this setup is measured in years, not weeks. Position sizing matters more than entry precision at this scale.
No leverage. Rules-based. Non-discretionary.
Follow, Boost, Thank You!
⚠️ Financial Disclaimer: This post is not financial advice. I am not your financial advisor, your life coach, or your legally responsible adult. Always do your own research and never trade based solely on internet comedy.  Long
Long
1980 (Japan) - Dai-Dan Is A Powerhouse On SaleDai-Dan Co Ltd has been an absolute beast lately, putting up a gain of over 200% in just a year. Based in Japan, they specialize in the high-end electrical and HVAC systems that power data centers and hospitals. It is exactly the kind of unglamorous, essential business that trend followers love to see leading the market. Sometimes boring is good :)
The fundamental story is backed by some serious weight. Profits have essentially doubled over the last year, and their order book is sitting at record levels due to the massive demand for infrastructure. They recently executed a 3-for-1 share split and boosted their dividend, which often leads to a bit of "sell the news" profit-taking.
Looking at the chart, the price has drifted right back into a major value area . It is currently testing the 50-day SMA , which has acted as a floor throughout this entire uptrend. The RSI has reset from overbought territory down to a neutral 46, giving the stock some room to breathe before its next move. While the MACD still shows some downward momentum, the selling pressure appears to be drying up as it hits this support level.
Might be worth a watch.
..................................................
PLEASE NOTE: Nothing I post is trading advice. All investing involves risk, and past performance doesn’t predict future results. Trends can and do end. For 2026 , my goal is to try and post one new asset each trading day. Something outside the usual gold, silver, BTC, or big tech names. I like to find stocks worldwide showing steady trends with some good gains, a recent pullback, and signs of renewed strength. I don’t necessarily hold positions in these. They are simply companies I find interesting at the time of posting. I’ll often revisit them within a week to see how they went and share any updates. If you enjoy these posts, please BOOST and FOLLOW ME to discover more under-the-radar stocks and businesses from around the world.
.................................................. ITOCHU (8001): Volume Profile and Deep Value AnalysisUsing the 4-hour chart, we combine Periodic Volume Profile with the 100 EMA to identify institutional value areas.
Migrating POC: The 3-month Point of Control (POC) has been steadily rising. It is currently at the 2,192.0 JPY level, indicating the market is actively accepting higher prices as the new fair value.
Price Rejection: The price is refusing to fall below this new POC zone. Buyers are consistently stepping in, treating the ascending trendline and POC as dynamic support.
Historical Confluence: The 100 EMA aligns perfectly with a High Volume Node (HVN) block situated between 2,029.0 JPY and 2,063.2 JPY. This acts as our ultimate structural support in case of a broader market shock.
The Trade Plan (Long Bias)
Given the strong volume accumulation and deep value fundamentals, the bias is strictly LONG.
Entry Zone 1 (Aggressive): 2,192.0 JPY – 2,230.5 JPY (Buying the current pullback into the rising POC and short-term trendline).
Entry Zone 2 (Conservative): 2,063.2 JPY (Bidding at the HVN + 100 EMA confluence in case of a sudden liquidation event).
The Buffett&Munger Perspective: Deep Value & Margin of Safety
As Charlie Munger taught, volatility simply misprices great businesses. Itochu’s wide economic moat and resilient cash flows present a textbook deep value setup against current macro headwind.
High Profitability: Consistently delivering a globally competitive ROE of >15%, paired with a strong Greenblatt earnings yield of ~6.5%.
Discounted Valuation: Trading at a Trailing P/E of ~17.0x (well below the estimated fair value of 26.2x) and a highly efficient P/S of ~1.05x.
Resilience & Returns: A solid balance sheet (Quick Ratio ~0.96) provides a true "margin of safety" against market shocks. Additionally, a conservative 36% payout ratio easily sustains its ~1.8% dividend yield (backed by 11 consecutive years of hikes).
Target: I will trail my stop loss until we see a couple of daily closes below 100EMA.
Stop Management: Initial hard stop is a daily close below 1,915.0 JPY. Once in profit, I will trail the stop loss until we see a couple of daily closes below the 100 EMA.  Long
Long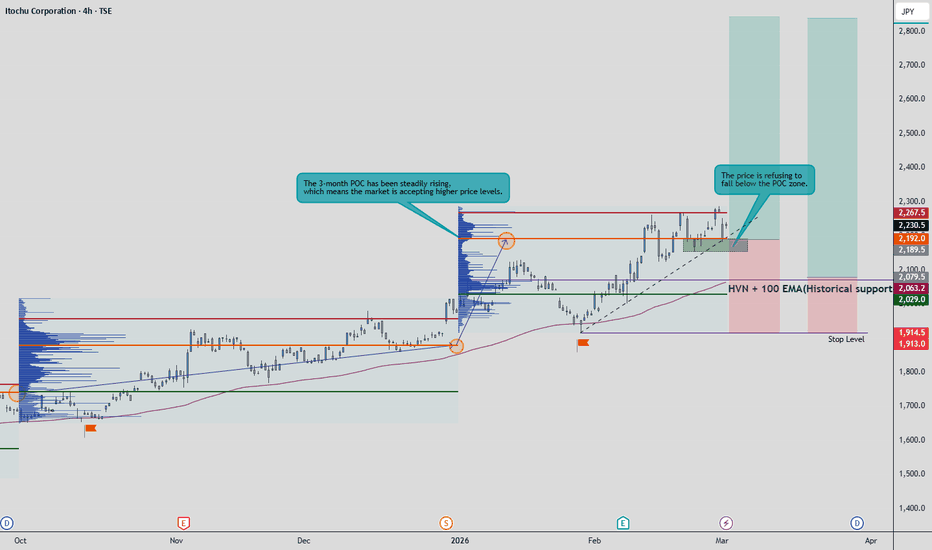
 Long
Long
 Long
Long
 Long
Long
 Long
Long