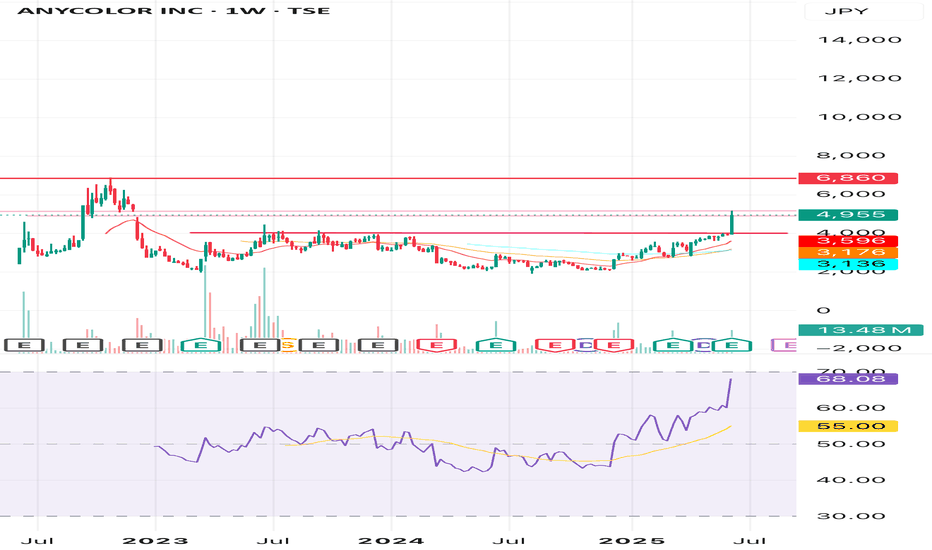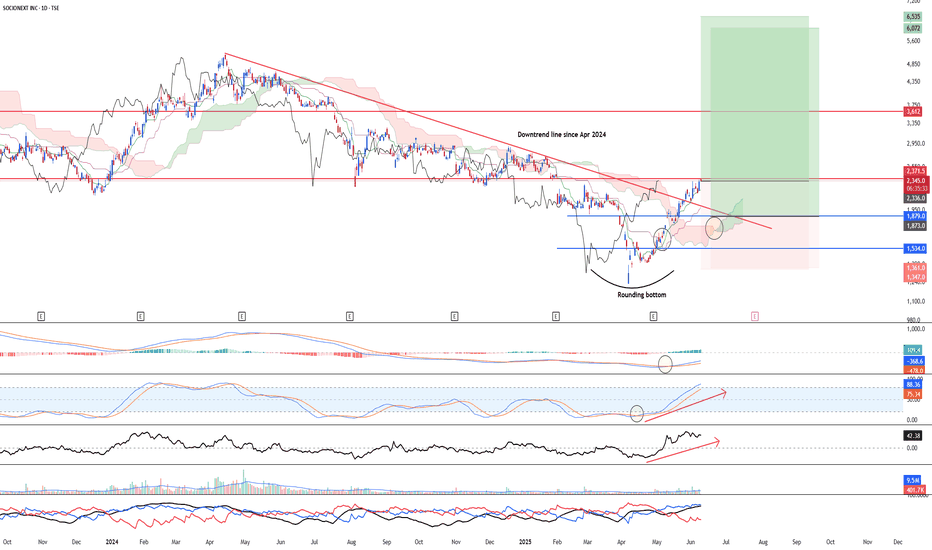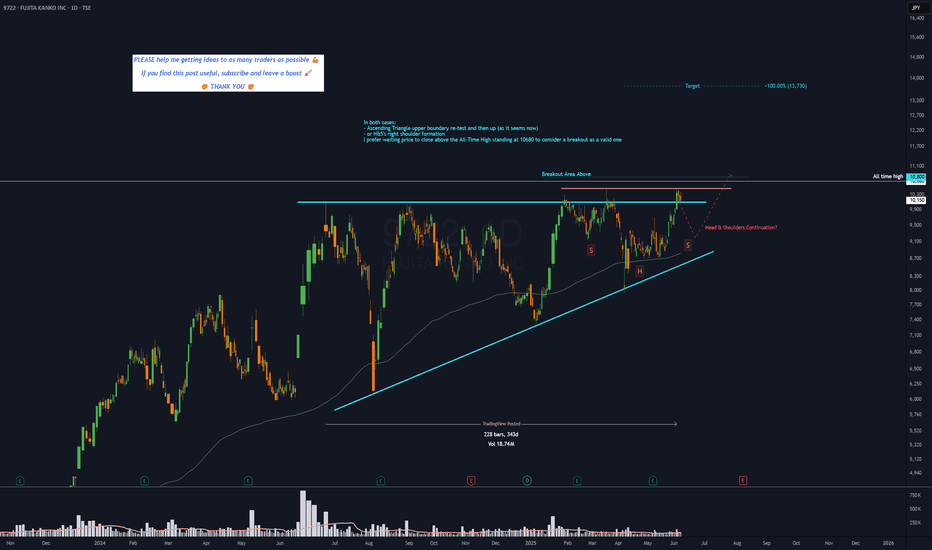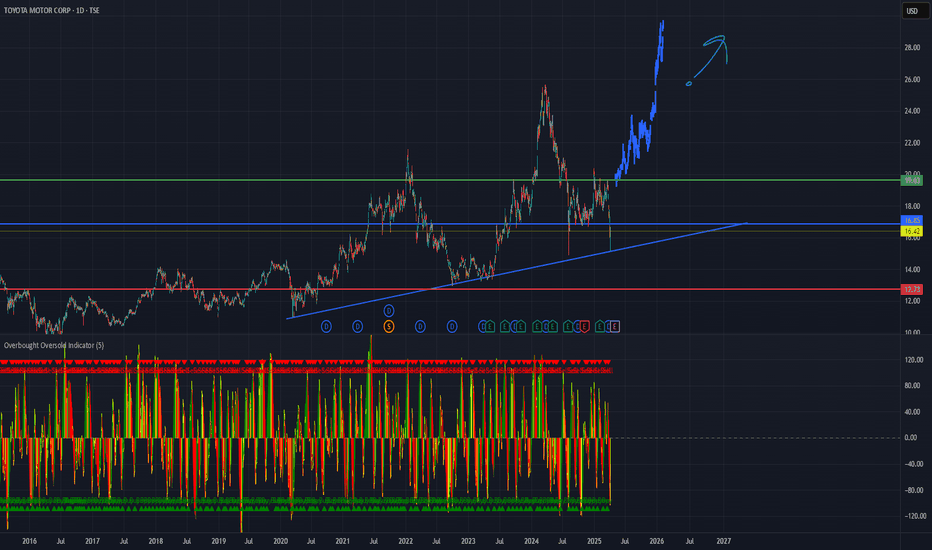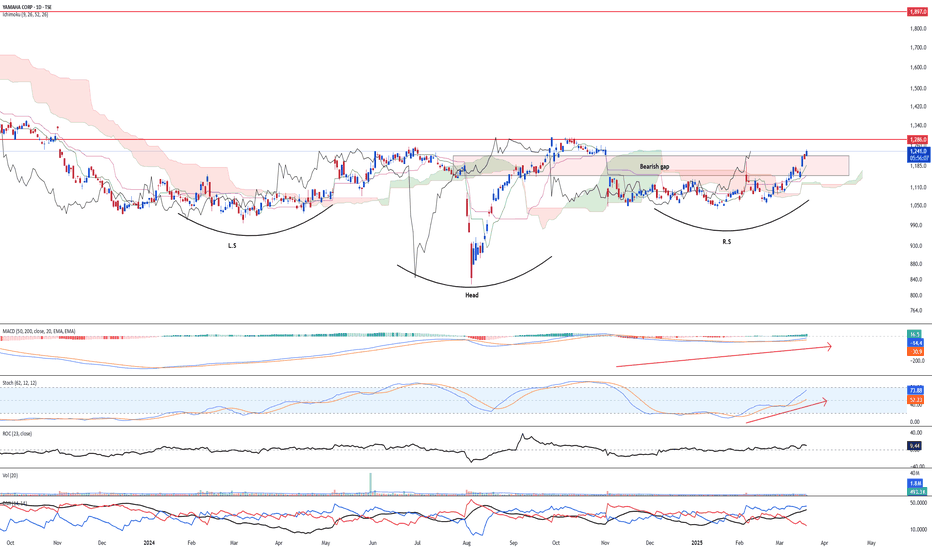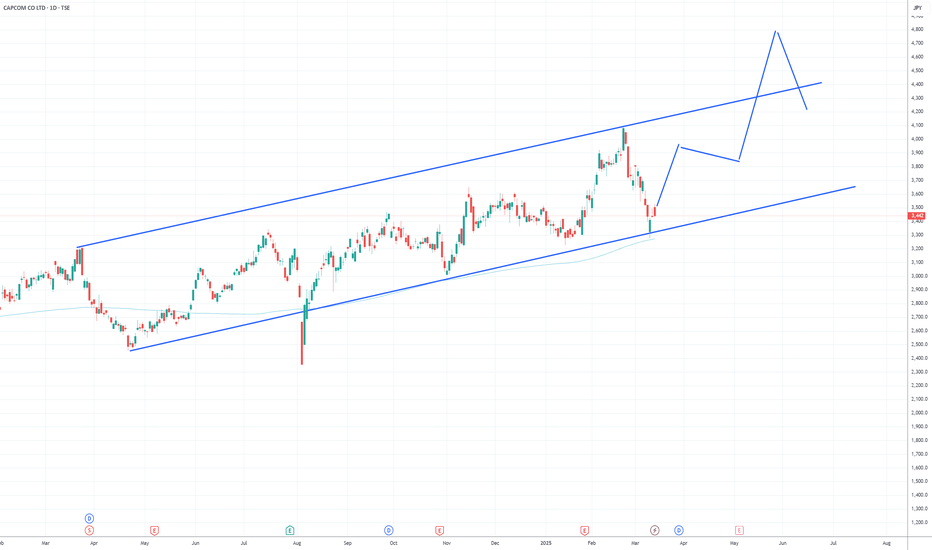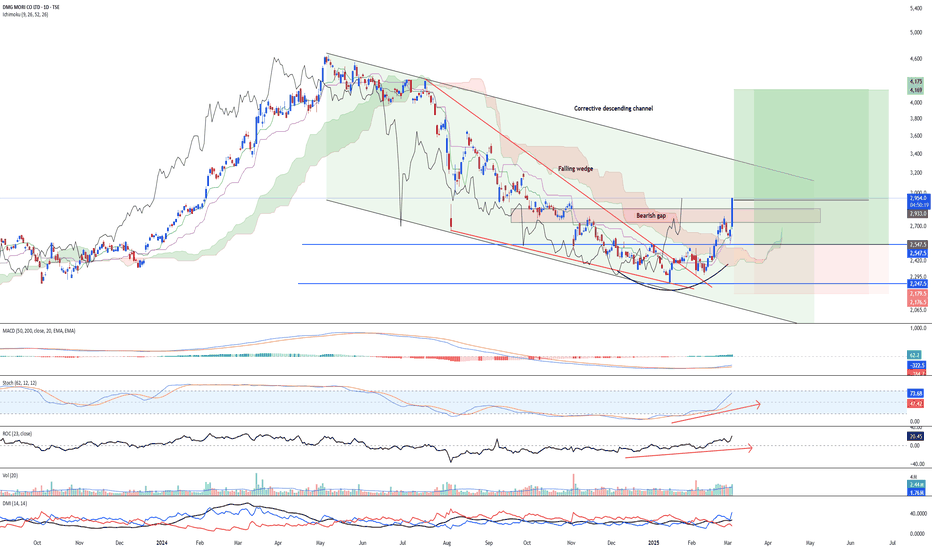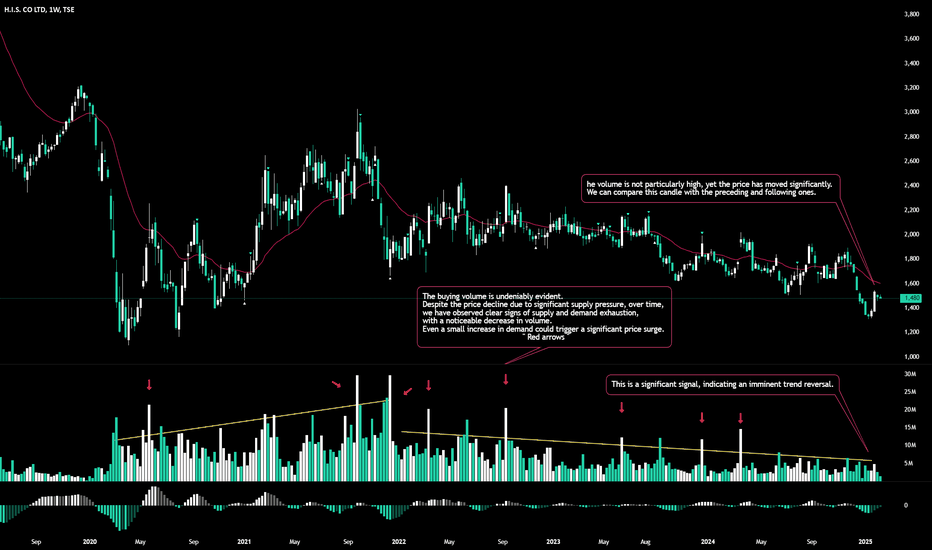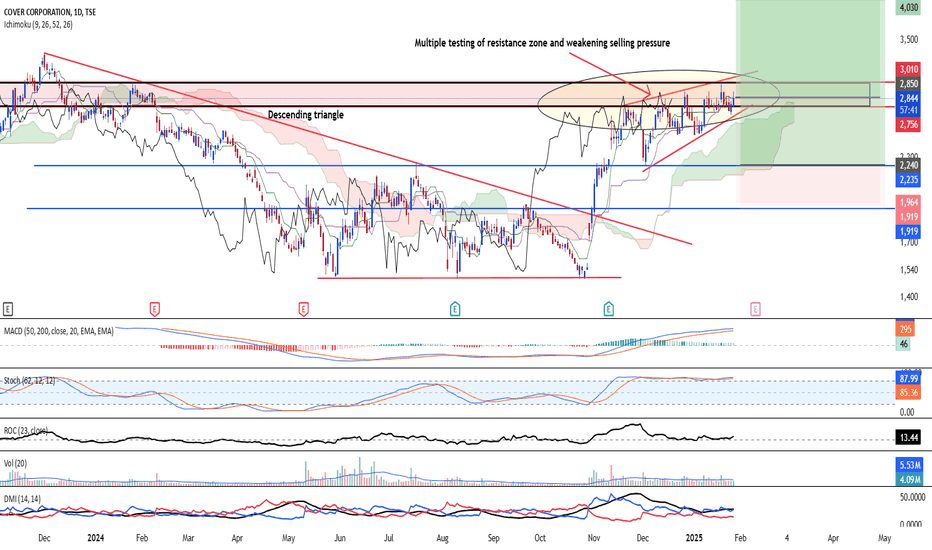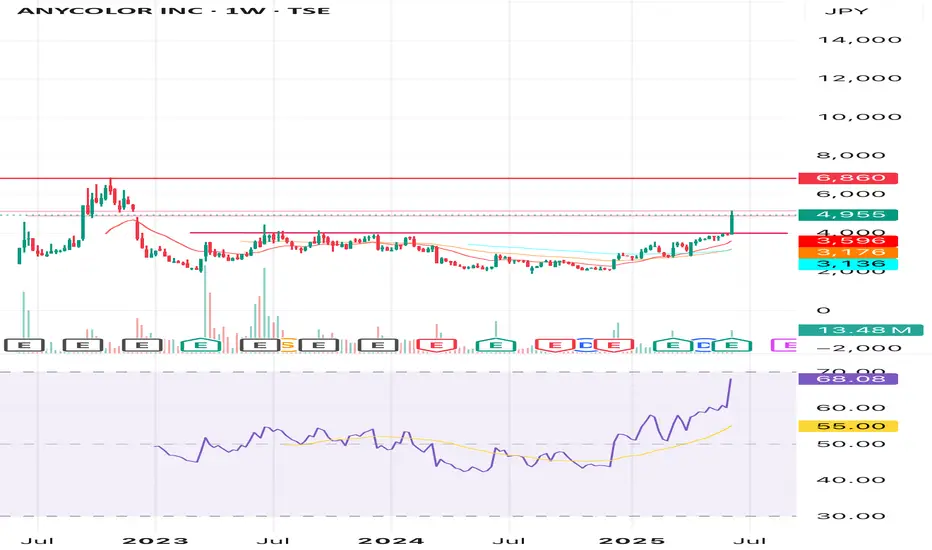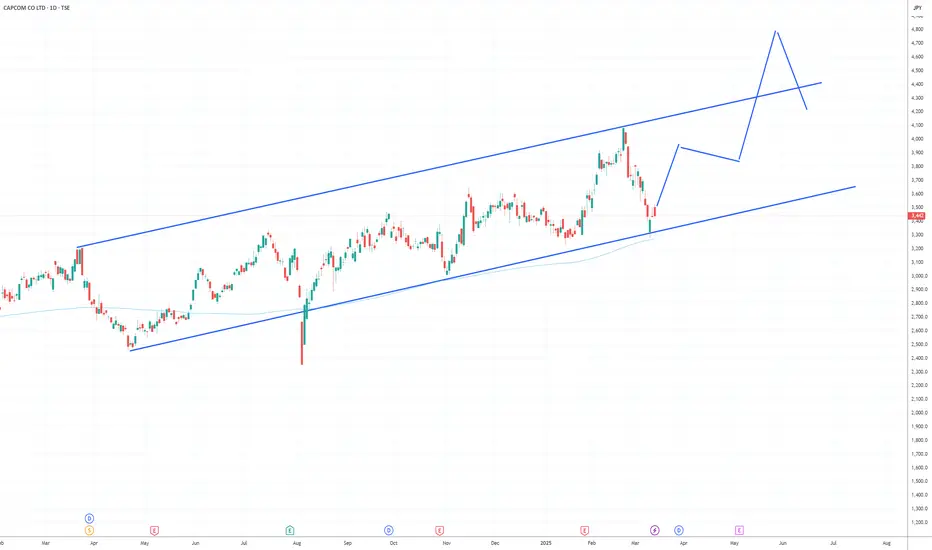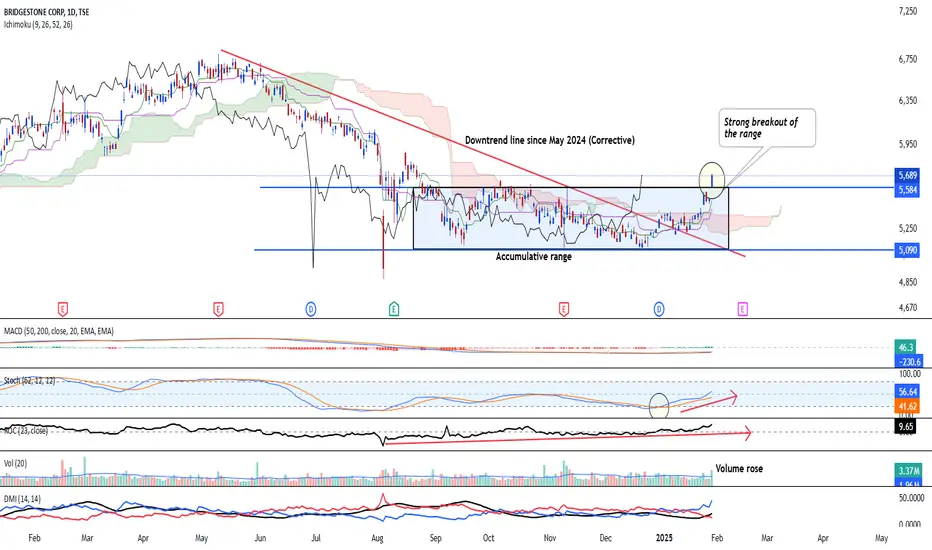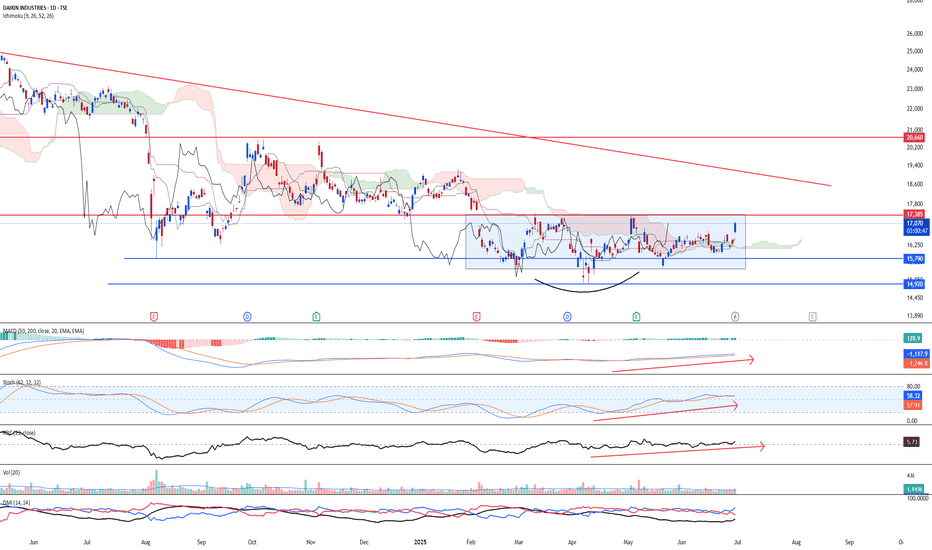
Typical chart pattern revealing institutional capital flow.This is a classic chart pattern that provides clear signals about how large investors enter and exit their positions.
Neither you nor I can pinpoint the exact bottom, but we can visualize a price zone referred to as the bottom range.
Here, we observe high trading volume, with price movements confined within a certain range. By analyzing volume, we can better understand how institutions accumulate and distribute their holdings.
I am not advising you to invest in any particular stock.
Investing always carries risks, and it's crucial to manage risk and allocate capital appropriately based on your personal circumstances.
Wishing you successful and profitable trades!
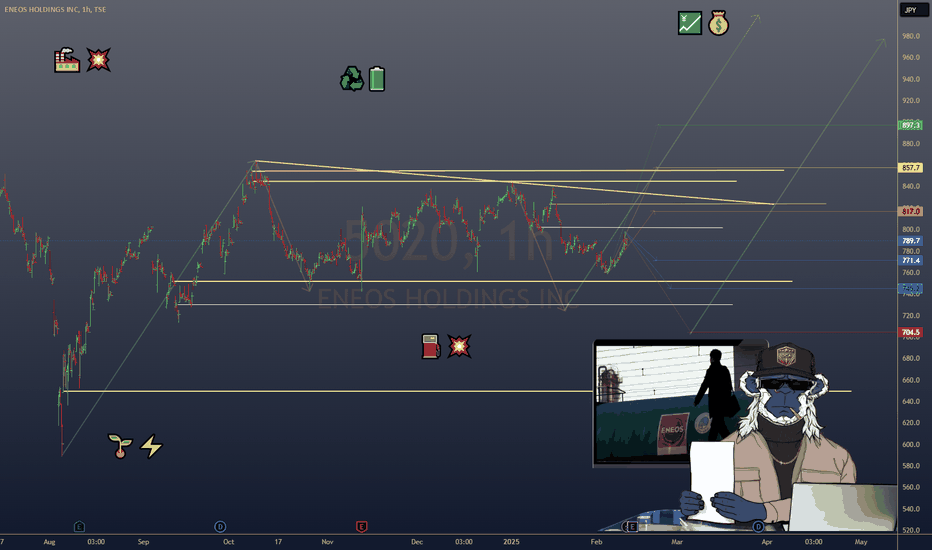
$5020.T ENEOS HOLDINGS: REVENUE GROWTH, MAJOR IPO ENEOS HOLDINGS: REVENUE GROWTH, MAJOR IPO & DECARBONIZATION STRATEGY
1/8
Big News: Eneos Holdings ($5020.T) reported ¥14.97T revenue for FY 2024 (+9.8% YoY) thanks to higher oil prices & solid refining demand. They’ve also announced a massive JX Advanced Metals ($JXAM) IPO worth up to ¥460B—Japan’s largest in 7 years! 🏭💥
2/8 – EARNINGS SNAPSHOT
• FY Net Income: ¥320.5B (↓12% YoY) due to rising costs & green investments 🌱⚡️
• Q3 Net Income: ¥85.4B (+3% QoQ) on cost optimization + refining margin boost
• Dividend: ¥22/share—they’re not skimping on shareholder returns 💹💰
3/8 – SIGNIFICANT FINANCIAL EVENTS
• JXAM IPO coming Mar 19, 2025—selling 50.1–58% stake
• Could raise $2.6– SEED_TVCODER77_ETHBTCDATA:3B —funding Eneos’ decarbonization pivot & fueling shareholder value 🚀
• Market reacted positively (+1% in Eneos stock), while broader Japanese market stayed flat ⚖️
4/8 – SECTOR COMPARISON
• Valuation: P/E ~8.5 vs. global oil refiners (~10.2) & metals (~12.1) 🔎
• Revenue Growth: +9.8% outpacing Shell (6.2%) & ExxonMobil NYSE:XOM (7.8%), but below BHP (12.4%)
• Undervalued? P/B ~0.9 vs. sector avg. 1.3, EV/EBITDA 6.8 vs. peers at 7.5. Looks attractive! 🔥
5/8 – RISK FACTORS
• Oil Price Volatility: Refining margins can flip on a dime ⛽️💥
• Geopolitical Tensions: Japan relies heavily on energy imports 🌏
• Energy Transition Costs: ¥150B budget for renewables—major capex needed ♻️🔋
• JXAM IPO Execution: A poor market reception = potential stock hit ⚠️
6/8 – REGULATORY & DECARBONIZATION
• Japan targets net-zero by 2050—Eneos faces higher compliance costs 🌐
• Carbon capture & hydrogen investments: Could future-proof Eneos, but short-term margins may tighten 🤖⚡️
7/8 – SWOT HIGHLIGHTS
• Strengths: Diversified (refining + metals + renewables), top-tier Japanese refiner 🏆
• Weaknesses: Profit margin (2.1%) lags peers, heavy capex for transition 😬
• Opportunities: JXAM IPO frees capital; renewables & hydrogen for growth 🌱💡
• Threats: Shift away from fossil fuels, market skepticism 🚫⚡️
8/8 Where do you see Eneos in 2025?
1️⃣ Bullish—Decarbonization + IPO = huge upside! 🐂
2️⃣ Cautiously Optimistic—Valuation looks good, but risks are real 🤔
3️⃣ Bearish—Oil refining can’t outrun global transitions 🐻
Vote below! 🗳️👇
Bullish continuation is in sight TSE:6677 SK electronics is looking at a possible continuation after 1.) It gapped up from immediate bottom and broke out of the falling wedge on good earnings. To add on, the stock's bullish momentum is back after long-term MACD rose from the bottom after it has perfromed a crossover. Histogram is positive. Stochastic confirmed the oversold crossover and 23-period ROC rose strongly.
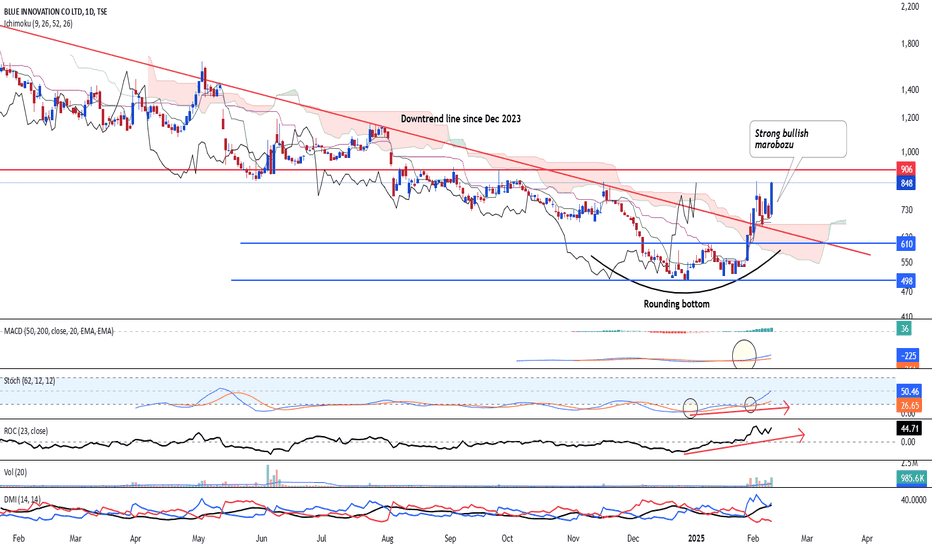
Bottoming out with strong buying pressureTSE:5597 Blue innovation is looking at a strong bottoming out reversal as strong bullish pressure is seen breaking out of the 1-year downtrend line which started since Dec 2023. Furthermore, the long-term MACD has crossed below, in tandem with stochastic showing "Rising oversold crossover". 23-period ROC has also risen above the zero line.
Hence, mid-term target is at 1,362.
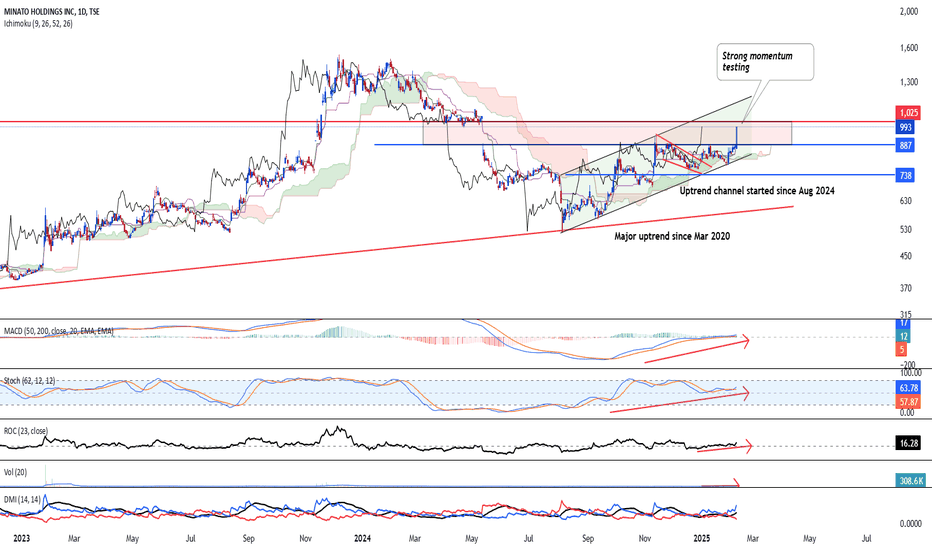
Resuming the upside momentumTSE:6862 is looking at a strong upside resumption after strong bullish marobozu enters the bearish gap resistance zone at 887-1025. Price action is strong as major uptrend remain intact since Maarch 2020 and secondary uptrend channel since August 2024 is sustaining well.
Ichimoku shows a strong bullish uptrend signal. Long-term MACD is showing sustained long-term upside momentum. Stochastic managed to stay elevated above the midpoint 50-level. 23-period ROC is rising above the zero line. Directional movement index shows strong bullish strength confirmation.
If there's a correction, 738 will the major support to watch for a rebound. long-term target is at 2,000
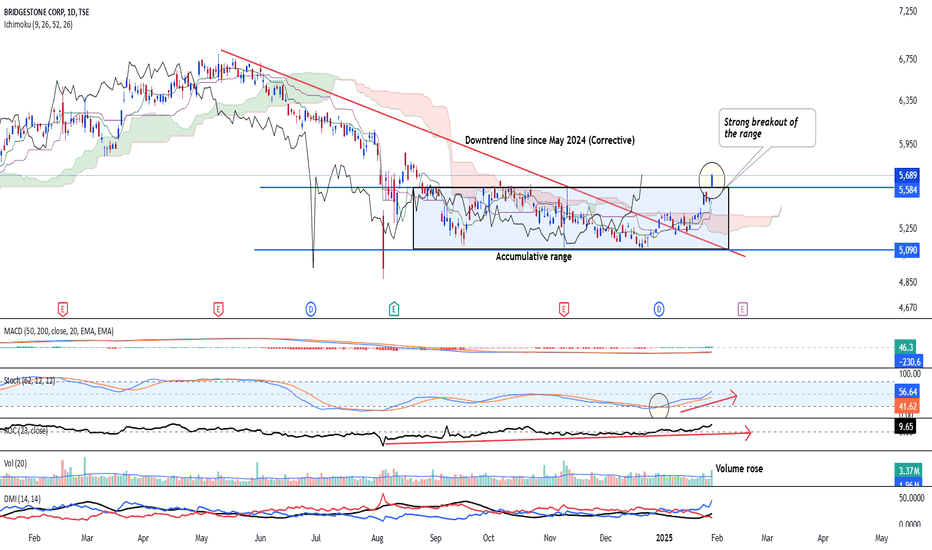
Bridgestone is looking at upside resumption TSE:5108 Bridgestone's major trend of 10 years has always been strong and recent correction which started in May 2024 seems to be finished after the stock has closed above the overhead resistance and downtrend line. Furthermore, the break above the key support turned resistance at 5,584 is strong, which sees a new high.
Momentum is back to the upside especially after the mid-term stochastic oscillator has confirmed the oversold crossover and the 23-period ROC has risen above. Additionally, the volume confirms the break up and Directional movement index suggest that the bullish strength is strong.
Ichimoku shows a clear bullish uptrend. Target over the mid-term will be at 6,400
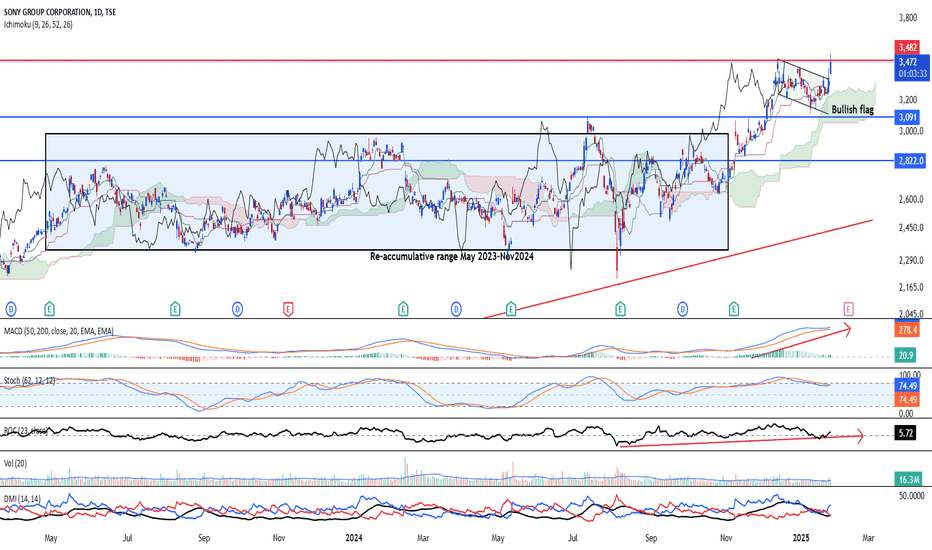
Steady momentum for SonyTSE:6758 Sony is exploring a possible continuation to the upside after the stock has confirmed the breakout from the re-accumulation range. All long, mid, and short-term momentum indicators indicate a steady flow of upward momentum. The Ichimoku shows a consistent uptrend confirmation, with prices trending above all five indicator lines, and price action remains strong after two consecutive breaks above the bullish flag, affirming the upside.
Start of a new uptrend? Vtuber back into the trendTSE:5032 is looking at a strong bullish upside after breaking above the downtrend line that started in Oct 2022. Furthermore, the stock has formed a series of higher highs and lows and successfully closed above the gap resistance turned support zone of 2721-3020. All momentum indicators are seen rising, which confirm the bullish momentum. Trend is strong and the target may reach beyond 5,000 psychological level in the longer-term period.
Corrective downtrend has ended - Upside coming backTSE:6315 Towa Corp's uptrend has been intact since March 2020. Despite a correction since 27 May 2024, the correction has come to an end after the stock broke above the falling wedge. Furthermore, the latest price action shows a closure above the ichimoku Kumo, which confirms the three bullish golden cross.
The latest cross above 1,921 resistance turned support marks the possible start of a renewed uptrend, where higher high and low was spotted.
Momentum is strong across the Long-term MACD, mid-term Stochastic Oscillator, where it has confirmed the oversold crossover. Moreover, 23-period ROC has risen strongly above the zero line.
Volume remain in a healthy expansion and directional movement index is showing strong positive bullish strength.
Hence, we are considering buying on spot or buy on pullback at 1,563. Target will be in different stages. 1st TP is 2,687 and final TP is 6,520
Mercari Stock Trend Analysis: Reversal Signals and Growth OpportIf you're an investor based in Japan, consider keeping an eye on Mercari's stock. It appears to be forming a bottom, with weekly candlestick charts showing increasing trading volume as the price approaches key support levels. While it may take considerable time to revisit its previous highs, the stock exhibits promising signals of a potential trend reversal. This could mark the end of its downtrend and the beginning of a sustainable upward trajectory.
6758 | SONY GROUP CORPORATIONSony Group Corporation (SONY) has captured attention with a fresh breakout, signaling renewed momentum in its stock performance. This technical move suggests potential upside, driven by strong fundamentals and innovation across its key segments, including gaming, entertainment, and electronics. Investors should watch for sustained volume and follow-through to confirm this breakout as Sony continues to solidify its position as a global leader.
Cup and Handle Pattern 4593 heliosTSE:4593 When Will This Pattern Work?
For a Bullish Breakout (Ideal Condition):
Volume Surge:
A significant increase in volume above the 180 JPY resistance confirms buyer interest and potential breakout.
OBV Reversal:
OBV should start making higher highs, signaling accumulation.
CCI Recovery Above 0:
Move above 0 confirms momentum shift toward bullish sentiment.
ROC Turns Positive:
Positive momentum supports sustained price growth.
CMF Above 0:
Inflow of money indicates institutional or smart money buying.
Electric Vehicles: The Top Trends to Watch in 2025Trump's friendly relationship with Elon Musk, combined with the potential continued market focus on electric vehicles and the automotive sector next year, is worth keeping an eye on. Currently, Toyota's stock in Japan is showing signs of a technical rebound, and the Toyota ADRs listed in the U.S. seem to be gearing up for a bottom breakout.
Two Types of UptrendsSony Group (6758) - Weekly Chart
There are two types of uptrends within an overall upward trend.
This statement might sound confusing at first.
What I mean is that there are "easy-to-understand" uptrends and "difficult" uptrends.
The chart shows two blue circles.
Which one represents an easy-to-understand chart, and which one represents a difficult chart?
Opinions might differ, but I feel the chart on the left is easy to understand, while the one on the right is more difficult.
The reason is that on the left, the pullback buying (buying on dips) continues, and there are no clear exit points.
On the other hand, the right side ultimately trends upward, but the trend doesn't sustain, making it hard to hold a position.
So, how should we deal with such situations?
Since this is a weekly chart, one option is to monitor it with a swing trading approach using the daily chart.
However, when faced with a difficult chart, you also have the option of walking away from that stock instead of forcing a strategy.
Focusing on finding easy-to-read charts and trading only in straightforward situations can often lead to better results.
Keep in mind that this is one way to think about trading.
6770 - 7 months HEAD & SHOULDERS══════════════════════════════
Since 2014, my markets approach is to spot
trading opportunities based solely on the
development of
CLASSICAL CHART PATTERNS
🤝Let’s learn and grow together 🤝
══════════════════════════════
Hello Traders ✌
After a careful consideration I came to the conclusion that:
- it is crucial to be quick in alerting you with all the opportunities I spot and often I don't post a good pattern because I don't have the opportunity to write down a proper didactical comment;
- since my parameters to identify a Classical Pattern and its scenario are very well defined, many of my comments were and would be redundant;
- the information that I think is important is very simple and can easily be understood just by looking at charts;
For these reasons and hoping to give you a better help, I decided to write comments only when something very specific or interesting shows up, otherwise all the information is shown on the chart.
Thank you all for your support
🔎🔎🔎 ALWAYS REMEMBER
"A pattern IS NOT a Pattern until the breakout is completed. Before that moment it is just a bunch of colorful candlesticks on a chart of your watchlist"
═════════════════════════════
⚠ DISCLAIMER ⚠
Breakout Area, Target, Levels, each line drawn on this chart and any other content represent just The Art Of Charting’s personal opinion and it is posted purely for educational purposes. Therefore it must not be taken as a direct or indirect investing recommendations or advices. Entry Point, Initial Stop Loss and Targets depend on your personal and unique Trading Plan Tactics and Money Management rules, Any action taken upon these information is at your own risk.
═════════════════════════════
Mercari price predictionAs the chart. 150% profit opportunity in approx 550 days.
Looks a good investment, yes... but for me, I see there are more products and derivatives that have greater ROI in a shorter term. So I'm not going to get my bucks into it.
Still I see it would get high as long as the US stock market doesn't get nuked.
A triangle consolidation should be "followed by a breakout."INPEX Daily Chart
The chart is moving around the 200-day moving average (the gentle red line).
When the price is above the 200-day moving average, buying pressure has been dominant.
When the price falls below the 200-day moving average, selling pressure takes over.
The yellow background on the chart indicates a phase of buying dominance, while the blue background signifies a phase of selling dominance.
Recently, the chart has formed a triangle consolidation pattern.
A triangle consolidation is often described with the phrase "follow the breakout."
This pattern forms when a standoff occurs between buyers and sellers, leading to a state of equilibrium.
Once this equilibrium breaks, a new trend emerges.
Thus, the idea is to follow the direction of the trend once it becomes apparent.
While it's unclear which way the breakout will go, the likelihood of an upward breakout increases when the price is above the 200-day EMA. Conversely, when the price is below the 200-day EMA, the chance of a downward breakout increases.
So, instead of trying to predict whether the price will rise or fall, let's trade in line with the movements of the chart.
🇯🇵 Long Nippon Tel & Tel at 152.6For today's international stock hypothetical trade, I'm off to the Asia-Pacific region to visit the Nikkei and attempt to outdo its 20 year average annual return in this trade alone. Since that is -1.1% per year, I think I can clear that bar. Plus, with the US markets closed tomorrow, I need something to entertain me when I wake up.
As you can see, the chart on Nippon isn't particuarly compelling, but my algo and I would have been 20-0 over the time period shown on the chart, so I feel good about it nonetheless.
One of the reasons I chose Nippon (there's lots of stuff down on the Nikkei) is that FPC trades on this name tend to close quicker than most. Overall returns on an absolute level are small (avg. 1.16%) but getting that in an average of 9 days in a market that returns 200ish% less than that a year is pretty good work, I think. I'm sure most Japanese buy and holders would take it, anyway.
I'm obvioulsy not trading this for real from half a planet away, but I'll play it like I am.
Per my usual strategy, once I'm in I'll add at the close on any day it still flashes "buy" and I will use FPC (first profitable close) to exit any lot on the day it closes at any profit.
As always - this is intended as "edutainment" and my perspective on what I am or would be doing, not a recommendation for you to buy or sell. Act accordingly and invest at your own risk. DYOR and only make investments that make good financial sense for you in your current situation.
Isetan Mitsukoshi Holdings Ltd | Chart & Forecast SummaryKey Indicators on Trade Set Up in General
1. Push Set Up
2. Range Set up
3. Break & Retest Set Up
Active Sessions on Relevant Range & Elemented Probabilities;
* Asian(Ranging)
Conclusion | Trade Plan Execution & Risk Management on Demand;
Overall Consensus | Neutral
Otsuka Corporation | Chart & Forecast SummaryKey Indicators on Trade Set Up in General
1. Push Set Up
2. Range Set up
3. Break & Retest Set Up
Active Sessions on Relevant Range & Elemented Probabilities;
* Asian(Ranging)
Conclusion | Trade Plan Execution & Risk Management on Demand;
Overall Consensus | Buy
6366 - 5 months HEAD & SHOULDERS══════════════════════════════
Since 2014, my markets approach is to spot
trading opportunities based solely on the
development of
CLASSICAL CHART PATTERNS
🤝Let’s learn and grow together 🤝
══════════════════════════════
Hello Traders ✌
After a careful consideration I came to the conclusion that:
- it is crucial to be quick in alerting you with all the opportunities I spot and often I don't post a good pattern because I don't have the opportunity to write down a proper didactical comment;
- since my parameters to identify a Classical Pattern and its scenario are very well defined, many of my comments were and would be redundant;
- the information that I think is important is very simple and can easily be understood just by looking at charts;
For these reasons and hoping to give you a better help, I decided to write comments only when something very specific or interesting shows up, otherwise all the information is shown on the chart.
Thank you all for your support
🔎🔎🔎 ALWAYS REMEMBER
"A pattern IS NOT a Pattern until the breakout is completed. Before that moment it is just a bunch of colorful candlesticks on a chart of your watchlist"
═════════════════════════════
⚠ DISCLAIMER ⚠
Breakout Area, Target, Levels, each line drawn on this chart and any other content represent just The Art Of Charting’s personal opinion and it is posted purely for educational purposes. Therefore it must not be taken as a direct or indirect investing recommendations or advices. Entry Point, Initial Stop Loss and Targets depend on your personal and unique Trading Plan Tactics and Money Management rules, Any action taken upon these information is at your own risk.
═════════════════════════════