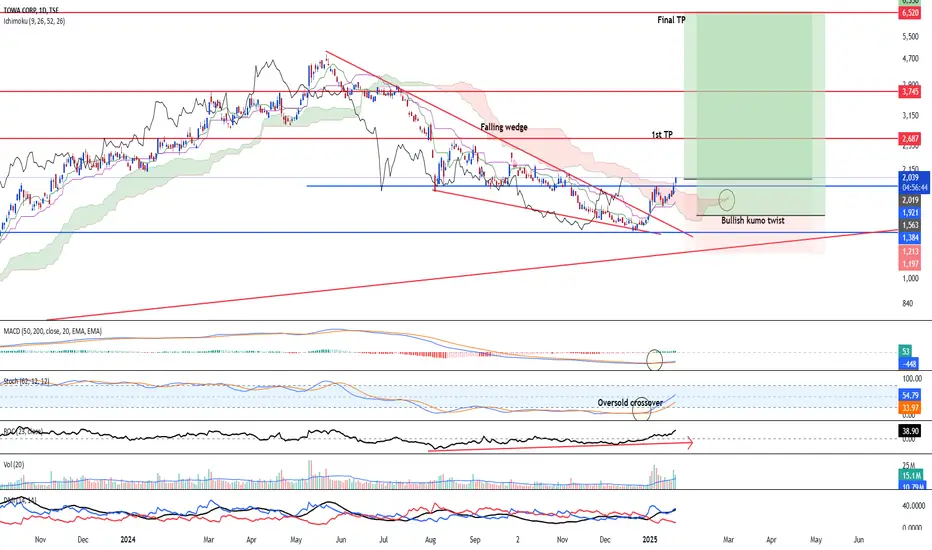
Corrective downtrend has ended - Upside coming backTSE:6315 Towa Corp's uptrend has been intact since March 2020. Despite a correction since 27 May 2024, the correction has come to an end after the stock broke above the falling wedge. Furthermore, the latest price action shows a closure above the ichimoku Kumo, which confirms the three bullish golden cross.
The latest cross above 1,921 resistance turned support marks the possible start of a renewed uptrend, where higher high and low was spotted.
Momentum is strong across the Long-term MACD, mid-term Stochastic Oscillator, where it has confirmed the oversold crossover. Moreover, 23-period ROC has risen strongly above the zero line.
Volume remain in a healthy expansion and directional movement index is showing strong positive bullish strength.
Hence, we are considering buying on spot or buy on pullback at 1,563. Target will be in different stages. 1st TP is 2,687 and final TP is 6,520  Long
Long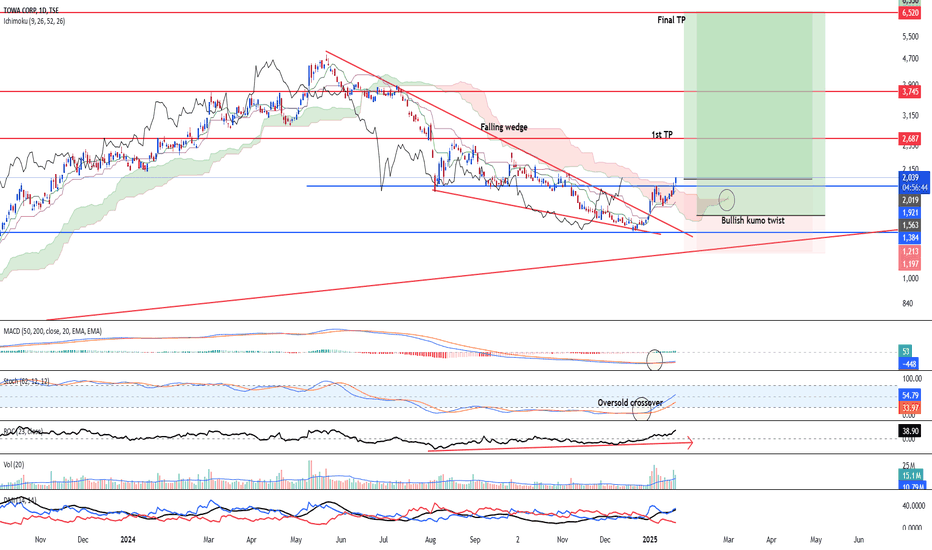
 Long
Long
 Long
Long
 Long
Long
Two Types of UptrendsSony Group (6758) - Weekly Chart
There are two types of uptrends within an overall upward trend.
This statement might sound confusing at first.
What I mean is that there are "easy-to-understand" uptrends and "difficult" uptrends.
The chart shows two blue circles.
Which one represents an easy-to-understand chart, and which one represents a difficult chart?
Opinions might differ, but I feel the chart on the left is easy to understand, while the one on the right is more difficult.
The reason is that on the left, the pullback buying (buying on dips) continues, and there are no clear exit points.
On the other hand, the right side ultimately trends upward, but the trend doesn't sustain, making it hard to hold a position.
So, how should we deal with such situations?
Since this is a weekly chart, one option is to monitor it with a swing trading approach using the daily chart.
However, when faced with a difficult chart, you also have the option of walking away from that stock instead of forcing a strategy.
Focusing on finding easy-to-read charts and trading only in straightforward situations can often lead to better results.
Keep in mind that this is one way to think about trading. Education 
 Long
Long
Long 
 Long
Long
A triangle consolidation should be "followed by a breakout."INPEX Daily Chart
The chart is moving around the 200-day moving average (the gentle red line).
When the price is above the 200-day moving average, buying pressure has been dominant.
When the price falls below the 200-day moving average, selling pressure takes over.
The yellow background on the chart indicates a phase of buying dominance, while the blue background signifies a phase of selling dominance.
Recently, the chart has formed a triangle consolidation pattern.
A triangle consolidation is often described with the phrase "follow the breakout."
This pattern forms when a standoff occurs between buyers and sellers, leading to a state of equilibrium.
Once this equilibrium breaks, a new trend emerges.
Thus, the idea is to follow the direction of the trend once it becomes apparent.
While it's unclear which way the breakout will go, the likelihood of an upward breakout increases when the price is above the 200-day EMA. Conversely, when the price is below the 200-day EMA, the chance of a downward breakout increases.
So, instead of trying to predict whether the price will rise or fall, let's trade in line with the movements of the chart.  Short
Short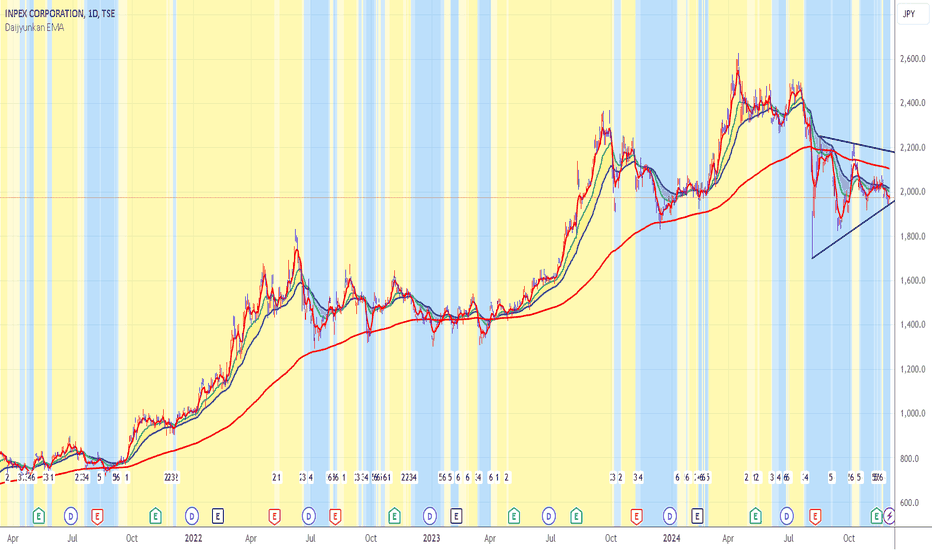
🇯🇵 Long Nippon Tel & Tel at 152.6For today's international stock hypothetical trade, I'm off to the Asia-Pacific region to visit the Nikkei and attempt to outdo its 20 year average annual return in this trade alone. Since that is -1.1% per year, I think I can clear that bar. Plus, with the US markets closed tomorrow, I need something to entertain me when I wake up.
As you can see, the chart on Nippon isn't particuarly compelling, but my algo and I would have been 20-0 over the time period shown on the chart, so I feel good about it nonetheless.
One of the reasons I chose Nippon (there's lots of stuff down on the Nikkei) is that FPC trades on this name tend to close quicker than most. Overall returns on an absolute level are small (avg. 1.16%) but getting that in an average of 9 days in a market that returns 200ish% less than that a year is pretty good work, I think. I'm sure most Japanese buy and holders would take it, anyway.
I'm obvioulsy not trading this for real from half a planet away, but I'll play it like I am.
Per my usual strategy, once I'm in I'll add at the close on any day it still flashes "buy" and I will use FPC (first profitable close) to exit any lot on the day it closes at any profit.
As always - this is intended as "edutainment" and my perspective on what I am or would be doing, not a recommendation for you to buy or sell. Act accordingly and invest at your own risk. DYOR and only make investments that make good financial sense for you in your current situation.
 Long
Long
 Long
Long
 Long
Long
Can Nintendo's Next Move Redefine Gaming Again?In the high-stakes world of gaming entertainment, Nintendo stands at a fascinating inflection point. With a 69% profit plunge and declining Switch sales, conventional wisdom might suggest trouble for the Japanese gaming giant. Yet, history shows that Nintendo often thrives most when challenged, using periods of transition to revolutionize how we play – just as they did with the Wii's motion controls and the Switch's hybrid concept.
The company's current strategy reveals a sophisticated understanding of modern entertainment ecosystems. While managing the sunset of the Switch era, Nintendo is simultaneously expanding its reach through Hollywood partnerships, innovative hardware accessories, and digital services. This multi-pronged approach suggests that Nintendo's vision extends far beyond traditional gaming boundaries, potentially setting the stage for a more comprehensive entertainment experience.
What makes this moment particularly intriguing is Nintendo's proven ability to create new market categories rather than just competing in existing ones. As the company prepares to announce its next gaming platform before March 2025, the real question isn't just about new hardware specifications – it's about how Nintendo might once again reshape our understanding of entertainment. With its rich IP portfolio and history of innovation, Nintendo appears to be orchestrating not just a product launch, but potentially a new chapter in how we interact with digital entertainment.
The coming months will reveal whether Nintendo can once again transform challenge into opportunity, as it has done repeatedly throughout its 134-year history. For investors and industry observers alike, this represents more than a financial turning point – it's a window into the future of interactive entertainment.  Short
Short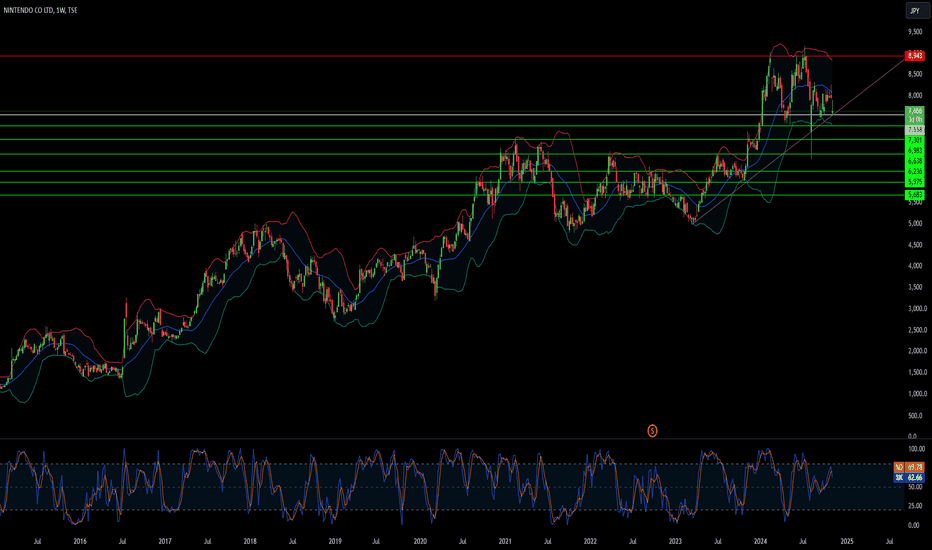
 Long
Long
 Short
Short
Long 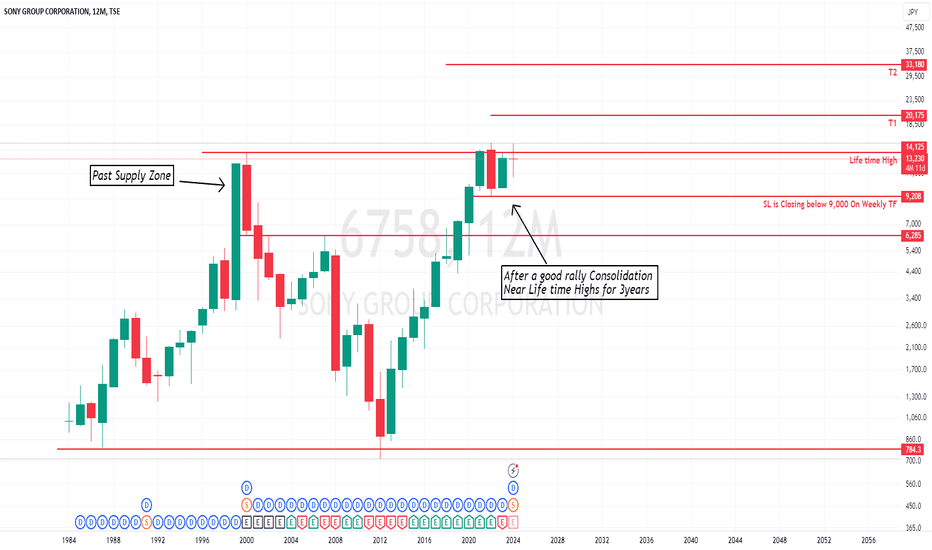
 Long
Long
 Long
Long
 Long
Long