• Products
  • Community
  • Markets
  • Brokers
  • More
Get started
  • Markets
  • /Japan
  • /Stocks
  • /Ideas
ANYCOLOR: Bullish Breakout Holding Above Support ZoneANYCOLOR; the parent company of Nijisanji has broken above the 55SMA and the Support/Resistance zone between 5600 JPY and 6900 JPY so long as this level holds it can easily see and 0.786 maybe even 0.886 retrace back towards the all-time highs. Recently, a similar company known as COVER CORP had some similar price action that lead to all-time highs that can be seen in the Related Ideas tab below.
TSE:5032Long
by RizeSenpai
Niterra (NGK Sparkplug)Niterra have a strong financials with a robust medium-long term management plan. The company is cash rich and consolidation in the market with the withdrawal of Dentsu. This is a key opportunity to pick this stock up at a low price as i believe the overall Nikkei 225 will have a slight pullback in the upcoming months
TSE:5334
by ben_findlay
Panasonic Asymmetrical TriangleThis is an Asymmetrical Triangle Pattern, a humongous one formed on the monthly chart. We are expecting to see over 300% growth on Panasonic TSE:6752
TSE:6752Long
by JoE
WA INC - 7683 JPY - Trend Value Trigger=============================TRADE LAYOUT============================ 1. IDENTIFY THE TREND a) Series of new higher high swing and higher low swing: YES b) 10 EMA > 30 EMA > 50 EMA: YES c) EMAs pointing upwards: YES d) Output: UPTRENDING MARKET e) Bias: LOOKING FOR LONG OPPORTUNITIES CLOSE TO VALUE AREAS 2. IDENTIFY THE VALUE AREA a) 10 EMA: OFFERING SUPPORT SINCE END OCTOBER, 2022 b) 50 EMA: - c) Support area: - d) Demand area: - e) Trendline: - 3. LOOK FOR A TRIGGER IN THAT AREA a)
TSE:7683Long
by ruben_rodrigues
Do you remember Yahoo!? 📈It's been a long time ago, that Yahoo had any value in browsing the internet. I don't think they are really "up to date", but from a pure technical view this long setup could work. We've established on the weekly timeframe a clear higher low - waiting for the higher high now.
TSE:4689Long
by p4917
Fujitsu Limited WCA - Symmetrical TriangleCompany: Fujitsu Limited Ticker: 6702.T Exchange: Tokyo Stock Exchange Sector: Technology Introduction: Hello and welcome to our technical analysis session! Today we are focusing on Fujitsu Limited as observed on the weekly chart on the Tokyo Stock Exchange. An intriguing symmetrical triangle formation has caught our attention, which may act as a bullish continuation. Symmetrical Triangle Pattern: A symmetrical triangle is a price pattern characterized by converging trend lines and oscil
TSE:6702
by KarimSubhieh
Mitsubishi Heavy Industries WCA - Rectangle PatternCompany: Mitsubishi Heavy Industries Ticker: 7011 Exchange: Tokyo Stock Exchange Sector: Industrial Introduction: Hello and welcome to this week's technical analysis. We're focusing on Mitsubishi Heavy Industries, as represented on the weekly chart of the Tokyo Stock Exchange. The company's stock has formed an interesting rectangle pattern over the past 378 days, acting as a potential bullish continuation. Rectangle Pattern: A Rectangle pattern can act as a continuation or reversal signa
TSE:7011
by KarimSubhieh
OHMORI #1844 #TSENice daily pattern. Will try to buy it at 199-200jpy. Breakout with high volumes. We are above the upper band of bollinger and above the resistance. SL very short (-4,50% at 189jpy). As i have no really target i will follow the SMA10 and will sell if the price crosses down the SMA10.
TSE:1844Long
by ChristopheCochard
Nice set up.A set up at this price with a SL at 750 jpy. Target around 1000 jpy.
TSE:3300Long
by ChristopheCochard
3
Time for pushing or failing.Last daily candle is quite alarming but as long as bulls push this thing, 512 has to be their strongest commitment to see 560sh.
TSE:7201
by juanclos
1
9202 - Bullish ReversalCompany: ANA Holdings Inc. Ticker: 9202 Exchange: TSE Sector: Air Transport Introduction: Hello and welcome to today's technical analysis. We're turning our attention to the weekly chart of ANA Holdings Inc. (9202) on the TSE, which is demonstrating an exciting Rectangle pattern breakout that could signal a bullish reversal. Rectangle Pattern: The Rectangle pattern is a common chart pattern that can act as a continuation or a reversal signal, depending on the preceding trend and the brea
TSE:9202Long
by KarimSubhieh
Bridgestone Corp WCA - Inverted head and shouldersCompany: Bridgestone Corporation Ticker: 5108 Exchange: TSE Sector: Automotive & Auto Parts Introduction: Greetings, and thank you for taking the time to read this analysis. Today, we are examining the weekly chart of Bridgestone Corp on the Tokyo Stock Exchange (TSE). Our focus is on a classical price pattern known as the inverted head and shoulders, which here manifests as a bullish continuation pattern. Inverted Head and Shoulders Pattern: The inverted head and shoulders pattern on t
TSE:5108
by KarimSubhieh
Sony Group Corporation DCA - Inverted head and shoulders + C&HCompany: Sony Group Corporation Ticker: 6758 Exchange: TSE Sector: Electronics Introduction: Hello and thank you for taking the time to read my post. Today, we analyze the daily chart of Sony Group Corporation, focusing on an interesting combination of two price patterns, an inverted head and shoulders and a cup and handle pattern. This combination provides additional confirmation for classical chart analysts and offers a compelling trading opportunity. Price Patterns: Inverted Head an
TSE:6758Long
by KarimSubhieh
Toyota Motor Corporation DCA - Rectangle Reversal Company: Toyota Motor Corporation Ticker: 7203 Exchange: TSE Sector: Automotive Introduction: Hello and thank you for taking the time to read my post. Today, we analyze the daily chart of Toyota Motor Corporation, focusing on a potential Rectangle reversal pattern. This pattern may indicate a change in the trend and offers trading opportunities for both short-term gains and long-term positions. Rectangle Reversal Pattern: The Rectangle pattern is a consolidation pattern that forms when
TSE:7203
by KarimSubhieh
CyberAggent At the Supply Line of an Ascending Broadening WedgeCyberAgent currently sits at the Supply Line of a long established Ascending Broadening Wedge and while my first instinct would usually be to short, I think this one is showing signs that it will give us a strong bullish reaction off of this supply line as we have a bunch of Bullish Divergence on the MACD and RSI and are at the 55 Moving Average on the 2 Month while trading in a very tight more local falling wedge pattern. Upon Breakout i think we could go up to make a 0.886 Retrace before ultim
TSE:4751Long
by RizeSenpai
CAPCOM CO LTD: Strong Video Game Success and Financial PerformanCAPCOM CO LTD is a leading Japanese video game developer and publisher. The company was founded in 1979 and has since then created a portfolio of world-renowned titles such as Resident Evil, Monster Hunter, and Street Fighter. As of April 18, 2023, the company's stock, ticker 9697, is trading on the Tokyo Stock Exchange at a market capitalization of JPY 2.41 trillion. From a technical perspective, CAPCOM's stock has been performing well, hitting new all-time highs in recent months. The stock pr
TSE:9697Long
by UnknownUnicorn1991957
Econach Holdings Long Well, just maybe one can hope. This is not financial advice.
TSE:3521Long
by marspumpkin
Updated
AFTER A SUSHI TERRORISM, THE STOCK WENT UP. WHAT TO DO NOW?A simple answer: Short it. A detailed answer: Based on NEOWAVE, the price pattern has reached every target price. As a result, a short position may be considered, subject to the existence of a clear reversal signal.
TSE:3563Short
by lordachita
Updated
COVER CORP: Inverse Head and Shoulders / Bullish DragonWe have a Quasimodo looking Inverted Head and Shoulders and Bullish Dragon Pattern forming here on the recently listed stock of Cover Corp, the Parent Company of Hololive. If it holds the line here, I think we could see it make a 0.618-0.886 Upside Fibonacci Retracement.
TSE:5253Long
by RizeSenpai
NISSAN , LONG TF H1. On the hourly chart the trend started on March 16 (Linear Regression Channel). There is a high probability of profit. Possible take profit level 507.7 But do not forget about SL = 449.7 Good luck! Regards, WeBelieveInTrading
TSE:7201Long
by WeBelieveInTrading
Updated
MAKITA , TF H4 LONG , TP = 4803A new trend started on the 4-hour chart on November 7, 2022. On February 8, was a test of the level 3670, in the near future should be a retest of this level. The channel on the chart is clearly not complete. My opinion now it is possible to enter in buying. Takeprofit level is 4803. Do not forget about SL = 2570 Good luck! Regards, WeBelieveInTrading
TSE:6586Long
by WeBelieveInTrading
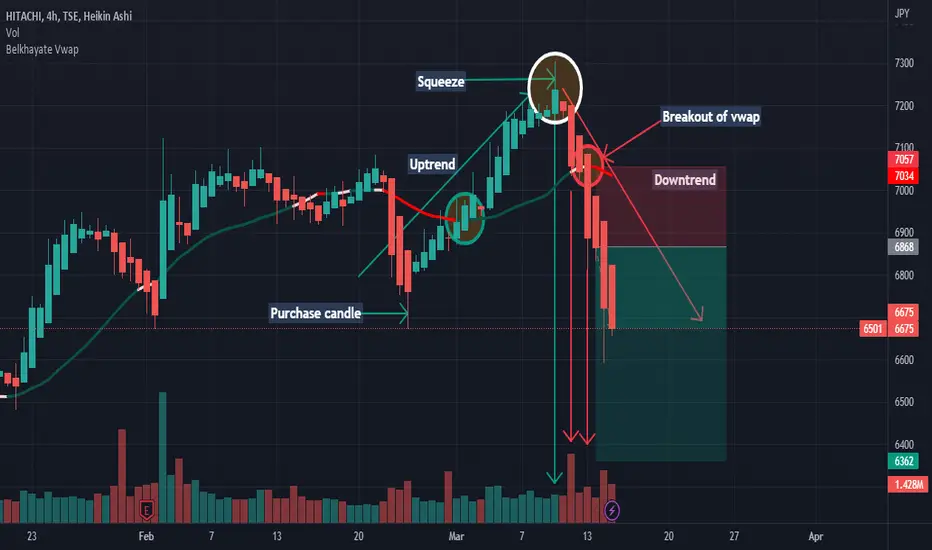
6501: Analysis:Sell ideaSell idea on 6501 as you see on the chart because we have a squeeze and also we have the breakout with force the vwap indicator by a big red candle with a large red volume so it's mean that the sellers took over the buyers.Thanks!
TSE:6501Short
by PAZINI19
6758: Sell ideaOn 6758 as you see on the chart we have a sell idea because we have the breakout with force the vwap indicator by a big red candle with a large red volume.Thanks!
TSE:6758Short
by PAZINI19
Enter LongAs implied on the chart - I've placed a limit buy order in this stock. Waiting for the re-test to enter the market.
TSE:3861Long
by p4917
Updated
123456789101112131415161718192021222324252627282930
…999

Made by humans

Select market data provided by ICE Data Services. Select reference data provided by FactSet. Copyright © 2026 FactSet Research Systems Inc.Copyright © 2026, American Bankers Association. CUSIP Database provided by FactSet Research Systems Inc. All rights reserved. SEC filings and other documents provided by Quartr.© 2026 TradingView, Inc.

SOC 2 CompliantGDPR Compliant
More than a product
  • Supercharts
Screeners
  • Stocks
  • ETFs
  • Bonds
  • Crypto coins
  • CEX pairs
  • DEX pairs
  • Pine
Heatmaps
  • Stocks
  • ETFs
  • Crypto coins
Calendars
  • Economic
  • Earnings
  • Dividends
  • IPOs
More products
  • News Flow
  • Portfolios
  • Fundamental Graphs
  • Yield Curves
  • Options
  • Macro Maps
  • Pine Script®
  • MCP Server
Apps
  • Mobile
  • Desktop
Community
  • Social network
  • Wall of Love
  • Refer a friend
  • Creator program
  • House Rules
  • Moderators
Ideas
  • Trading
  • Education
  • Editors' picks
Pine Script
  • Indicators & strategies
  • Wizards
  • Freelancers
  • Marketplace
Tools & subscriptions
  • Features
  • Pricing
  • Market data
  • Gift plans
Trading
  • Overview
  • Brokers
  • Brokers comparison
  • The Leap
Special offers
  • CME Group futures
  • Eurex futures
  • US stocks bundle
About company
  • Who we are
  • Space mission
  • Blog
  • Help Center
  • Careers
  • Media kit
Merch
  • Tarot cards for traders
  • The C63 TradeTime
Policies & security
  • Terms of Use
  • Disclaimer
  • Privacy Policy
  • Cookies Policy
  • Accessibility Statement
  • Trust Center
  • Security tips
  • Bug Bounty program
  • Status page
Business solutions
  • Widgets
  • Charting libraries
  • Lightweight Charts™
  • Advanced Charts
  • Trading Platform
Growth opportunities
  • Advertising
  • Brokerage integration
  • Partner program
  • Education program
Community
  • Social network
  • Wall of Love
  • Refer a friend
  • Creator program
  • House Rules
  • Moderators
Ideas
  • Trading
  • Education
  • Editors' picks
Pine Script
  • Indicators & strategies
  • Wizards
  • Freelancers
  • Marketplace
Business solutions
  • Widgets
  • Charting libraries
  • Lightweight Charts™
  • Advanced Charts
  • Trading Platform
Growth opportunities
  • Advertising
  • Brokerage integration
  • Partner program
  • Education program
Look FirstLook First