Just In: Nihon Nohyaku Co., Ltd. (TYO:4997) Gearing For BreakoutNihon Nohyaku Co., Ltd. (TYO:4997) just broke the ceiling of a bullish symmetrical triangle and is now gearing for a breakout albeit market sentiment.
With its RSI AT 58, it gives the stock room to capitalize on it to claim $1k resistant zone.
Nihon Nohyaku has a market cap or net worth of JPY 79.42 billion. The enterprise value is 76.80 billion.
Stock Price Statistics
The stock price has increased by +42.14% in the last 52 weeks. In the last 12 months, Nihon Nohyaku had revenue of JPY 108.55 billion and earned 5.11 billion in profits. Earnings per share was 65.24. Return on equity (ROE) is 6.68% and return on invested capital (ROIC) is 6.94%.
About Nihon Nohyaku
Nihon Nohyaku Co., Ltd. manufactures and sells agricultural chemicals in Japan, the United States, India, rest of Asia, Brazil, and internationally. It operates through Pesticides; Chemicals Other Than Pesticides; and Others segments. The company offers crop protection products comprising fungicides, insecticides, and herbicides; crop aid products, including bio stimulants; termiticides; agricultural materials; chemical products used for home gardening and greenery.  Long
Long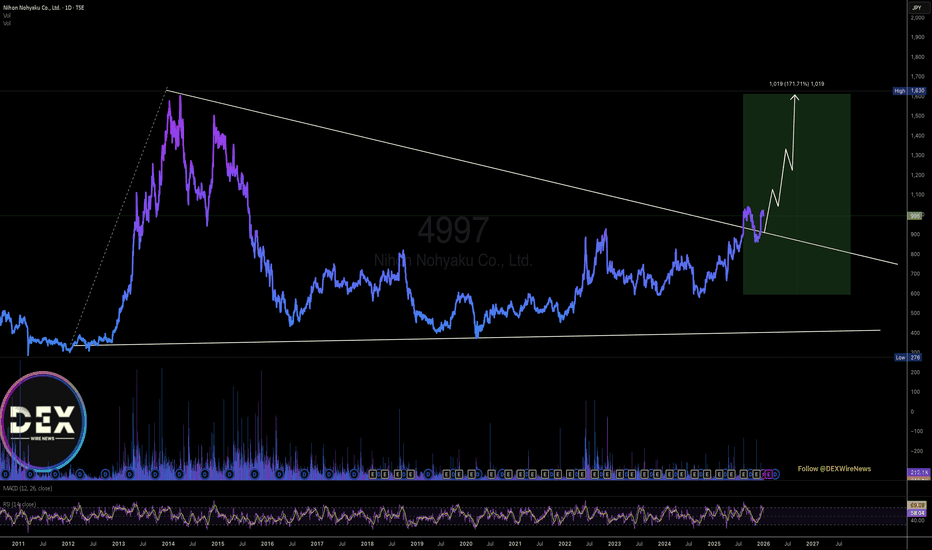
Material Gains: AI Demand Meets Value in Mitsui MiningMitsui Mining and Smelting Co. (5706) has established a dominant uptrend over the last year, recently entering a consolidation phase after an impressive rally. Currently trading around 17,635 JPY , the stock is taking a breather, which makes this an interesting chart to watch for potential continuation if buyers step back in. As a leader in materials science, Mitsui operates across zinc mining and rare earth compounds, but its recent shift toward high-tech materials has captured market attention.
Fundamentally, the narrative is evolving beyond traditional mining. The company recently raised its operating income forecast to 78.0 billion JPY , driven largely by surging demand for its "MicroThin" and "VSP" copper foils used in AI servers . Additionally, confirmed investments in mass production facilities for solid-state battery electrolytes (A-SOLiD) position them as a key player in next-gen EV infrastructure. With revenue growth reported at 9.5% and active share repurchases continuing through late 2025, the company is signaling strong confidence in its structural pivot.
Technically, the chart confirms significant strength, with a massive +432.62% move over the last 7 or 8 months. The price remains comfortably above the 50-day and 200-day SMAs , signaling that the long-term trend is intact. The recent pullback has reset the RSI to 50.70 , a neutral reading that often precedes a new leg up in trending assets. While the MACD shows a bearish crossover, the decreasing volume during this decline suggests profit-taking rather than a trend reversal.
Mitsui might be worth a watch.
-------------------------------------
About Me: Global TradingView Moderator (English) and full-time trader. I focus on top-performing stocks worldwide, trading momentum and clean trend continuations after pullbacks. I use a trailing stop system customised for each stock to manage risk, lock in gains, and exit when the trend ends. Nothing I post is trading advice. I simply highlight interesting companies from around the world that may be worth a closer look. Please give this idea a BOOST if you found it interesting, and FOLLOW ME to discover more standout stocks and businesses from global markets.
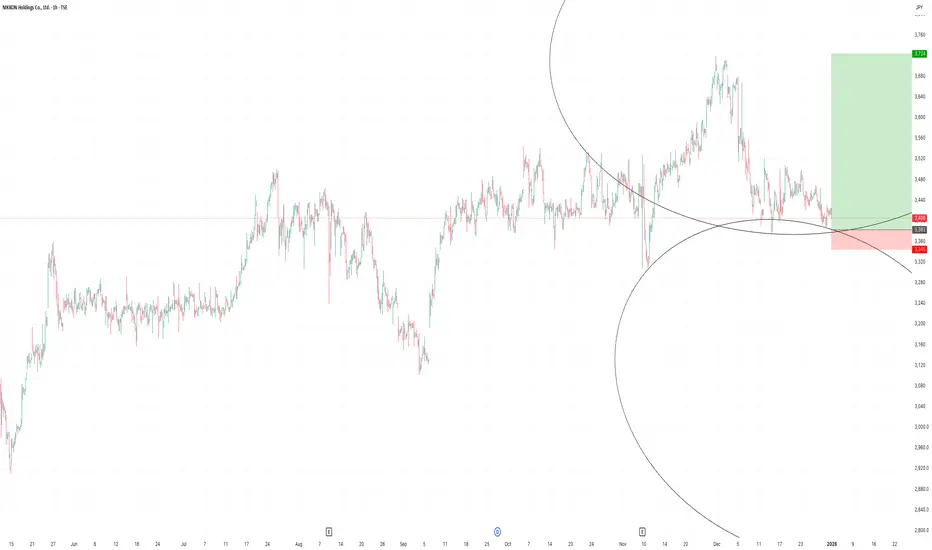
------------------------------------- Trade Recommendation Brief — NIKKON Holdings (TSE)📈 Trade Recommendation Brief — NIKKON Holdings (TSE)
Ticker: 7729 (TSE)
Recommendation: BUY
Entry Zone: 3,300 – 3,400 JPY
Primary Target: 3,700 JPY
Timeframe: Swing (4–12 weeks)
Risk Management: Stop-loss below 3,150 JPY
🧠 Trade Rationale
1. Technical Context
NIKKON Holdings has exhibited recent bullish price action, sustaining support in the 3,300–3,400 JPY zone. This level has acted as a pivot in multiple timeframes, suggesting it has become a demand region. A move above the upper bound of this range (3,400 JPY) would signal a return of buying pressure and continuation of the uptrend.
2. Momentum Expansion
Note that the stock has shown higher lows and higher highs over recent sessions, indicating constructive momentum. A breakout from consolidation near 3,400 JPY could trigger accelerated gains toward the 3,700 JPY area, consistent with measured moves from the prior range.
3. Logical Price Projection
Measured Move Target: 3,300 → 3,700 JPY
This represents roughly a 9–12% potential upside from the entry zone.
This projection aligns with recent volatility patterns and the stock’s historical range expansion.
4. Relative Strength
Relative to certain peers on the Tokyo Stock Exchange, NIKKON’s ability to hold support and rebound suggests strengthening investor conviction, which often precedes broader participation and sustained rallies.
📊 Entry, Targets, and Risk
Parameter Level
Entry Zone 3,300 – 3,400 JPY
Primary Profit Target ~3,700 JPY
Stop-Loss ~3,150 JPY (below structural support)
Risk per Share ~150–250 JPY
Reward:Risk Ratio ~3:1 (target 400+ vs. risk ~150)
🛠 Position Sizing & Risk Management
Define risk per trade: e.g., 1–2% of total portfolio
Scale into position: Consider adding partial size near 3,350–3,400 JPY if price stabilizes
Adjust stop: Once price breaks above 3,500 JPY, consider tightening stop to breakeven or just below 3,400 JPY to protect gains
📅 Expected Timeline
This setup is not a day trade — it is designed for swing traders with a horizon of 4–12 weeks. The primary target of 3,700 JPY assumes trend continuation and confirmation of the breakout.
⚠️ Key Risks
Market volatility: Broader Japan equity pullbacks may delay or reverse this trend.
Catalyst dependency: Without supporting news or sector strength, rallies may lack follow-through.
Technical rejection: A drop below 3,150 JPY invalidates this bias and suggests further downside.
🧾 Summary
Trade Idea: Buy within 3,300–3,400 JPY
Target: ~3,700 JPY
Stop: ~3,150 JPY
R:R: Attractive (~3:1)
Timeframe: Swing (weeks)  Long
Long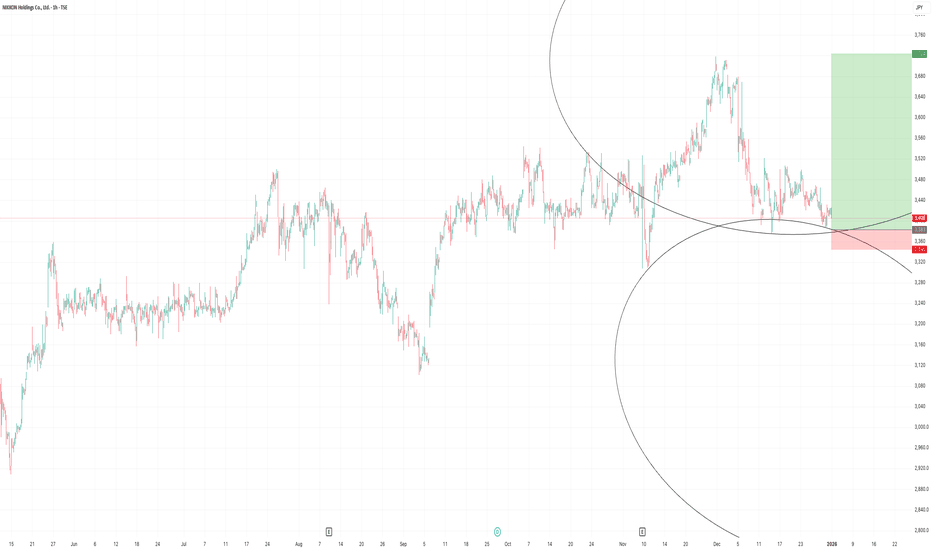
Mitani Sangyo: Diversified Growth Meets MomentumMitani Sangyo Co., Ltd. (8285) has established a robust uptrend over the past year and we are currently observing a healthy consolidation phase following a period of consistent gains. As this Japanese conglomerate pulls back slightly from recent highs, it presents an interesting chart structure to watch for potential trend continuation.
Fundamentally, the company operates as a diversified powerhouse with segments spanning Chemicals, Information Systems, and Energy. Supported by reported 18.6% revenue growth, Mitani Sangyo is leveraging its multi-sector presence to capture opportunities in both domestic markets and the growing Southeast Asian region. This expansion strategy, coupled with a focus on high-value IT integration and renewable energy projects, has positioned the stock as a compelling mix of stability and growth. Investors are particularly noting its resilience amid broader sector reforms aimed at improving capital efficiency.
Technically, the chart confirms a powerful bullish stance, boasting a gain of over 72% . Price action remains stacked well above the 50-day , 100-day , and 200-day SMAs , signalling that the long-term trend is firmly intact. The recent pullback has cooled the RSI to 59.06 , offering a breather from overbought conditions without breaking market structure. While the MACD histogram is currently red and flattening indicating a pause in immediate buying pressure, the volume profile remains stable suggesting this is a routine correction rather than a reversal.
Mitani Sangyo might be one to watch.
--------------------------------------------
About Me: Global TradingView Moderator (English) and full-time trader. I focus on top-performing stocks worldwide, trading momentum and clean trend continuations after pullbacks. I use a trailing stop system customised for each stock to manage risk, lock in gains, and exit when the trend ends. Nothing I post is trading advice. I simply highlight interesting companies from around the world that may be worth a closer look. Please give this idea a BOOST if you found it interesting, and FOLLOW ME to discover more standout stocks and businesses from global markets.
-------------------------------------------- I like Suzuki Motor CorporationAlright hear me out, intrinsically speaking this is definitely a value stock. I just want to start by saying I really don't expect anyone to try and buy it just because of what I wrote tonight. You know I will write about what I like about Suzuki and that's its. We are lucky to have a automatic correction feature because I am kind of drunk when I am writing this idea but its cold out side and I am bored so me and auto correct gunna write some stuff on Suzuki since nobody else has said very much about it so far.
Look at this intrinsic value some numbers say it should be worth at least 2700 Yens even though its like 2350 Yens when I am writing this right now. It also says that's the low of the "intrinsic value range" technically I guess it should be worth about 3450 Yens. What the heck? Yes its undervalued even though we are at all time highs. No I am not buying it I am just bored so I am writing an article.
I always rode dirt bikes when I wan younger and enjoyed watching motorsports maybe that is why I like this stock. But there is some reasons why I want to buy it (at a lower price) since I don't NEED to buy it right now. I already have plenty of investments making me money I would ideally like to see it being oversold on the 4 hours chart before I try to buy it. I only buy stocks because I am a perm a bull. I think its foolish to expect a stock to fall and be able to profit from it. You know don't think I am against shorting because if your making money shorting the market you should keep doing it. As a capitalist I cannot disagree with anyone's strategy my hands are tied.
Basically I decided some months ago I would not invest in "bad" companies anyone like oil companies or companies that are harming the planet. Because I am some what of a hippy I don't like it when the planet it being hurt for that sake of monies. But I also like motorcycles! Ok hear me out.
Suzuki has been initialing solar power initiatives and been making progress in ESG initializes. Environmental, social, governance. Ok it should be obvious but some people don't see it how it is so let me explain. Environmentally Suzuki is investing in researches and developments. "Smaller, Fewer, Lighter, Shorter, Beauty" concept, aiming for minimal environmental impact. Developing EVs, hybrids, hydrogen tech, investing in R&D, partnering for green infrastructure. Included in FTSE Blossom Japan Index for climate efforts; Maruti Suzuki India improved ratings for environmental practices. Yes this is what Google said.
While some rating agencies see improvement (Maruti Suzuki), others flag Suzuki as a laggard in overall climate alignment within the auto industry. Suzuki emphasizes its commitment through specific plans (Environmental Vision 2050, ESG Strategy) and participation in global sustainability initiatives. More Google there you go.
I think it should be obvious when we compare the company to other automotive companies there is clearly an advancement in ESG perspectives. Like a lot of companies only want to talk about catalytic converters or some other nonsense . I think even Trump mentioned recently he will roll back environmental standards for the US and I think its bull shit because since I was a mechanic for along time I want to see more environmental standards. I removed a lot of catalytic converters in my time but i still want to see a change because the world needs a chance to love man. (Don't remove your catalytic converters even if it makes your car sound cool, please).
Wow I am at this point in this writing where I have run out of stuff to say. Did I mention where Suzuki is investing in researches and developments in solar power? I don't know I am just drunk writing. Thank god for auto correct or else very person reading this article would have to interpret some absolute random nonsense. Please don't buy the stock just because I want to or sense you might lose money and that's not what I want I don't wasn't you to lose money just make money baby and have fun in life. Just makes sure you stay safe and make good choices because I think good ideas are more important than risk management.
 Long
Long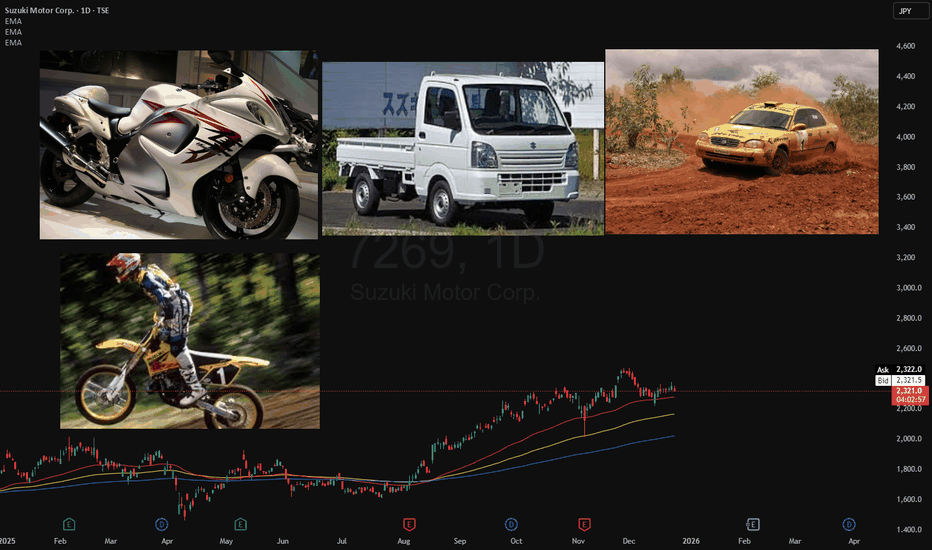
Rambling off about Mitsubishi Heavy IndustriesAs you can see by the title of this idea it will be me writing about a company i think is interesting. It might end up being a lengthy read but I don't know how much I will manage to write before I get bored or covered all the topics I think are important from an investors point of view because I want to try and stay on topic when I write my ideas as best I can. Don't think that this is some kind of trading advice because its not, actually it makes me upset when people ask me to tell them if I think the price of a stock or index will go up or down. I can say that I wouldn't buy it if I didn't think it would go up, but I don't know when it will go up.
Looking at the valuation of the stock first, it appears to be quite overvalued and I'm going to hold off on buying it for awhile. There's a few reasons why I am going to wait to buy it, the first reason actually is because I only wanted to allocated 1 or 2 percent of my portfolio to the stock and for some reason right now it is prohibited to open a new position on the depository receipts. I would already start buying the stock if this was not the case but there's nothing I can do except wait for the trading permission to be available again. Like I said the stock is also very overvalued right now, there's really not any realistic room for upside in the near future. Granted that would not have stopped me from buying it, I probably would have still bought it if the OTC exchange would have allowed me because I just want to own the stock and price is not the most important thing to me when making these decisions.
I have started expanding my knowledge beyond most conventional ideas and have made my way into the Japanese stock market. Since I worked in the industries for a majority of my life I can't help but find the Japanese stock market incredibly interesting to me. I feel like a lot of the companies are major industrial entities in the world, I think most people might overlook the importance of some of the companies that trade on the Tokyo stock exchange. Mitsubishi Group is actually a vast conglomerate company which expands across hundreds of companies. Mitsubishi Heavy Industries is responsible for managing its business operations in sectors like aerospace, defense, energy and heavy machinery, which also happen to align with my personal preference of companies that I like to invest in.
As you can see I have added some photos to my idea and I'm not trying to offend anyone when I posted photos of airplanes but this is one of the core business operations of the company and I have to say what I want to. That being said I also added some other photos of Mitsubishi products. The company is famously an engineering company at its core, I don't want to write too much about the history of the company even though I probably can dedicated several paragraphs to just that.
I am going off topic a little bit here so I am going to go back on topic and now write about some of the ways Mitsubishi Heavy Industries uses capital in their business. This is a key element for every investor to pay attention to when deciding whether they will buy shares of a stock or not. Since the company is a conglomerate it will be pretty straight forward, there's really nothing special about how they utilize capital, pretty much the same as other conglomerate companies. I wrote an idea about Berkshire Hathaway some time ago and I think that is a text book example of how an ideal conglomerate company would want to utilize capital. Mitsubishi is a little different though because they are actually an industrial company and not a financial company like Berkshire. So its like comparing apples to oranges essentially.
It would be safe to assume the business model for Mitsubishi Heavy Industries is so incredibly complicated and need I say, unpredictable but I would also use words like reliable or necessary. Since I worked in heavy industries for along time I know it well and its easy for me to interpret the things I think will make the company money over a long period of time. I am starting to feel like it would make me bored to try and write about the specific elements of capital allocation now. In all seriousness I really just like the company and that's why I decided to write this idea today. I will probably keep exploring the Japanese stock market and might come up with more random ideas to share.  Long
Long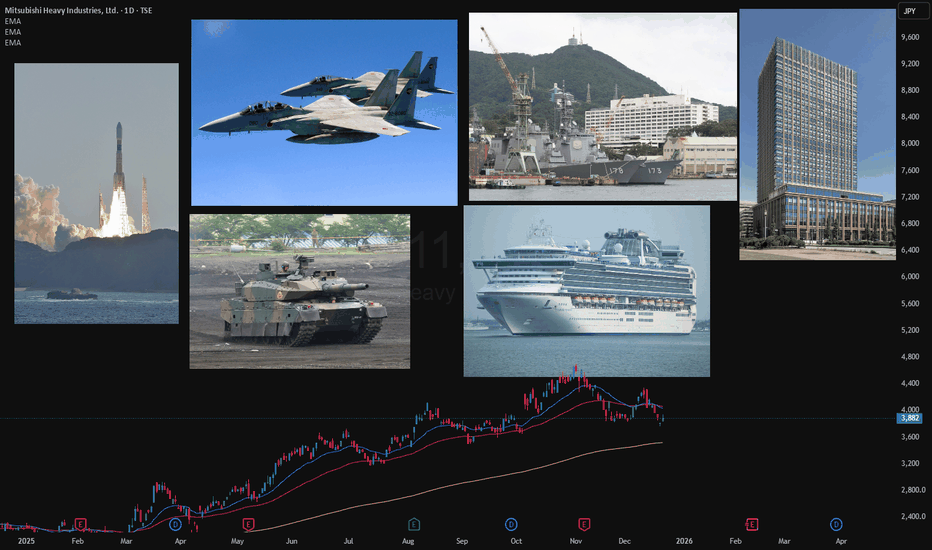
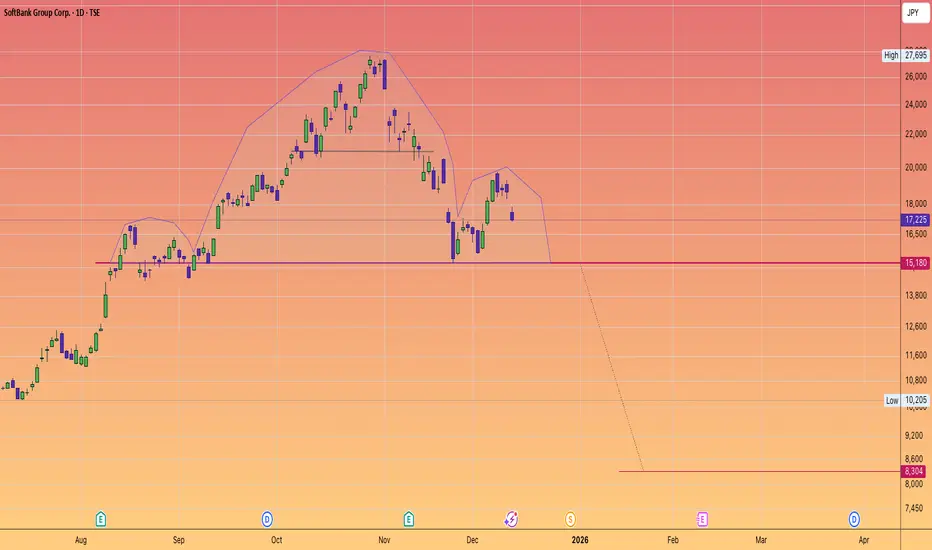
SOFTBANK can drop another 50%Softbank Group shares took a nosedive on Thursday, dragging down Japanese markets as mixed earnings and guidance from cloud giant Oracle raised fresh worries about excessive spending on artificial intelligence.
#Softbank (TYO:9984) dropped 7.7% to a one-week low of 17,210.0 yen by 22:34 ET (03:34 GMT), making it the biggest loser on the Nikkei 225 index, which fell by over 1%.
The decline in Softbank followed a more than 10% drop in Oracle (NYSE:ORCL), which plummeted after its fiscal second-quarter earnings report. Although the company exceeded market expectations for its net income, it fell short on revenue and provided a weaker-than-anticipated outlook for the upcoming quarter.
#Oracle also raised its fiscal 2026 capital expenditure forecast to $50 billion from $35 billion. The mixed earnings, along with expectations of increased capex, reignited concerns about how Oracle intends to profit from its substantial AI data center spending plans. There are also worries about the company’s debt load, following billions in issuances this year, and its significant exposure to OpenAI, which negatively impacted sentiment towards the stock.
BMO analysts pointed out that Oracle’s ties to OpenAI pose some long-term risks, considering the scale of the startup’s spending commitments and uncertainties about how it plans to fulfill those promises.
These worries spilled over to Softbank, which has a heavy investment in OpenAI. Softbank CFO Yoshimitsu Goto recently mentioned to Nikkei that the tech conglomerate is firmly focused on OpenAI and has no interest in funding its rivals.  Short
Short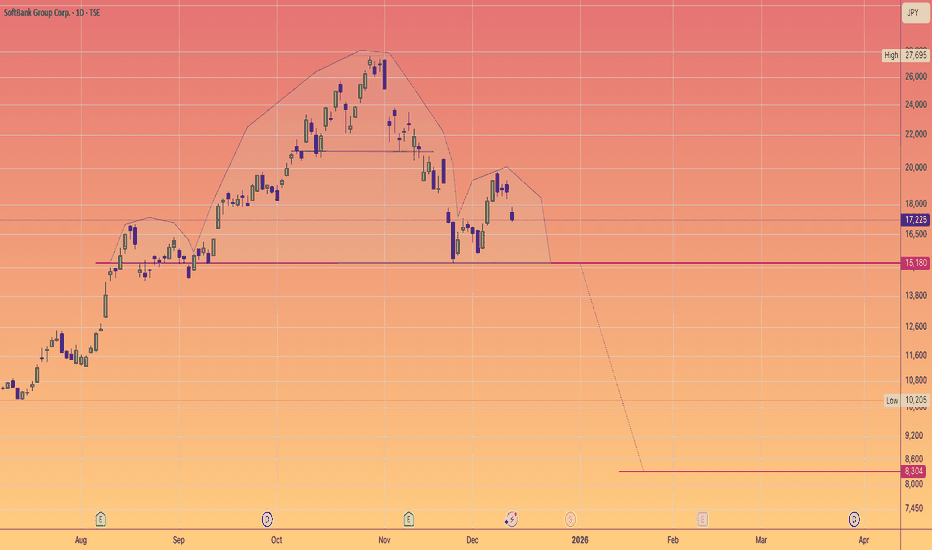
Unique Characteristics about KomatsuSo basically I just got bored and wanted to write an article for Trading View and I have decided to write one for Komatsu. With the help of google as my search engine I will be able to make sure you get the best quality information I can possibly provide. I will talk about all the things I find interesting about Komatsu, I don't really want to talk about how I will trade it because that's kind of a personal thing and I wouldn't want anyone to try and do the same thing as me anyways. I think its important if you do want to buy Komatsu you have your own strategy in place before taking the risk.
There's a little room for upside but ultimately the stock is sort of expensive right now. I used the discounted cash flow model to determine an intrinsic value for Komatsu and I think a good intrinsic value for Komatsu would be about ¥5400. Implying a roughly 6% upside as of this writing.
What I find unique about the company is how they actually use capital in the business model, this is a crucial element when looking at companies because if the company is weak and unable to utilize capital properly then the stock will probably go down as a result, presenting a potentially dangerous hazard to unaware investors. On the other hand if your a predominantly bearish individual you can use this concept to identify stocks to short as a result of increased information.
Information is by far the most valuable skill you can have in the stock market because nobody wants to help you or share their information which they might think is better kept a secret. So let me say this, the more information you have about a company, the better chances you stand of making money from it. I have already shared a ton of valuable information in some of my previous ideas and it makes me happy to try and share, because sharing is caring. Some of my old ideas when I was starting out aren't so good and I'm not proud of them but this is where I am now.
A key working capital management strategy Komatsu uses, is that Komatsu actually manages inventory for their dealers, this can result in variable free cash flow during economic cycles. The "Zero Inventory at Distributors" program is a supply chain management strategy used by Komatsu to minimize the amount of product and parts inventory held by its independent distributors.
By not tying up large amounts of capital in inventory, Komatsu and its distributors have more liquidity. The program significantly lowers costs associated with warehousing, handling, and potential damage or obsolescence of stored goods. With less inventory to manage, the company can respond more quickly to changes in market demand or new trends without being burdened by outdated inventory. It streamlines the entire supply chain process, leading to leaner operations and fewer administrative tasks related to inventory management.
As an investor, I think Komatsu is a great choice for a diversified portfolio if you are looking for exposure to the heavy equipment industrial sector. I already have exposure to Cat and Deere so personally I like the stock. Equipment companies like this benefit from industry specific elements like sales and leasing, repairs and maintenance and parts distribution. The company frequently invests in research and development for new tech like, AI inside of the machines, being more environmentally friendly and increasing operator comforts which all result in customers wanting to buy new products all the time.
Well, thanks for reading my article that's all I would really need to know before buying or selling the stock. I don't think the business model will change very much over time which adds an element of resilience to the price of the stock, just make sure if you want to buy and hold a stock for along time to constantly check the news for the company because business is unpredictable and things change all the time.  Long
Long
 Long
Long
 Long
Long
 Long
Long
 Long
Long
 Long
Long
 Long
Long
 Long
Long
 Long
Long
 Long
Long
 Long
Long
 Long
Long
Japanese Manufacturer Focused On Minimalist Consumer GoodsWHAT THEY DO
Muji, or Ryohin Keikaku, is a Japanese manufacturing and retail company known for its minimalist, functional, and aesthetically pleasing products. With a "no-brand" philosophy, Muji offers a wide range of goods from apparel and household items to furniture and food, all emphasizing simplicity and natural materials. The company operates a global network of directly managed stores and franchises, primarily in Asia, Europe, and North America.
WHY I AM INTERESTED
My interest of course without knowing what they did was that they have had a strong year price action wise. Up over 100%, consistently making higher highs and higher lows, have had an explainable pullback on dividends and a stock split, the chart, MACD and RSI are both now showing that the profit taking might be slowing down and an upward trend is likely to resume - along with a highly identifiable area below the recent lows for a stop loss.
Could be worth a watch.
 Long
Long