Namura Shipbuilding Ltd. (7014)Foreign cargo used to be priced in U.S. dollars (or in the case of gas, euros), but now the ultimate sources of foreign cargo (foreign nations) are changing the form of payment they demand and prefer: Russia is now invoicing its commodity exports to “non-friendly” nations in ruble, not U.S. dollars or euros, and Saudi Arabia is open to China paying for oil in renminbi. It used to be as simple as “our currency, your problem”. Now it’s “our commodity, your problem”.
Shipping used to be about minimizing the time it takes to get commodities from producers to consumers. Time at sea is a function of sea routes, and different sea routes correspond to different types of vessels. In the case of oil, for example, the three main types of vessels are VLCC, Suezmax, and Aframax vessels. VLCCs (very large crude carriers) carry 2 million barrels and are used for long-haul voyages. There are about 800 VLCCs in the world. Suezmax refers to tankers that are capable of passing through the Suez Canal in a laden condition.
Please take a look at the Zoltan newsletters :-)
Corona death analyses in GermanyWelcome to my Corona Death Analysis
*Note because the chart was inserted as an image, the scaling may have shifted slightly, simply scale at the right edge until the orange zero matches the zero line of the chart.
First of all, I know Corona is a delicate subject and also that I analyze the deaths here seems to work a macabre, but the fact is that the numbers are rising and this can have an impact on the German economy, this analysis serves as a complement to my DAX short analysis and is purely scientific nature.
The Dax analysis can be found here (German Only)
Let's get to the analysis:
As we can see from the chart, deaths increased rapidly between January and February, reaching a high of ca 1138.
In February, a bearish SKS formed at the high which had also already reached its target of 371 deaths.
This target line is very often reached again after the Unterstreiten in later upward movements or correction phases and serves us thus as a first "target line"
Furthermore, we can take from the chart an ABC Correct which has the following death numbers as a target.
Target 1 435
Target 2 705
Target 3 900
Target 4 1451
Target 5 1846
Here the death number of 900 is to be seen as the first strong resistance.
At 1451 I expect the end of the rising numbers for the first time, whereas 1846 deaths would be the maximum and at the latest here a trend reversal should take place.
If you liked this idea, I would be pleased about a click on the Like button ;)
If you have any questions, suggestions or a different opinion, don't be afraid to use the comment function.
Thanks a lot
Disclaimer:
Please keep in mind that this is a pure analysis and only reflects what my eye shows me ;)
This analysis is for informational purposes only and is scientific in nature.
This analysis is not based on any fundamental data!
This analysis is not an investment advice and should not be considered as a buy, sell or hold signal.
Always do your own research before investing and seek the advice of a qualified person.
I am not an investment advisor or similar and do not make any investment recommendation here.
Stocks - Softbank is NextIdea for Softbank:
- Evergrande's temporary suspension has it out of sight and out of mind, but it is expected to default on the 18th. How soon they forget. The corporate bond market collapse is not localized, but instead is spreading:
- We have reached the end of a Yen Carry Trade Cycle:
- Japan is #1 in the world in debt, boasting a Debt-To-GDP of 266% ($13T). It would make sense for their debt bust to occur first. Japan is next on the chopping block.
- "SoftBank Group Corp 9984.T has built a global conglomerate of telecoms and tech companies on an ever-growing mountain of debt that major rating agencies categorize as junk." - Reuters
- SoftBank also owns the Vision Fund, the largest tech fund in the world, with great exposure to US tech. Its collapse will be felt around the world.
GLHF
- DPT
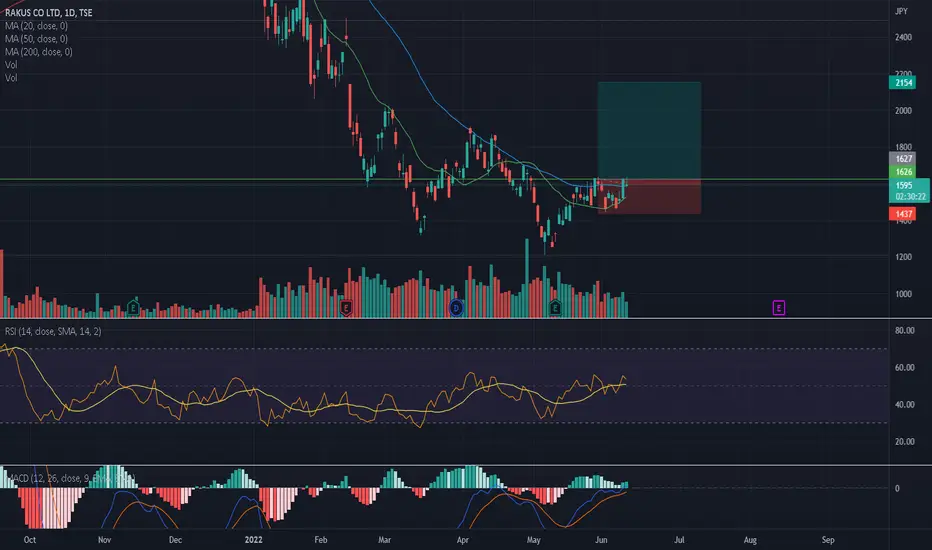
TSE 8818 ANALYSIS TSE:8818 is currently stuck in the 1400 - 1600 area (white box area )
But If price succeeds to break above the white box and closes above the 1600 level , it is very likely to go bullish towards the 1975 - 2000 area as marked by the box .
On the contrary , If it breaks below the box ,and closes below the 1400 level , then it is very likely to drop to the 1120 - 1040 area as marked by the box .
2nd Update: Softbank Gains +21%, Highest Volume Since March 2020A further push higher for Softbank this morning in Tokyo, trading as higher as ¥7680 intraday for a 2-day gain of 21% from my alert on Monday.
In addition, the share traded it's highest volume since March 2020.
For more insights and real-time ideas, whether you are a retail/individual investor or industry professional, get in touch today.