• Products
  • Community
  • Markets
  • Brokers
  • More
Get started
  • Markets
  • /Japan
  • /Stocks
  • /Ideas
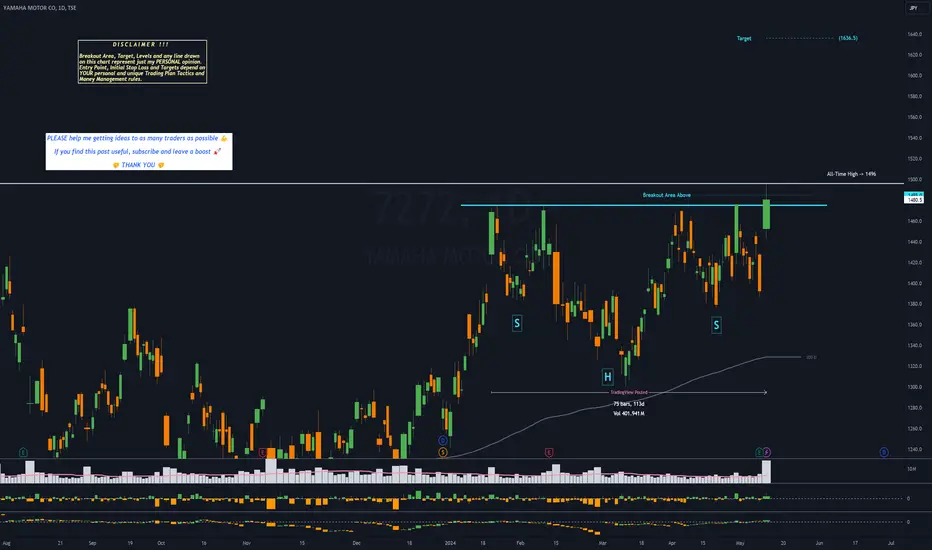
7272 - 4 months HEAD & SHOULDERS══════════════════════════════ Since 2014, my markets approach is to spot trading opportunities based solely on the development of CLASSICAL CHART PATTERNS 🤝Let’s learn and grow together 🤝 ══════════════════════════════ Hello Traders ✌ After a careful consideration I came to the conclusion that: - it is crucial to be quick in alerting you with all the opportunities I spot and often I don't post a good pattern because I don't have the opportunity to write down a proper didactical comment; - since my parameters to identify a Classical Pattern and its scenario are very well defined, many of my comments were and would be redundant; - the information that I think is important is very simple and can easily be understood just by looking at charts; For these reasons and hoping to give you a better help, I decided to write comments only when something very specific or interesting shows up, otherwise all the information is shown on the chart. Thank you all for your support 🔎🔎🔎 ALWAYS REMEMBER "A pattern IS NOT a Pattern until the breakout is completed. Before that moment it is just a bunch of colorful candlesticks on a chart of your watchlist" ═════════════════════════════ ⚠ DISCLAIMER ⚠ The content is The Art Of Charting's personal opinion and it is posted purely for educational purpose and therefore it must not be taken as a direct or indirect investing recommendations or advices. Any action taken upon these information is at your own risk.
TSE:7272Long
by TheArtOfCharting
Daikin Industry - Buy on corrective leg. Major distribution inTSE:6367 Daikin mid-term trend shows clear bullish trend after Ichimoku shows clear uptrend signal. We believe it will reach 28040 over the longer term period
TSE:6367Long
by William-trading
11
9984 on TSEAlthough the Daily uptrend has ended, this is a great level here which I think might be able to restore the trend or at least push price up and despite price is going down, there is no real Supply level left behind..
TSE:9984Long
by dungtinhhd123
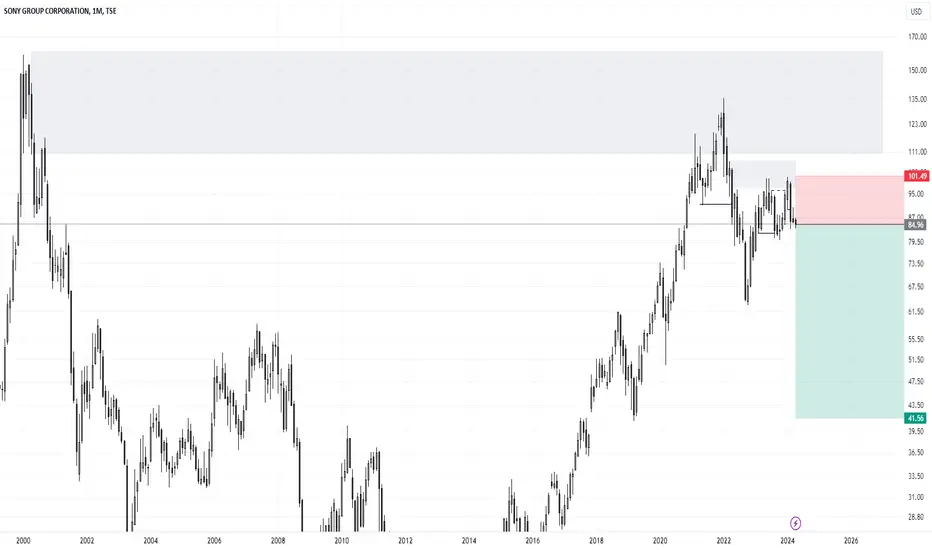
Investment Opportunity SONYWe can see an interesting price action on Sonny which reacted on a Supply Zone of 2000. This reaction led to a break of structure downside and now the price pulled back on a lower timeframe supply. I'm expecting the price now to continue the bearish trend, this is not an optimized sell zone but it's worth risking a little portion of capital on this trade as the momentum is with us.
TSE:6758Short
by EvergreenWealthAdvisor
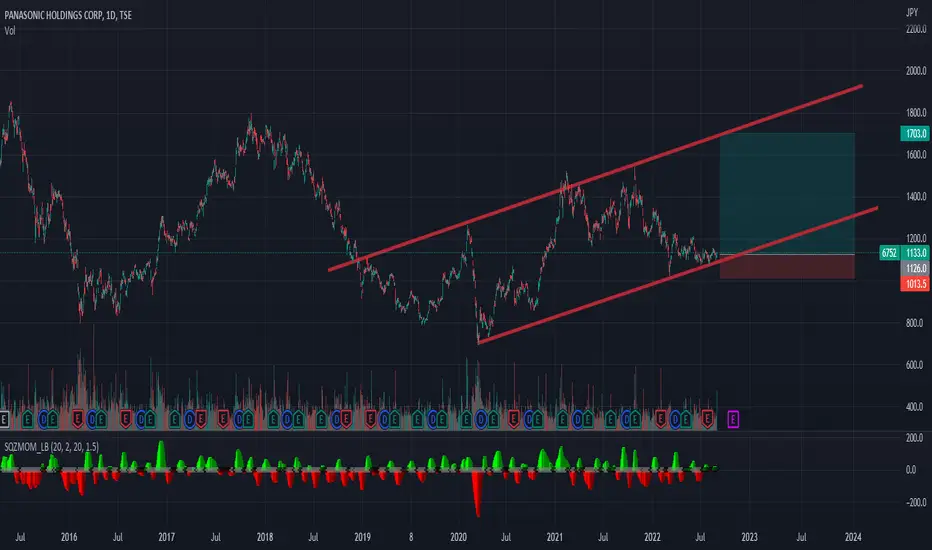
TSE-6752 LONG BATTERY PLANT Investment into new battery plant venture upped to 3.8 billion. bullish on Panasonic
TSE:6752Long
by zingraphics
Updated
4523 on TSE, BUY.Price has hit Weekly Demand. The momentum line on the Daily chart is broken. This level is responsible for that removal.
TSE:4523Long
by dungtinhhd123
Updated
9101 on TSE. A stock to BUY.Weekly is on uptrend so trying to join the trend is understandable. This level is a great point to do it.
TSE:9101Long
by dungtinhhd123
Updated
4661 on TSE, SellI tossed a coin and it landed on the sell side so that's what I would do now.
TSE:4661Short
by dungtinhhd123
CAPCOM CO.CAPCOM Stock Soars to All Time High After RE4 Remake Is the Latest in a Seemingly Unending String of Success CAPCOM shares opened at 4,780 today and have now slightly decreased to 4,840, which is still a 2.22% increase. As you can see from the chart, the Japanese publisher and developer has been mostly on a roll over the past few years, owing to a long string of successful game releases. Around seven years ago, things were much different. In 2016, CAPCOM released the Resident Evil Origins Collection, a rather low-effort compilation of Resident Evil and Resident Evil Zero remasters; Street Fighter V, which was supposed to take the world of fighting games by storm but largely failed due to scarce single player content and poor performance during online multiplayer matches; Umbrella Corps, a generic third-person shooter that even the Resident Evil IP couldn't save from being thoroughly panned by critics and fans alike; and Dead Rising 4, which while decent couldn't save CAPCOM Vancouver from being closed less than two years after its release due to poor sales and the cancellation of the studio's next projects. The rise of the famed developer began in early 2017 with the release of Resident Evil VII: Biohazard, which is largely credited as the spark that reignited CAPCOM's creativity. The developers took a gamble, moving their prized survival horror IP to a completely different playstyle and setting. For the first time in the series, players didn't take charge of a trained cop or member of the special forces but of an ordinary guy who, while desperately looking for his missing wife, finds himself living a nightmare in a godforsaken, sun-drenched spot in Louisiana. Amping up the horror factor was the choice to abandon the third-person camera in favor of first-person view. The risk paid off. The game sold well and was hailed as a return to form for the developer, delivering a momentum that even the stumble of Marvel vs. Capcom Infinite couldn't break.Then, in early 2018, CAPCOM found itself an even bigger golden goose with Monster Hunter: World, which over time became the best-selling game ever made by the Japanese studio. Previously only popular in Japan, World made the franchise far more accessible and palatable to Western audiences. The rest, as they say, is history. Resident Evil 2, Devil May Cry 5, Resident Evil 3, Monster Hunter Rise, Resident Evil Village, and last but certainly not least, the Resident Evil 4 remake that just sold over three million copies in two mere days since its launch. Looking ahead, Street Fighter 6 is poised to redeem even the legendary fighting franchise, at least according to the preview impressions. On the other hand, the next CAPCOM game may turn out to be less than successful. The Japanese publisher was savvy enough to partially insulate itself from the risk by taking Microsoft's money and putting it on Game Pass from day one, though. Then again, not every game can be a hit, and investors are clearly bullish on the company's future prospects, which also include a brand new sci-fi IP (Pragmata, originally scheduled for 2022 but later moved to 2023 and possibly due for another delay given the absence of communication) and the long-awaited Dragon's Dogma 2 by Hideaki Itsuno, which could be another megahit in the making for CAPCOM if it adds online co-op play as most fans are hoping for.
TSE:9697Long
by moonypto
Updated
JAPAN TOBACCO INC, a Japanese stock. It's time to buy.The market is on uptrend on Weekly, this 4H RBR Demand zone is good. Can join the trend with this level. A quick in and out trade, not to hold for too long.
TSE:2914Long
by dungtinhhd123
Updated
ANA HOLDINGS INC, a Japanese stock, selling at 3298Price has arrived at a Weekly Supply zone and reacted off of it. A downtrend has been established. Waiting for price to comeback to this 4H supply level to sell. Stoploss at 3326 and profit target at 3228.
TSE:9202Short
by dungtinhhd123
Updated
8411 (Mizuho Financial Group) - Strong Upside Follow-Through8411 (Mizuho Financial Group) - Strong Upside Follow-Through The green shaded area represents the post-idea price development. The original idea is attached.
TSE:8411
by techpers
9531 (Tokyo Gas Co)Tokyo Gas Co., Ltd., founded in 1885, is the primary provider of natural gas to the main cities of Tokyo, Kanagawa, Saitama, Chiba, Ibaraki, Tochigi, Gunma, Yamanashi, and Nagano. As of 2012, Tokyo Gas is the largest natural gas utility in Japan. The idea is via a custom screener.
TSE:9531Long
by techpers
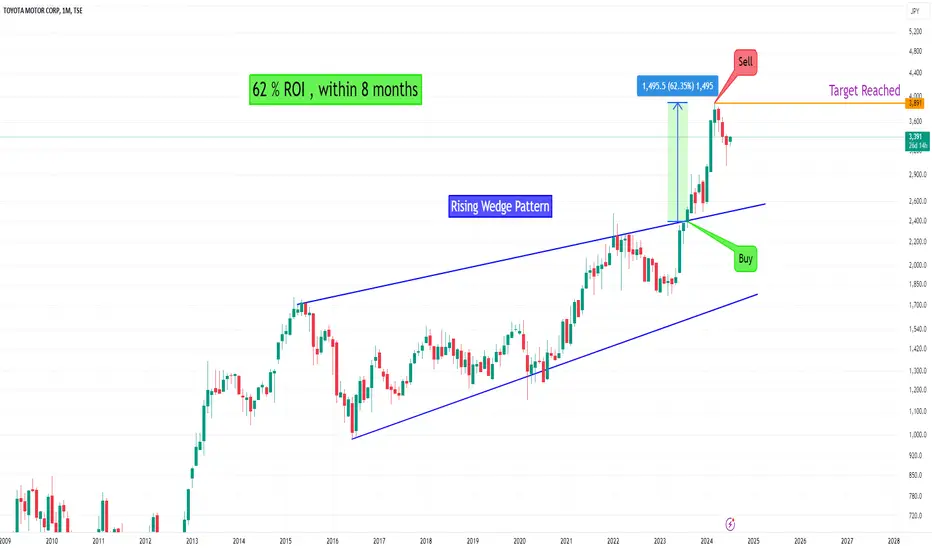
Update: 7203 Update: 7203 The share trading at all-time highs and has advanced from the entry (see original idea attached). Toyota was also I had an a buy idea in July 2022 2000 Yen, now 3700 Yen.
TSE:7203
by techpers
8544 - 5 months ASCENDING TRIANGLE══════════════════════════════ Since 2014, my markets approach is to spot trading opportunities based solely on the development of CLASSICAL CHART PATTERNS 🤝Let’s learn and grow together 🤝 ══════════════════════════════ Hello Traders ✌ After a careful consideration I came to the conclusion that: - it is crucial to be quick in alerting you with all the opportunities I spot and often I don't post a good pattern because I don't have the opportunity to write down a proper didactical comment; - since my parameters to identify a Classical Pattern and its scenario are very well defined, many of my comments were and would be redundant; - the information that I think is important is very simple and can easily be understood just by looking at charts; For these reasons and hoping to give you a better help, I decided to write comments only when something very specific or interesting shows up, otherwise all the information is shown on the chart. Thank you all for your support 🔎🔎🔎 ALWAYS REMEMBER "A pattern IS NOT a Pattern until the breakout is completed. Before that moment it is just a bunch of colorful candlesticks on a chart of your watchlist" ═════════════════════════════ ⚠ DISCLAIMER ⚠ The content is The Art Of Charting's personal opinion and it is posted purely for educational purpose and therefore it must not be taken as a direct or indirect investing recommendations or advices. Any action taken upon these information is at your own risk.
TSE:8544Long
by TheArtOfCharting
Long term Daikin Industries Buy for the SummerAs the summer heat intensifies, so does the need for efficient and reliable cooling solutions. Daikin Industries, a global leader in air conditioning technology, is positioned for a substantial increase in value over the upcoming summer months. Along with technical, it is at the bottom of a support band
TSE:6367Long
by krispytaps
COMSYS Holdings, a Japanese stock, buying at 3227.The market is on uptrend and there is no Supply above. Right now this 4h Demand is the most tradable zone in the chart. This is a pretty wide zone, can be waiting to see if price go deeply into the zone for a better entry. Profit target should be at 3357
TSE:1721Long
by dungtinhhd123
MONTH GARTLEYes.tradingview.com GARTLEY MONTH, I thing that sell time is coming, but it takes time for taking a profit because this is a month timeframe.
TSE:8604
by SergioEstrada
Haseko trendline breaks?As seen on this chart - if the trendline breaks I'll enter long.
TSE:1808Long
by p4917
Updated
9532 bullish As the chart shows - I've entered a stop order and will be long if the trendline breaks.
TSE:9532Long
by p4917
Mitsui & Co., Ltd.: Navigating Trade OpportunitiesHello, Introduction: In the dynamic world of global trade, Mitsui & Co., Ltd. stands as a stalwart in the general trading business. With a diverse portfolio spanning various sectors, the company is catching the attention of investors as it charts a promising course. In this analysis, we explore Mitsui's recent market movements and identify potential opportunities for traders. Market Overview: Mitsui & Co., Ltd. operates across multiple segments, including Iron & Steel Products, Mineral & Metal Resources, Machinery & Infrastructure, Chemicals, Energy, Lifestyle, Innovation & Corporate Development, and Others. This diverse portfolio positions the company as a key player in the global marketplace, contributing to its resilience and adaptability. Technical Analysis: One compelling aspect drawing attention is the formation of a bullish channel, resembling a flag pattern on the price chart. The channel indicates a potential upward trend, signaling a favorable opportunity for traders. The current buy setup suggests an entry point at 4920 JPY, with the first target set at 5788 JPY. Bullish Flag Formation: The flag pattern is a technical analysis tool used to identify continuation patterns in a trend. In Mitsui's case, the formation of a bullish flag within the price chart implies that the previous upward trend may resume. This pattern is characterized by a brief consolidation, represented by the flag, followed by a potential breakout in the direction of the prevailing trend. Trade Strategy: For traders eyeing an entry into Mitsui & Co., Ltd., the suggested buy area at 4920 JPY serves as a strategic starting point. This price level aligns with the lower boundary of the bullish channel, offering a favorable risk-reward ratio. The first target set at 5788 JPY represents a potential price objective based on the continuation of the bullish trend. Traders should monitor the price action closely, with a keen eye on any potential breakout from the flag pattern. Risk Management: While the bullish outlook is promising, it's essential for investors to implement robust risk management strategies. Setting stop-loss orders at appropriate levels can help mitigate potential losses in the event of an unexpected market reversal. Conclusion: Mitsui & Co., Ltd. presents an intriguing opportunity for traders as it forms a bullish flag within its price chart. With a diverse business portfolio and a strong market presence, the company's upward potential is underscored by technical analysis. Traders considering a position in Mitsui should carefully evaluate the risk-reward dynamics and stay vigilant for any developments that may impact the trade. As always, informed decision-making and prudent risk management remain essential in navigating the dynamic landscape of financial markets. Good Luck!!
TSE:8031Long
by thesharkke
Updated
33
SUGI Bullish SetupThe asset has arrived at a great Load-zone currently below its Resistance labeled as R1. The Bullish crab pattern is indicating the potential for a swing to the following targets in case of a breakout over R1. Ni225 Long-term analysis below is now also showing us a minor bullish pullback is in play on the Japanese index on lower time frames.
TSE:7649Long
by Zivul33
Updated
33
Earth Infinity Stock of TSEWait the dump and buy. A Stock to hold over 1000% in the next Year. No SL, no Risk buy not more than 2% of your Accountvalue. Wait the ATH arount 800 JPY. A Stock to hold longer.
TSE:7692Long
by WhaleWaveSurfer
11223344556677889910101111121213131414151516161717181819192020212122222323242425252626272728282929
…999999

Made by humans

Select market data provided by ICE Data Services. Select reference data provided by FactSet. Copyright © 2026 FactSet Research Systems Inc.Copyright © 2026, American Bankers Association. CUSIP Database provided by FactSet Research Systems Inc. All rights reserved. SEC filings and other documents provided by Quartr.© 2026 TradingView, Inc.

More than a product
  • Supercharts
Screeners
  • Stocks
  • ETFs
  • Bonds
  • Crypto coins
  • CEX pairs
  • DEX pairs
  • Pine
Heatmaps
  • Stocks
  • ETFs
  • Crypto coins
Calendars
  • Economic
  • Earnings
  • Dividends
  • IPOs
More products
  • News Flow
  • Portfolios
  • Fundamental Graphs
  • Yield Curves
  • Options
  • Macro Maps
  • Pine Script®
Apps
  • Mobile
  • Desktop
Community
  • Social network
  • Wall of Love
  • Refer a friend
  • House Rules
  • Moderators
Ideas
  • Trading
  • Education
  • Editors' picks
Pine Script
  • Indicators & strategies
  • Wizards
  • Freelancers
  • Paid Spaces
Tools & subscriptions
  • Features
  • Pricing
  • Market data
  • Gift plans
Trading
  • Overview
  • Brokers
  • Brokers comparison
  • The Leap
Special offers
  • CME Group futures
  • Eurex futures
  • US stocks bundle
About company
  • Who we are
  • Space mission
  • Blog
  • Help Center
  • Careers
  • Media kit
Merch
  • TradingView store
  • Tarot cards for traders
  • The C63 TradeTime
Policies & security
  • Terms of Use
  • Disclaimer
  • Privacy Policy
  • Cookies Policy
  • Accessibility Statement
  • Security tips
  • Bug Bounty program
  • Status page
Business solutions
  • Widgets
  • Charting libraries
  • Lightweight Charts™
  • Advanced Charts
  • Trading Platform
Growth opportunities
  • Advertising
  • Brokerage integration
  • Partner program
  • Education program
Community
  • Social network
  • Wall of Love
  • Refer a friend
  • House Rules
  • Moderators
Ideas
  • Trading
  • Education
  • Editors' picks
Pine Script
  • Indicators & strategies
  • Wizards
  • Freelancers
  • Paid Spaces
Business solutions
  • Widgets
  • Charting libraries
  • Lightweight Charts™
  • Advanced Charts
  • Trading Platform
Growth opportunities
  • Advertising
  • Brokerage integration
  • Partner program
  • Education program
Look FirstLook First