Long
Long
 Long
Long
 Long
Long
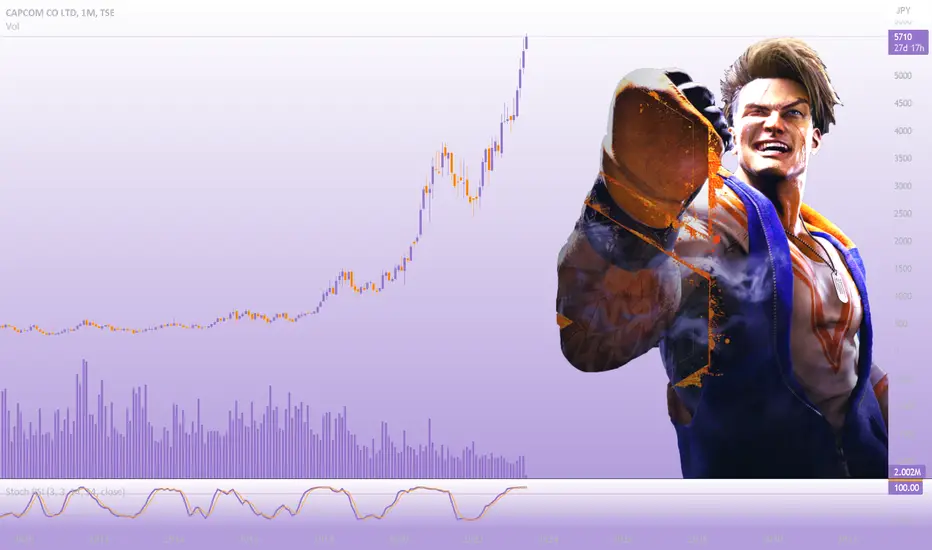
CAPCOM | Sreet Fighter6 & ATH 🔥Capcom stock prices have hit All Time High ahead of the launch for Street Fighter 6, following positive buzz around the anticipated title. looking at a chart, it’s easy to see what normally influences trends many previous spikes in share prices correlate around major Capcom releases, such as a March spike just two weeks before the release of Resident Evil 4 remake
It’s not just actual game releases that can have an affect on share prices a spike in November isn’t correlated with any major releases, though it does follow reports of Capcom making a mobile spinoff of Monster Hunter, as well as news about a potential release date for Street Fighter 6.
This week’s spike also follows a very optimistic forecast on Capcom’s investor relations page, which also predicts 140 billion yen in sales in the next fiscal year (April 2023 to March 2024).
It’s no surprise that Street Fighter 6 would have so much control over Capcom’s financial value- Street Fighter V is their 9th highest-selling title, with over 7 million units shipped. Combined with the announcement of a 2 million dollar prize pool for next year’s Capcom Pro Tour series and positive critical reception, it’s easy to be optimistic that Street Fighter 6’s launch will be huge for the company.
In its end-year financial results published on Wednesday, which cover the year ended March 31, 2023, the Resident Evil publisher said it had sold 41.7 million games during the 12-month period.
That’s up from 32.6 million games the previous fiscal year and breaks its record for the most games sold in a business year. The company said its game sales helped it achieve a sixth consecutive year of record-high profit “at all levels” and its tenth consecutive year of operating income growth.
The company achieved the record sales figure partly with the release of two new titles in its flagship series, Resident Evil 4 (which released a week before the end of the reporting period in March 2023) and Monster Hunter Rise: Sunbreak, which sold around 3.75 million and 5.45 million units.
The vast majority of its sales came from catalog titles, which Capcom defines as games released in the previous fiscal year or earlier.these sales, which it says were mostly made up of titles in the Monster Hunter, Resident Evil and Devil May Cry series, reached 29.3 million units – exceeding the 24 million units in the previous fiscal year.Capcom said 12.4 million in sales was made up of new titles. The company released 35 ‘new’ SKUs in FY23, including Mega Man: Battle Network Legacy Collection, Resident Evil Village: Gold Edition, Monster Hunter Rise Deluxe Edition, Capcom Arcade 2nd Stadium and Capcom Fighting Collection.
89.4% of its game sales during the 12 months were digital (37.3 million) and 19.7% were sold in its native Japan (8.2 million). Other than MH Rise: Sunbreak and RE4, the company’s top-selling titles during the FY were Monster Hunter Rise (3.7m), Resident Evil 2 (2.25m) and Resident Evil 3 (1.95m).
Capcom said it expects to break records for sales and profit again in its current fiscal year, ending March 31, 2024, which includes the release of Street Fighter 6 in June and new IP Exoprimal in July.Capcom‘s president recently said the company aims to sell 10 million copies of Street Fighter 6, which would break the series record of 7 million met by Street Fighter V
what an easy trade and profit 🥂
 Long
Long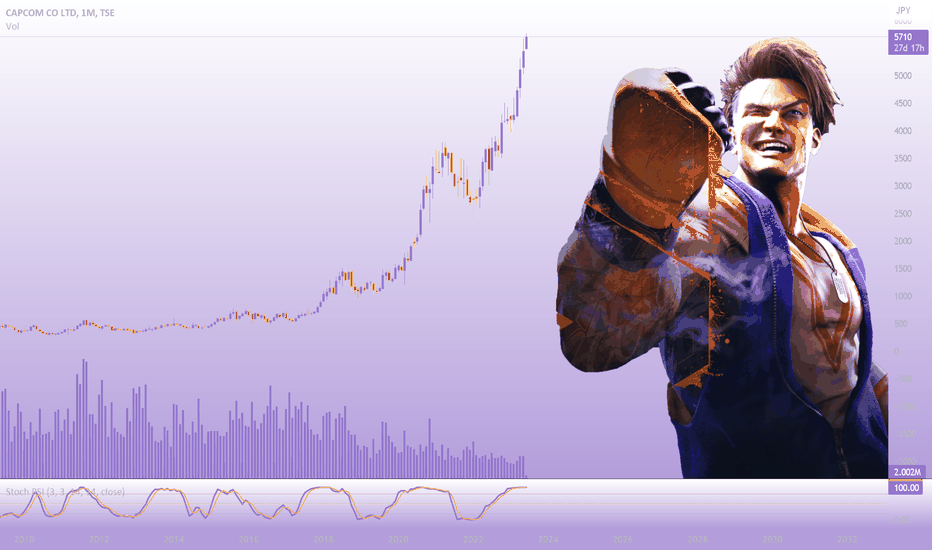
 Long
Long
 Long
Long
 Long
Long
 Long
Long
 Long
Long
 Long
Long
 Long
Long
Square Enix | SQNXFSquare Enix Holdings Co., Ltd. engages in the provision of entertainment contents and services. It operates through the following segments: Digital Entertainment, Amusement, Publication, and Merchandising. The Digital Entertainment segment handles the design, development, sale, license sale, and operation of digital entertainment contents mainly on computer games. The Amusement segment provides the design, development, manufacture, sale, and rental of amusement equipment as well as conducts the planning, development, and distribution of arcade game machines. The Publishing segment provides comic magazines, comics, and game strategy books. The Merchandising segment includes the planning, production, distribution, and licensing of derivative works. The company was founded on September 22, 1975 and is headquartered in Tokyo, Japan.
The Company is listed on the Prime Market of the Tokyo Stock Exchange, with the stock code "9684," and prepares its financial statements according to the Japan GAAP
In the Digital Entertainment segment, the HD (High-Definition) Game subsegment, the fiscal year ended March 31, 2023 saw the release of "CRISIS CORE -FINAL FANTASY VII- REUNION," "FORSPOKEN," and "OCTOPATH TRAVELER II." However, because new titles generated fewer earnings than in the previous year, which had seen the launch of "OUTRIDERS," "NieR Replicant" and "Marvel’s Guardians of the Galaxy," the sub-segment’s net sales declined versus the previous fiscal year.
Net sales declined versus the previous fiscal year in the MMO (Massively Multiplayer Online) Game sub-segment, in part because of the lack of any expansion pack launches for "FINAL FANTASY XIV."
The Games for Smart Devices/PC Browser sub-segment saw a decline in net sales versus the previous fiscal year because of weak performances by existing titles.In the Amusement segment, net sales and operating income for the fiscal year ended March 31, 2023 rose versus the previous year because of sharp year-on-year increase in same-store sales.
In the Publication segment, sales of both digital and print media were solid in the fiscal year ended March 31, 2023, but higher prices on printing paper and other inputs led to higher costs. This, combined with other factors such as increased advertising expenses led to a year-on-year decline in operating income.
In the Merchandising segment, the fiscal year ended March 31, 2023 saw brisk sales of products including new character merchandise based on major intellectual properties. However, while net sales rose versus the previous fiscal year, operating income declined, partly due to changes in the sales mix by product.
FINAL FANTASY XVI going to publish soon and gonna be a hit and good success for SE co.
did you try FF XVI demo? any game recommendation?
 Long
Long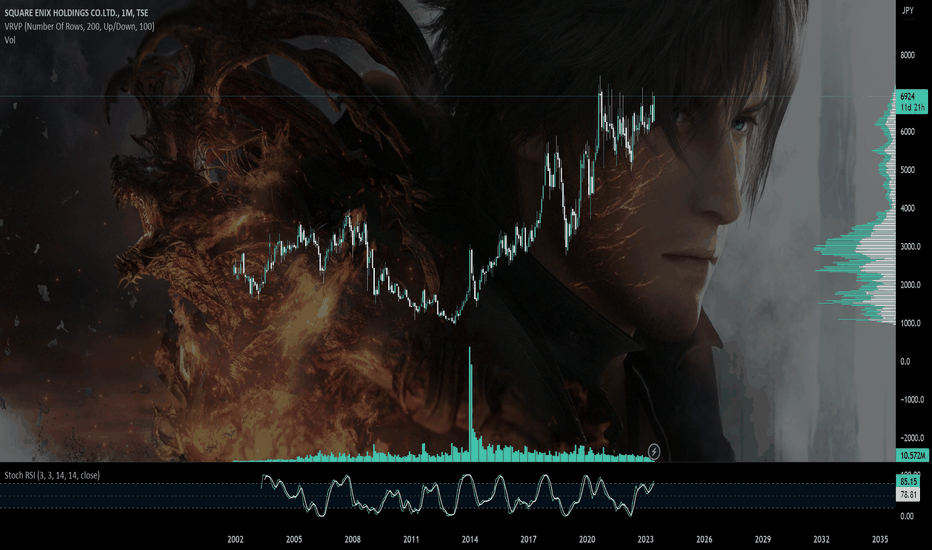
Levels of Interest $MHI (7011)TA on levels of interest for $7011
Please note that this is a preliminary research paper and you should continue to do your own research (DYOR). Information about assets can change rapidly, and it's essential to stay updated with the most recent developments.
Notes on how I personally use my charts/NFA:
Each level L1-L3 and TP1-TP3 (Or S1-S3) has a deployment percentage. The idea is to flag these levels so I can buy 11% at L1 , 28% at L2 and if L3 deploy 61% of assigned dry powder. The same in reverse goes for TP. TP1: 61%, TP2:28% and TP3:11%. If chart pivots between TP's, in-between or in Between Sell levels these percentages are still respected. I like to use the trading range to accumulate by using this tactic.
Just my personal way of using this. This is not intended or made to constitute any financial advice.
This is not intended or made to constitute any financial advice.
FED Macro Situation Consideration:
All TP's are drawn within the context of a return to FED neutral policy. I do not expect these levels to be reached before tightening is over.
NOT INVESTMENT ADVICE
I am not a financial advisor.
The Content in this TradingView Idea is for informational purposes only, you should not construe any such information or other material as legal, tax, investment, financial, or other advice. Nothing contained within this idea constitutes a solicitation, recommendation, endorsement, or offer to buy or sell any securities or other financial instruments in this or in in any other jurisdiction in which such solicitation or offer would be unlawful under the securities laws of such jurisdiction.
All Content on this idea post is information of a general nature and does not address the circumstances of any particular individual or entity. Nothing in the idea/post constitutes professional and/or financial advice, nor does any information on the idea/post constitute a comprehensive or complete statement of the matters discussed or the law relating thereto. You alone assume the sole responsibility of evaluating the merits and risks associated with the use of any information or other Content on the idea/post before making any decisions based on such information. Long 
 Long
Long
 Long
Long
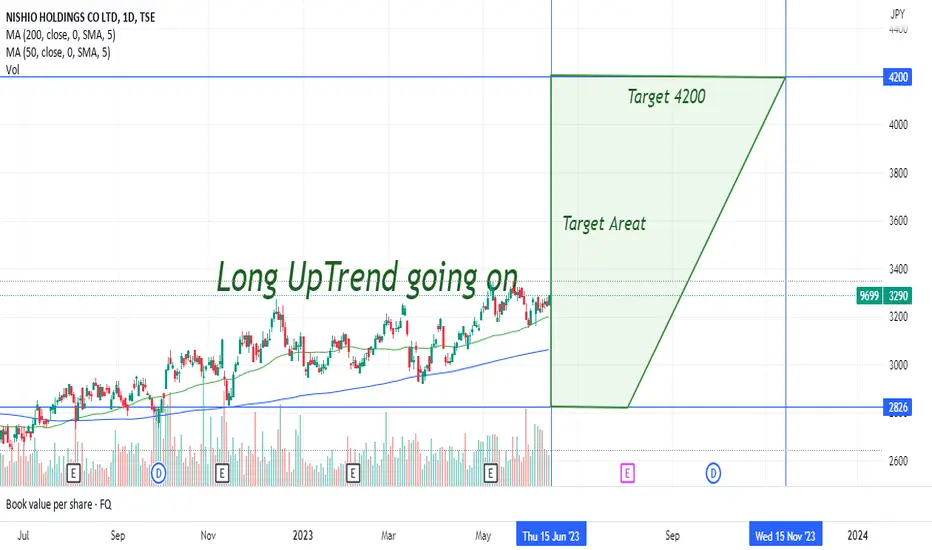
WA INC - 7683 JPY - Trend Value Trigger=============================TRADE LAYOUT============================
1. IDENTIFY THE TREND
a) Series of new higher high swing and higher low swing: YES
b) 10 EMA > 30 EMA > 50 EMA: YES
c) EMAs pointing upwards: YES
d) Output: UPTRENDING MARKET
e) Bias: LOOKING FOR LONG OPPORTUNITIES CLOSE TO VALUE AREAS
2. IDENTIFY THE VALUE AREA
a) 10 EMA: OFFERING SUPPORT SINCE END OCTOBER, 2022
b) 50 EMA: -
c) Support area: -
d) Demand area: -
e) Trendline: -
3. LOOK FOR A TRIGGER IN THAT AREA
a) Candlestick pattern: BULLISH MARUBOZU
b) Break of structure in the lower timeframe: -
4. SET A STOP LOSS
a) 1 average bar size (14 periods) below the value are: 3100 JYP (10 EMA - 87 JPY)
b) 1 ATR below the value area: -
5. SET A TARGET
a) Resistance area:
b) Supply area: JPY 4200 - JPY 4400
c) 10 EMA: -
d) 50 EMA: -
e) Trendline: -
6. POSITION SIZE / RISK MANAGEMENT:
a) No more that 1% of your total equity at risk on an single trade, therefore: (Stop Loss (set logically as per above) / Entry Point) x 100 / Total Equity < 1
b) No more than 30% of your total equity at risk at any given moment
=============================WHY?===================================
Put simple (and it is):
WHY TRADING WITH THE TREND?
The trend is your friend. Trends do bend, but until that unavoidable moment comes, the odds get tacked on your side if you trade in the same direction of the trend.
WHAT IS A VALUE AREA?
Just an area where the odds are, the bulls will step up and support the price, or the bears will step up and stem a sell off.
WHAT MAKES YOU THINK YOU CAN IDENTIFY THEM?
Rational behavior from big institutions, herd behavior, quantitative anchors, qualitative anchors from other traders. These are usually translated into price movements, price movements that leave traces, even patterns.
Let me give you a couple of examples for argument's sake:
a) You want to fly to Japan, so you jump into your flight tickets' website to purchase your tickets. Today you see that the price of a ticket is 500$. You think it is too expensive, so you decide to wait for tomorrow to check if the price decreases. Tomorrow you check again, and now the price is 600$. What do you do next? Perhaps you wait another day, and then you see the price getting back to 500$, those 500$ now look cheap to you so you buy (support). Or perhaps then it becomes 700$ and the FOMO kicks in and you buy because tomorrow it might as well be 800$.
b) Investment Fund Warren Buffet and Co has done their due diligence, applied their fundamental assessments and decided stock X is cheap at 10$ and purchased stock X, which happened to be trading at 10$. Like a ton of stock, billions worth of it. A month later, after stock x rallied, it got back to trading at 10$. Unless the macro situation has dramatically changed, what do you think Hedge Fund Warren Buffet and Co will do now?
c) Richcoin is trading at all time highs. Everyone in your neighborhood holds richcoin. The cab drivers are thinking of quitting their jobs because they hold richcoin. Are you really going to be the only loser who does not buy richcoin? - Herding.
d) Investment Fund Jesse Livermore and Co has stacked loads of shares of stock Y. It has already started to conduct a marketing campaign. Since it is necessary for the public to buy and price up their stock, they can risk having an early sell off in their stock hampering their campaign. So they can't risk having the public panicking with sharp price declines … yet. So what happens when the price touches key EMAs like the 10 and the 50 (w), they support the price and the uptrend.
Behaviors like these echo through the markets. And they leave traces.
WHY DO YOU NEED TO IDENTIFY THESE AREAS?
Because you want one of two things:
1. Your idea is supported by the team you chose to support.
2. Your idea is not supported but in any case you get the chance to know that immediately and not waste further time and money with your idea
HOW ABOUT THE TRIGGER? WHY DO YOU NEED IT?
Ok, the price is trading in a value area. But can you really tell in which direction it is moving now? Well, you never, but if you identify a directional pattern springing in that area, then once again you stack the odd on your side if you just follow that direction, even though shakeout will sooner or later knock on every trader's door.
AND POSITION SIZING?
This should even have been rule number zero. Nobody, and I mean, nobody knows the future. No technical analysis or fundamental or whatsoever, will ever save you from the uncertainty of the future and the complexity of reality. That means that this is a game of stacking odds in your favor, not aiming at certainties. That means that this is a game of guaranteeing your survival in the markets each day, to make sure you have an everlasting exposure to favorable odds and positive black swans.
====================================================================
Having this said, discretionary trading is a heavy burden, so many choices, so many doubts … At a certain stage of your development as a trader you will realize that setting a quantified trading system, which translates these biases and ideas into numbers, conditions, signals and commands, and is time tested, is your next step as a trader.
If that's the stage where you're at, then feel free to drop by my store for backtested, quantified trading strategies across all markets and asset classes.
Cheers,
Tenacious Tribe - Back Tested, Quantified Trading Strategies & Studies
50% discount on all products! Use code MOX Q3C WXRX on our website to unlock this limited offer.  Long
Long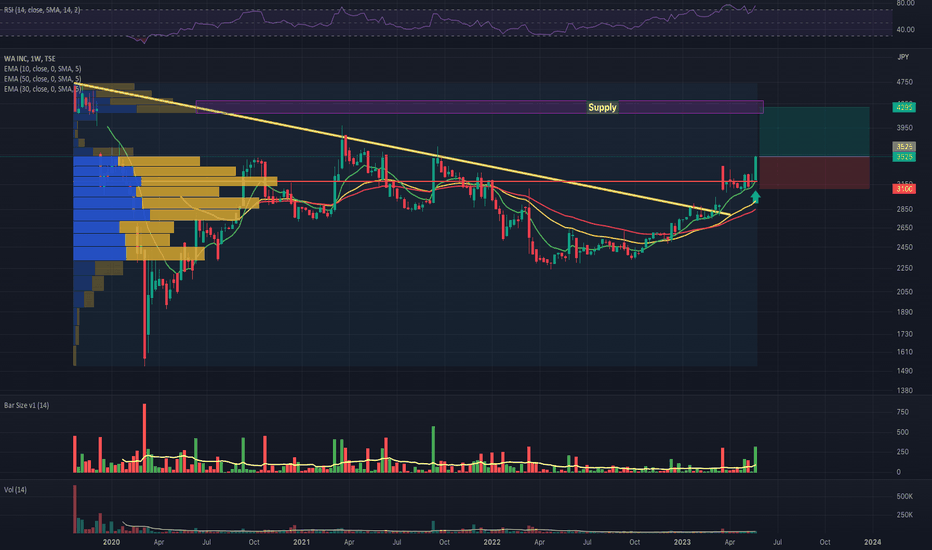
 Long
Long
Fujitsu Limited WCA - Symmetrical TriangleCompany: Fujitsu Limited
Ticker: 6702.T
Exchange: Tokyo Stock Exchange
Sector: Technology
Introduction:
Hello and welcome to our technical analysis session! Today we are focusing on Fujitsu Limited as observed on the weekly chart on the Tokyo Stock Exchange. An intriguing symmetrical triangle formation has caught our attention, which may act as a bullish continuation.
Symmetrical Triangle Pattern:
A symmetrical triangle is a price pattern characterized by converging trend lines and oscillating price within the pattern. It can serve as a continuation or a reversal signal. The breakout direction tends to predict the subsequent trend direction.
Analysis:
Preceding this consolidation phase, Fujitsu's price exhibited a clear uptrend. The ongoing consolidation phase, shaped as a symmetrical triangle, has been forming for 616 days. There are three points of contact with the triangle's upper boundary and two with its lower boundary.
Notably, this consolidation phase takes place above the 200 EMA, indicating a bullish environment. If we see a weekly candlestick close above 18400, it could serve as an opportune moment for a long position entry.
Assuming a valid breakout, our projected price target is at 26025, translating into a potential price rise of approximately 41.33%.
Conclusion:
The weekly chart of Fujitsu Limited presents a potential bullish continuation pattern in the form of a symmetrical triangle. A confirmed breakout above the triangle's upper boundary could offer a promising long position entry.
As always, please perform your own due diligence and consider appropriate risk management strategies when investing. Not financial advice!
Thank you for joining this analysis. If you found it useful, please like, share, and follow for more insightful market updates. Happy trading!
Best regards,
Karim Subhieh Mitsubishi Heavy Industries WCA - Rectangle PatternCompany: Mitsubishi Heavy Industries
Ticker: 7011
Exchange: Tokyo Stock Exchange
Sector: Industrial
Introduction:
Hello and welcome to this week's technical analysis. We're focusing on Mitsubishi Heavy Industries, as represented on the weekly chart of the Tokyo Stock Exchange. The company's stock has formed an interesting rectangle pattern over the past 378 days, acting as a potential bullish continuation.
Rectangle Pattern:
A Rectangle pattern can act as a continuation or reversal signal, formed when price oscillates between two parallel lines—support and resistance. The eventual breakout direction might determine the continuation or reversal of the current trend.
Analysis:
Previously, Mitsubishi Heavy Industries' price has been on an upward trend, and this Rectangle pattern might signal a bullish continuation. The price has been moving within two clearly defined boundaries—upper at 5650 and lower at 4476. Both these boundaries have experienced two touch points each.
Significantly, this consolidation is occurring above the 200 EMA. Presently, we have seen a fresh breakout above the upper boundary, and we're patiently awaiting the weekly candle's close to plan a potential long entry.
Assuming the breakout is valid, our projected price target is at 6826, indicating a potential price rise of about 20.74%.
Conclusion:
The weekly chart of Mitsubishi Heavy Industries presents a possible bullish continuation pattern in the form of a Rectangle. A confirmed breakout above the upper boundary could offer a promising long entry opportunity.
As always, conduct your own research and consider appropriate risk management strategies when investing.
Thank you for joining this analysis session. If you found it valuable, please like, share, and follow for more market insights. Happy trading!
Best regards,
Karim Subhieh  Long
Long