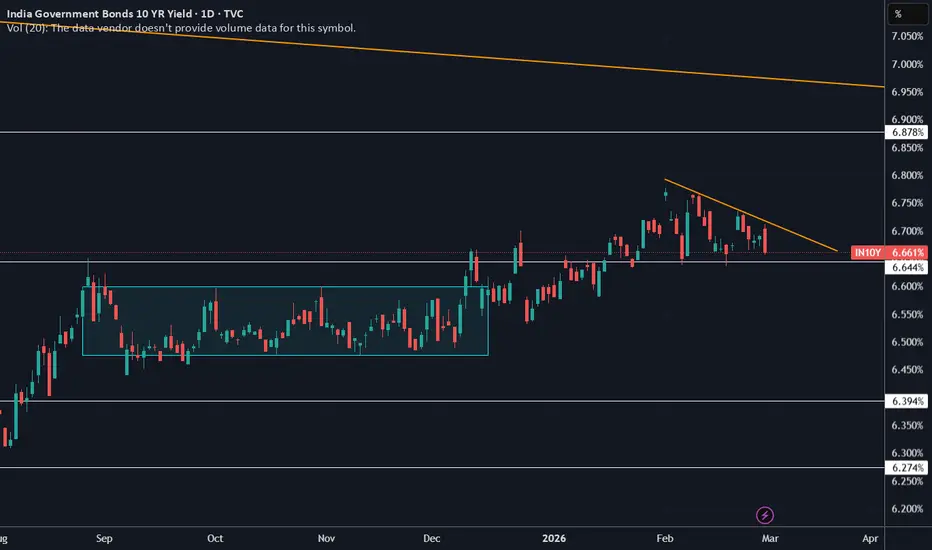
Long
Long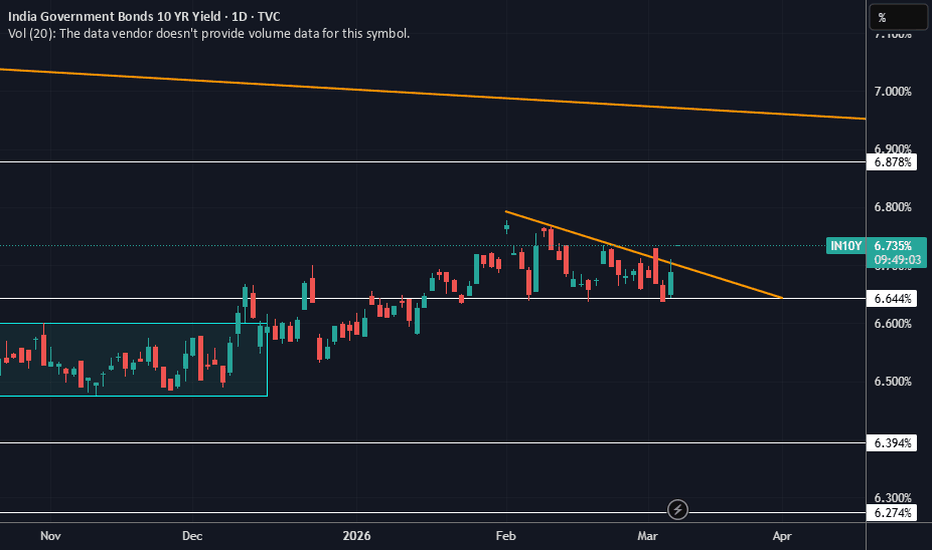
 Short
Short
Long 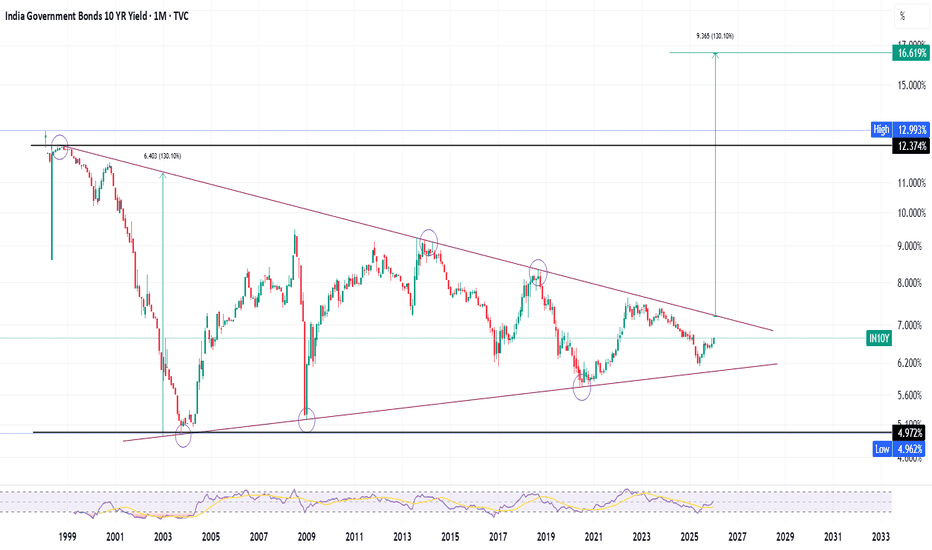
Education

Education

Macro-Driven Risk PlanningAnticipate the Economy, Protect Capital, and Seize Opportunities
In an era of rapid globalization, volatile markets, and frequent economic shocks, traditional risk management approaches are no longer sufficient. Investors, businesses, and financial institutions need a broader, more forward-looking framework—one that recognizes how macroeconomic forces shape risk and return across asset classes and industries. Macro-Driven Risk Planning is that framework. It is a strategic approach that places global and domestic economic trends at the center of decision-making, helping stakeholders anticipate risks, adapt proactively, and convert uncertainty into opportunity.
Understanding Macro-Driven Risk Planning
Macro-driven risk planning focuses on analyzing large-scale economic variables—such as inflation, interest rates, GDP growth, fiscal and monetary policy, currency movements, geopolitical developments, and global liquidity conditions—to assess potential risks before they materialize. Instead of reacting after markets move, this approach enables planning ahead of the cycle. It recognizes that asset prices, business performance, and capital flows are deeply influenced by macro forces that operate beyond individual companies or sectors.
Why Macro Factors Matter More Than Ever
Today’s financial ecosystem is highly interconnected. A change in U.S. Federal Reserve policy can impact Indian bond yields, emerging market currencies, commodity prices, and equity valuations within days. Rising crude oil prices can increase inflation, pressure central banks to tighten policy, and ultimately slow economic growth. Macro-driven risk planning captures these linkages, ensuring that risk assessment is not done in isolation but within the context of the broader economic environment.
Core Pillars of Macro-Driven Risk Planning
1. Inflation and Interest Rate Analysis
Inflation erodes purchasing power and directly influences interest rate decisions by central banks. Macro-driven risk planning evaluates inflation trends—both headline and core—to forecast rate movements. Higher rates can reduce equity valuations, increase borrowing costs, and impact real estate and debt-heavy businesses. Planning around these shifts helps in adjusting asset allocation and leverage exposure in advance.
2. Monetary and Fiscal Policy Monitoring
Central bank actions and government spending programs are powerful drivers of market behavior. Expansionary policies may fuel asset rallies, while tightening cycles often increase volatility. A macro-driven approach tracks policy signals, speeches, budget announcements, and liquidity indicators to anticipate changes in market sentiment and risk levels.
3. Growth Cycles and Economic Indicators
GDP growth, employment data, industrial production, and consumer demand provide insight into where the economy stands in the business cycle. Early-cycle, mid-cycle, and late-cycle environments each carry distinct risk profiles. Macro-driven planning aligns investment and business strategies with the prevailing growth phase, reducing exposure during downturns and increasing it during recoveries.
4. Currency and Capital Flow Dynamics
Global capital flows respond quickly to interest rate differentials, political stability, and growth prospects. Currency volatility can significantly impact returns, especially for exporters, importers, and foreign investors. Macro-driven risk planning integrates currency outlooks into decision-making, using hedging or diversification to manage foreign exchange risk.
5. Geopolitical and Structural Risks
Trade wars, sanctions, elections, regulatory changes, and geopolitical conflicts can disrupt markets overnight. Macro-driven planning incorporates scenario analysis for such events, ensuring preparedness rather than panic. It also considers long-term structural shifts such as demographic changes, energy transitions, and technological disruption.
Benefits of Macro-Driven Risk Planning
Proactive Risk Management
Rather than responding after losses occur, macro-driven planning identifies early warning signals. This proactive stance allows timely portfolio rebalancing, cost control, and strategic pivots.
Improved Capital Allocation
By understanding where macro tailwinds or headwinds exist, capital can be allocated more efficiently—toward sectors, geographies, or asset classes with favorable risk-reward profiles.
Reduced Volatility and Drawdowns
Aligning strategies with macro conditions helps avoid excessive exposure during fragile economic phases, reducing portfolio volatility and protecting downside risk.
Enhanced Strategic Confidence
Decisions grounded in macro analysis are less emotional and more disciplined. This builds confidence among investors, stakeholders, and leadership teams, especially during uncertain periods.
Application Across Stakeholders
Investors use macro-driven risk planning to adjust asset allocation between equities, bonds, commodities, and cash based on economic cycles.
Businesses apply it to manage input costs, interest rate exposure, expansion timing, and international operations.
Financial institutions rely on macro frameworks to stress-test portfolios, manage credit risk, and comply with regulatory requirements.
From Risk Avoidance to Opportunity Creation
Macro-driven risk planning is not only about protection—it is also about opportunity. Economic slowdowns may create attractive valuations, policy stimulus can ignite new growth sectors, and currency shifts can boost export competitiveness. By understanding macro trends early, organizations can position themselves to benefit while others react too late.
Conclusion
In a world defined by uncertainty, ignoring macroeconomic forces is itself the greatest risk. Macro-Driven Risk Planning provides a structured, intelligent, and forward-looking approach to navigating complexity. By integrating economic insights with strategic planning, it empowers investors and businesses to protect capital, manage volatility, and capitalize on emerging opportunities. The future belongs to those who plan not just for what is visible today, but for the macro forces shaping tomorrow. Education 
Stock Market LearningA Complete Guide for Retail Investors, HNIs, FIIs, DIIs & Institutional Participants
The stock market is a dynamic ecosystem where different types of investors participate with distinct objectives, capital sizes, risk appetites, and strategies. For anyone serious about stock market learning—whether a beginner retail investor or an aspiring professional—understanding how Retail Investors, High Net-Worth Individuals (HNIs), Foreign Institutional Investors (FIIs), Domestic Institutional Investors (DIIs), and large Institutions operate is essential. This knowledge not only builds confidence but also helps investors align their decisions with market realities rather than emotions or rumors.
1. Understanding the Stock Market Learning Process
Stock market learning is not just about buying and selling shares. It involves:
Understanding market structure
Studying price action and volume
Learning fundamental and technical analysis
Observing institutional behavior
Managing risk, psychology, and discipline
Every participant leaves a footprint in the market. Learning to identify and interpret these footprints is what separates informed investors from speculative traders.
2. Retail Investors: The Foundation of the Market
Retail investors are individual participants who invest relatively smaller amounts. They form the largest group in terms of numbers and play a crucial role in market liquidity.
Key Characteristics:
Limited capital compared to institutions
Often influenced by news, social media, and tips
Usually focus on short- to medium-term gains
Increasingly active due to easy access via online platforms
Learning Focus for Retail Investors:
Basics of equity, derivatives, and mutual funds
Technical indicators like support, resistance, RSI, and moving averages
Fundamental analysis of company balance sheets, earnings, and growth potential
Risk management techniques such as stop-loss and position sizing
Retail investors must understand that markets are not always rational in the short term. Education helps them avoid panic selling, overtrading, and emotional decisions.
3. High Net-Worth Individuals (HNIs): Strategic Market Movers
HNIs bridge the gap between retail and institutional investors. They invest large sums and often have access to professional advisory services.
Key Characteristics:
Significant capital deployment
Ability to influence mid-cap and small-cap stocks
Longer investment horizon than retail investors
Use of structured products, PMS, and alternative investments
Learning Focus for HNIs:
Portfolio diversification across asset classes
Sector rotation strategies
Advanced derivatives and hedging techniques
Understanding liquidity risks in smaller stocks
HNIs focus more on capital preservation along with growth. Learning helps them reduce concentration risk and avoid becoming trapped in illiquid investments.
4. Foreign Institutional Investors (FIIs): Global Capital Drivers
FIIs are large overseas funds, hedge funds, pension funds, and asset managers investing in domestic markets. Their flows can significantly impact market trends.
Key Characteristics:
Massive capital inflows and outflows
Sensitive to global interest rates, currency movements, and geopolitics
Often drive large-cap index movements
Highly data-driven and research-oriented
Learning Focus for Tracking FIIs:
Understanding FII flow data and its impact on indices
Correlation between global markets and domestic equities
Role of currency exchange rates
Impact of global monetary policy
For retail and HNI investors, learning to track FII behavior provides valuable insights into broader market direction.
5. Domestic Institutional Investors (DIIs): Market Stabilizers
DIIs include mutual funds, insurance companies, pension funds, and domestic financial institutions. They often act as counterbalances to FIIs.
Key Characteristics:
Long-term investment outlook
Consistent inflows through SIPs and insurance premiums
Strong influence during market corrections
Preference for fundamentally strong companies
Learning Focus for Understanding DIIs:
Mutual fund portfolio disclosures
SIP flow trends
Sector allocation strategies
Long-term compounding principles
DIIs play a crucial role in stabilizing markets during periods of heavy FII selling, making them important players to monitor.
6. Institutional Investors: The Smart Money
Institutional investors include large asset management firms, hedge funds, sovereign wealth funds, and proprietary trading desks.
Key Characteristics:
Access to advanced analytics and research
Large block trades and algorithmic execution
Focus on risk-adjusted returns
Strong emphasis on compliance and governance
Learning Focus for Institutional-Level Thinking:
Market microstructure and liquidity
Volume profile and order flow analysis
Risk modeling and drawdown control
Macro-economic and sectoral analysis
Retail investors can significantly improve results by learning how institutions think, rather than trying to compete with them.
7. How Market Learning Helps Align with Big Players
One of the biggest mistakes retail participants make is trading against institutional trends. Stock market learning teaches:
How accumulation and distribution phases work
Why breakouts with volume matter
How institutions enter positions gradually
Why patience often outperforms aggressive trading
By aligning with institutional behavior, investors improve probability and consistency.
8. Importance of Risk Management Across All Categories
Regardless of investor type, risk management remains central:
Retail investors focus on capital protection
HNIs manage portfolio-level risk
FIIs hedge currency and macro risks
DIIs balance long-term commitments
Institutions use quantitative risk models
Learning proper risk management prevents catastrophic losses and ensures longevity in the market.
9. Psychology and Discipline: The Hidden Curriculum
Stock market learning is incomplete without mastering psychology:
Controlling fear during corrections
Avoiding greed during rallies
Sticking to predefined strategies
Accepting losses as part of the process
Professional investors survive because of discipline, not prediction.
10. Conclusion: Stock Market Learning as a Lifelong Journey
The stock market is a shared platform where retail investors, HNIs, FIIs, DIIs, and institutions interact daily. Each group brings unique strengths and influences price discovery in its own way. True stock market learning lies in understanding these roles, respecting market structure, and continuously upgrading knowledge.
For retail investors, learning builds confidence. For HNIs, it ensures strategic growth. For institutions, it maintains efficiency and discipline. Those who commit to continuous learning are the ones who not only survive but thrive across market cycles. Education 
Long 
Education

Index Rebalancing Impact 1. What Is Index Rebalancing?
An index is a benchmark that tracks the performance of a selected group of securities, such as the Nifty 50, Sensex, S&P 500, or MSCI indices. Each index follows predefined rules regarding:
Number of constituents
Eligibility criteria (market capitalization, liquidity, free float)
Weighting methodology (market-cap weighted, equal-weighted, factor-based)
Index rebalancing occurs at regular intervals—quarterly, semi-annually, or annually—when the index provider reviews and updates its constituents and weights. Stocks may be added, removed, or reweighted based on changes in market capitalization, liquidity, corporate actions, or methodology updates.
2. Why Index Rebalancing Is Necessary
Markets are dynamic. Company valuations, liquidity profiles, and business fundamentals change over time. Without rebalancing, an index could become outdated or misrepresentative. Rebalancing ensures:
The index remains aligned with its objective
Accurate representation of the market or sector
Consistency and credibility for benchmark users
For example, if a fast-growing company’s market cap increases significantly, its index weight must rise. Conversely, declining or illiquid companies may be removed.
3. Role of Passive Investing in Rebalancing Impact
The rise of passive investing has dramatically increased the importance of index rebalancing. Exchange-Traded Funds (ETFs), index mutual funds, and pension funds replicate indices mechanically. When an index changes, these funds must buy or sell stocks to match the new composition—regardless of price or fundamentals.
This forced buying and selling creates predictable demand and supply shocks, leading to:
Sudden price movements
Volume spikes
Temporary mispricing
As passive assets grow, rebalancing effects have become stronger and more visible.
4. Impact on Stock Prices
a) Stocks Added to an Index
When a stock is added:
Passive funds must buy the stock
Demand increases sharply
Prices often rise before and on the rebalancing date
This phenomenon is known as the “index inclusion effect.” In many cases, the price rally begins after the announcement and peaks near the effective date.
b) Stocks Removed from an Index
When a stock is removed:
Passive funds are forced sellers
Supply increases suddenly
Prices often decline
This is referred to as the “index exclusion effect.” The negative impact may persist for some time due to reduced visibility and lower institutional ownership.
5. Liquidity and Volume Effects
Index rebalancing days are among the highest-volume trading sessions in markets. Key impacts include:
Sharp increase in traded volumes
Higher market depth in index-heavy stocks
Temporary liquidity stress in smaller stocks
Large-cap stocks usually absorb flows smoothly, while mid-cap and small-cap stocks may experience exaggerated price moves due to thinner liquidity.
6. Volatility During Rebalancing
Rebalancing can increase short-term volatility, especially:
Near the closing session on the effective date
In stocks with large weight changes
In indices with high passive ownership
Intraday price swings, large block trades, and closing-auction imbalances are common. However, this volatility is usually event-driven and short-lived, not necessarily a reflection of fundamental risk.
7. Impact on Index Weights and Sector Allocation
Rebalancing does not only change individual stocks—it also affects sectoral exposure. For example:
Higher weight to IT or banking if those sectors outperform
Reduced weight to underperforming sectors
This has a cascading effect:
Sector ETFs must rebalance
Portfolio asset allocation changes
Relative sector performance may shift temporarily
8. Effects on Active Investors and Traders
a) Arbitrage Opportunities
Active traders often try to profit from predictable rebalancing flows:
Buying stocks expected to be added
Short-selling stocks likely to be removed
However, these strategies are competitive and require precise timing, cost control, and liquidity management.
b) Tracking Error Considerations
Active funds benchmarked to indices must manage tracking error. Sudden index changes can:
Increase deviation from benchmark
Force portfolio realignment
Impact short-term performance metrics
9. Long-Term Fundamental Impact
A key debate is whether index rebalancing has lasting fundamental effects. Research suggests:
Short-term price impact is strong
Long-term impact is mixed
Inclusion can improve:
Analyst coverage
Institutional ownership
Corporate visibility
However, it does not automatically improve business fundamentals. Over time, stock prices tend to realign with earnings, growth, and balance-sheet strength.
10. Market Efficiency and Criticism
Index rebalancing has raised concerns about market efficiency:
Prices move due to flows, not fundamentals
Passive investing may amplify bubbles
Overcrowding in index heavyweights
Critics argue that excessive index concentration can distort capital allocation. Supporters counter that rebalancing improves transparency, discipline, and cost efficiency for investors.
11. Indian Market Perspective
In India, index rebalancing of Nifty 50, Nifty Bank, Nifty Next 50, Sensex, and MSCI India has significant impact due to:
Rising ETF and FPI participation
Increasing passive AUM
Lower liquidity in mid-cap stocks
MSCI rebalancing, in particular, attracts large foreign flows and often causes sharp price and volume changes in affected stocks.
12. How Investors Should Approach Rebalancing Events
Long-term investors should avoid emotional reactions and focus on fundamentals
Short-term traders should be cautious of volatility and execution risks
Portfolio managers should plan transitions early to reduce market impact
Understanding announcement dates, effective dates, and expected flows is crucial.
13. Conclusion
Index rebalancing is far more than a technical adjustment—it is a powerful market-moving event. Driven by the growth of passive investing, rebalancing influences prices, liquidity, volatility, and investor behavior across global and Indian markets. While the immediate impact is often mechanical and temporary, the broader implications for market structure, efficiency, and capital allocation are profound.
For anyone active in financial markets, understanding index rebalancing is no longer optional—it is essential for informed decision-making, risk management, and opportunity identification. Education 
Education
Education

Education