Long
Long
 Long
Long
BURJEEL's Potential ReversalBURJEEL is showing signs of a potential trend reversal, with price reclaiming the 50-day EMA and forming a series of higher lows after a prolonged downtrend.
Fundamentally, the story is strengthening too: patient volumes are growing, H1 2026 EBITDA rose 24.6% and net profit jumped 97%, while expansion across the UAE and Saudi Arabia provides further growth catalysts. A sustained break above the 150-day EMA could strengthen the bullish setup and open the door towards the AED 1.50–1.70+ region. Watching for confirmation, but the risk/reward is becoming increasingly attractive.
OVERALL SHARIAH ASSESSMENT
Confidence Score: 8/10
Burjeel Holdings' core business is healthcare, which is permissible under common AAOIFI screening principles. The main issue historically was its relatively high conventional bank debt. However, this changed materially in July 2026 when Burjeel refinanced most of its bank debt through a USD 500 million Shariah-compliant Sukuk. Only around AED 78 million remained drawn under the FAB revolving facility as of 31 July 2026. Its cash position is modest relative to its market value, and no material non-compliant revenue was identified. The company also has strong underlying business momentum, with H1 2026 revenue of AED 2.8 billion and underlying net profit up 97.4%. Based on the latest information available, Burjeel is likely Shariah compliant, although investors should re-screen it periodically because debt levels, market capitalization and income composition can change.
Disclaimer:
This report is generated using publicly available information and commonly accepted Islamic stock screening methodologies. It is intended for educational purposes only and is not a religious ruling (fatwa) or financial advice.  Long
Long
 Long
Long
 Short
Short
ADIB — Abu Dhabi Islamic Bank: Daily Technical OutlookADX:ADIB — Abu Dhabi Islamic Bank: Daily Technical Outlook & Trendline Breakout Consolidation
Abu Dhabi Islamic Bank (ADIB) is consolidating above a major descending trendline breakout on the daily timeframe. After correcting from its peak at 26.70 AED , the stock formed a series of lower highs ( 23.90 AED , 23.20 AED , 22.30 AED ) before breaking out of the primary falling trendline (blue line) and compressing near current levels around 21.36 AED .
---
1. Price Action & Structural Breakdown
Primary Trendline Breakout: Price successfully breached the multi-month descending resistance line (solid blue line) around 21.00 – 21.50 AED .
Symmetrical Consolidation / Mini Channel: Post-breakout, the price is holding above the macro ascending support trendline (brown line near 18.50–19.00 AED) and is bound between short-term support around 20.00 AED (pink line) and immediate supply at 22.00 – 22.30 AED (orange line).
Structural Support Base: Higher lows are forming along the long-term ascending trendline, confirming buyer interest on pullbacks.
---
2. Technical Indicators Analysis (1D Timeframe)
-- Relative Strength Index (RSI - 14):
RSI Value: Holds at 53.86 (above signal line at 51.60), reflecting steady bullish momentum.
Ascending Trendline Support: RSI is following an upward-sloping support line (dashed orange line), maintaining a healthy structure above the 50 mark.
-- MACD (12, 26, 9):
MACD Line / Signal: Floating near the zero axis with the MACD line at 0.0284 and signal line at 0.0869 .
Histogram: Small red bars flattening out (-0.0585), signaling that selling momentum has dried up and a bullish crossover is nearing.
-- Volume Profile: Daily volume sits at 1.46M against a 20-period average of 4.05M , reflecting low-volume consolidation prior to the next expansion move.
---
3. Key Levels to Watch
Immediate Support: 20.80 – 21.00 AED
Major Floor / Stop Level: 20.00 AED
Immediate Overhead Resistance: 22.00 – 22.30 AED
Secondary Target: 23.20 – 23.90 AED
Macro Target: 26.70 AED (Previous All-Time High)
---
4. Actionable Trading Scenarios
___ Bullish Scenario (Breakout Above 22.30 AED):
A daily closing above 22.30 AED confirms the post-breakout continuation, unlocking further upside momentum toward earlier resistance levels.
Entry: On a confirmed daily close above 22.30 AED or on a pullback retest toward 21.00 AED.
Target 1: 23.20 AED
Target 2: 23.90 AED
Target 3: 26.70 AED
Stop Loss: Below 20.00 AED.
___ Bearish / Risk Scenario:
A failure to defend 20.80 AED followed by a breakdown below 20.00 AED invalidates the immediate bullish setup, risking a drop toward the primary macro baseline near 18.50 – 19.00 AED .
---
Summary:
ADIB is coiling inside a post-breakout consolidation structure. As long as buyers hold the price above 20.00 AED , the bias favors an upside breakout past 22.30 AED toward 23.20 AED and 23.90 AED . Short 
 Long
Long
Long 
 Long
Long
Short 
EMAAR: Massive Gap and Rising Wedge Point to Further DownsideHi!
The daily chart for Emaar Properties reveals a significant shift in market sentiment. After a parabolic run, the stock suffered a violent gap down, and the current price action suggests this was not just a flash in the pan, but the start of a deeper corrective phase.
Technical Breakdown
The Exhaustion Gap: The massive gap down from the $17.00 level is the most striking feature of this chart. This is a clear "breakaway gap" that signals a total collapse of the previous bullish trend. These gaps often act as major resistance on any relief rallies, and as we can see, the price hasn't even come close to filling it.
Rising Wedge (Bearish Continuation): Following the initial crash, the stock has formed a Rising Wedge pattern. While it might look like a recovery to the untrained eye, this is a classic bearish continuation structure. The price is drifting higher on diminishing conviction, and the narrowing range indicates that the "Sales pressure" highlighted in the volume profile is starting to weigh heavy again.
Volume Confirmation: Notice the surge in volume during the initial drop (the yellow oval). High volume on a massive downward move confirms that institutional sellers were exiting positions. The subsequent bounce into the wedge has been on much lower relative volume, which typically precedes a breakdown.
----------------------------------------
Outlook and Targets
The path of least resistance remains firmly to the downside. The rising wedge is a "ticking clock," and once the lower support line snaps, we expect the downward momentum to accelerate.
Primary Target (9.61): This is the immediate structural goal. It aligns with previous historical consolidation and acts as the first major safety net.
Secondary Demand Zone (8.80 – 8.90): If the 9.61 level fails to hold the slide, we are looking at a move into the grey demand zone. This area represents a critical long-term support floor where we might finally see significant buyer interest return.
Short 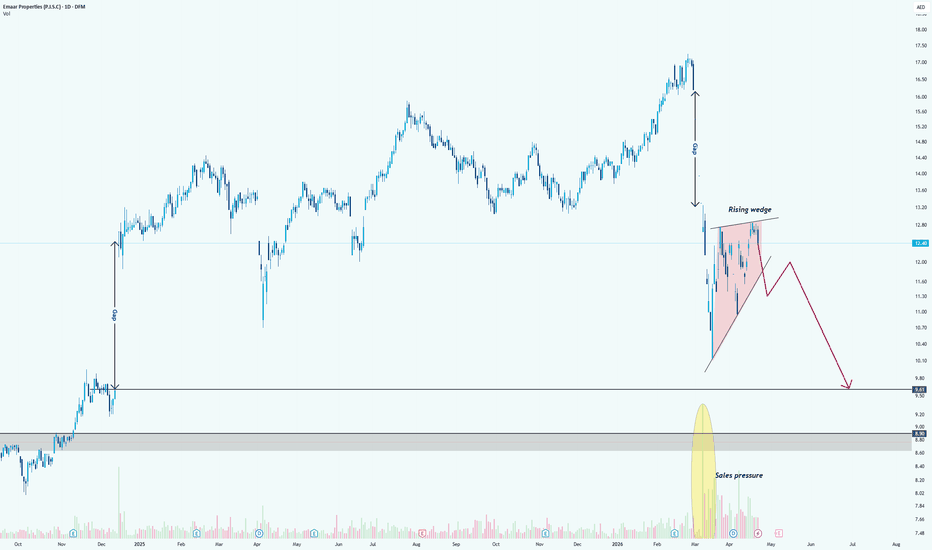
 Long
Long
 Short
Short
 Short
Short
 Long
Long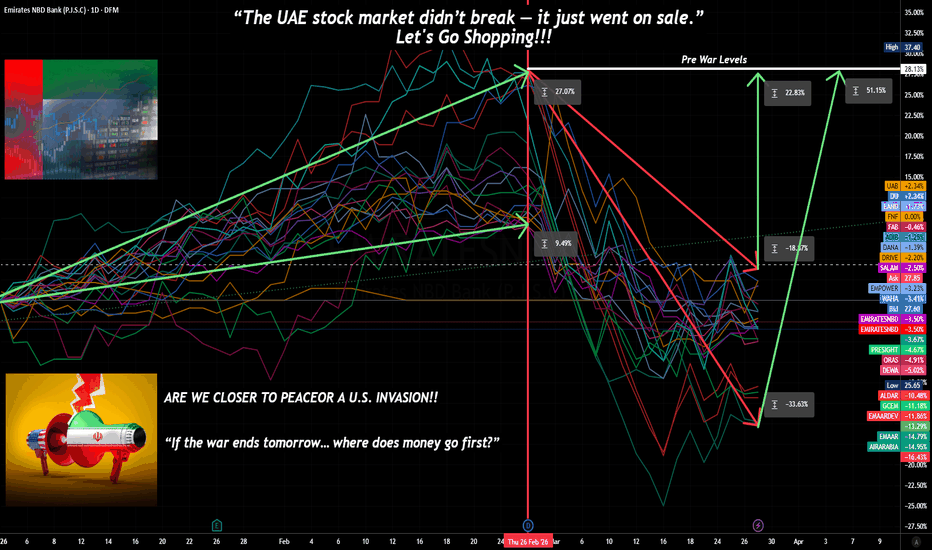
Emaar: A High-Quality Asset Caught in a Low-Quality Selloff📊 Emaar Properties (EMAAR) – Investment View
Emaar Properties
On a fundamental basis, we believe Emaar presents a compelling investment opportunity at current levels.
🧠 Background
Emaar is the dominant real estate developer in Dubai, with a globally recognized portfolio that includes:
Burj Khalifa
Dubai Mall
Downtown Dubai master developments
The company benefits from:
Strong brand equity
Recurring income streams (malls, hospitality, rentals)
High exposure to Dubai’s real estate cycle
Over the past few years, Emaar has experienced:
A massive earnings recovery post-COVID
Strong property sales driven by:
Foreign capital inflows
Population growth
Dubai’s positioning as a global hub
Despite this, the stock continues to trade at historically low valuation multiples (~6x P/E).
📉 Structure Since Then
Since the COVID bottom, the company has:
Delivered consistent revenue and earnings growth
Improved margins through better project mix
Strengthened its balance sheet
At the same time:
The stock has underperformed fundamentals
Valuation has remained compressed despite strong performance
This divergence has created a valuation gap between price and intrinsic value.
⚠️ Recent Price Action (March 2026)
The recent pullback in Emaar was not just routine profit-taking.
A major part of the decline came from the Iran–U.S./Israel war shock, which triggered a sharp risk-off move across UAE assets.
Since the conflict began:
Emaar shares fell more than 26%
Dubai’s broader real-estate equity segment fell by roughly 30%
Dubai equities suffered their worst weekly performance in nearly six years during the selloff
This move appears to have been driven by:
Geopolitical risk repricing
Fear that Dubai could lose some of its safe-haven appeal
Concerns over weaker foreign capital flows into UAE property
Early signs of softer real-estate transaction activity
Importantly:
👉 This was not only a technical reset, it was a war-driven repricing event layered on top of existing oversupply and cycle concerns.
And this line should also be tightened:
📊 Why the Stock Fell Recently
The decline can be attributed to:
The Iran war and direct regional spillover risk
A sharp derating in UAE and Gulf equities
Fears of disruption to Dubai’s property demand and transaction momentum
Existing concerns around future supply and cycle normalization
However:
Earnings remain strong
Sales backlog remains solid
Cash flow generation is intact
👉 No structural break in the business
📈 Current Setup
Emaar is now trading:
At ~6x earnings (below historical average ~7.8x)
With strong:
Cash flows
Dividend yield
Development pipeline
At the same time:
Dubai continues to attract:
High-net-worth individuals
Foreign investors
Businesses relocating
👉 Long-term demand drivers remain intact
🎯 Valuation Context
Current analyst targets:
Low: ~16 AED
Median: ~18–19 AED
High: ~22+ AED
This implies:
Limited downside at current levels
Attractive upside potential (~40–60%)
Even at the lower analyst estimates, implied upside = 30%
Relative valuation:
Trading below historical average
Trading below global peers (adjusted for growth)
🔥 Investment Thesis
We believe:
Emaar is a high-quality cyclical asset trading at depressed multiples
The market is pricing in:
A full real estate downturn
Which is not yet visible in fundamentals
Key drivers going forward:
Continued demand from international buyers
Strong backlog converting into revenue
Recurring income from malls and hospitality
Capital returns (dividends)
👉 The risk/reward is skewed to the upside
⚠️ Strategy
We are monitoring for:
Stabilization in Dubai real estate data
Continued earnings strength
Any signs of demand deterioration
Key risks:
Oversupply in Dubai
Macro slowdown
Interest rate sensitivity
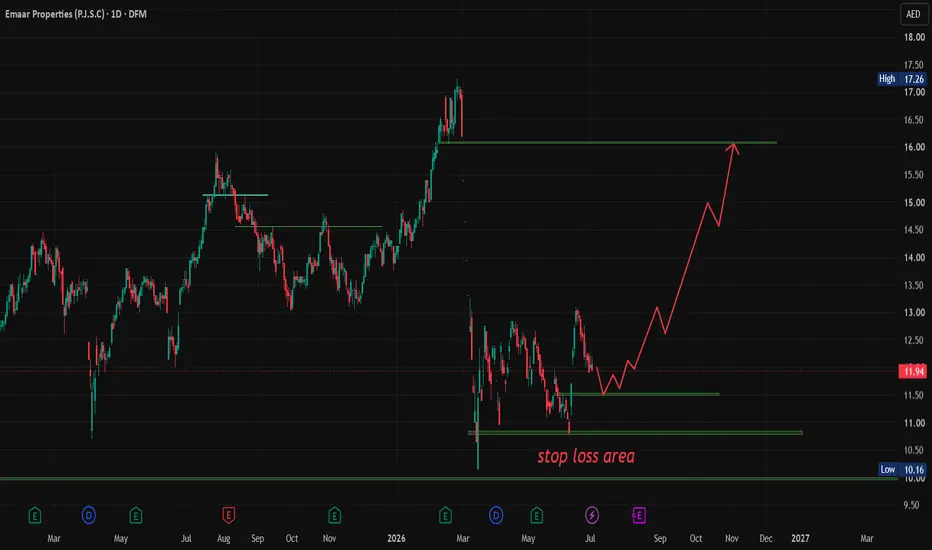
⬛ Technical Analysis
On a technical basis, the stock has been trading within a well-defined ascending channel, repeatedly testing both support and resistance levels over an extended period.
Recently, price action broke below the lower boundary of this channel, signaling short-term weakness.
However, the stock has since bounced off the 200-day EMA on the weekly timeframe, a level widely regarded as a strong long-term support zone.
Given this reaction at a key technical level, we believe:
The breakdown may prove to be a false move / deviation
The stock is likely to reclaim the channel in the near term
👉 Overall, the technical structure suggests support is holding and a recovery back into the prior trend is probable.
🏁 Final Take
👉 Emaar is trading like a cyclical peak stock, but operating like a mid-cycle growth company
Strong fundamentals
Discounted valuation
Clear upside path
👉 We are not chasing momentum, we are buying mispricing in a dominant asset Long 
Short 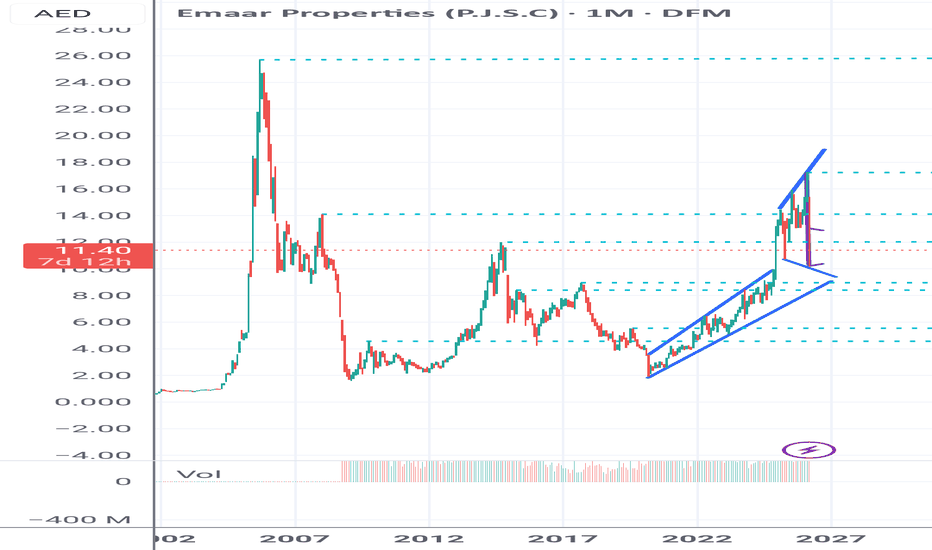
Short 
 Long
Long