• Products
  • Community
  • Markets
  • Brokers
  • More
Get started
  • Markets
  • /United Arab Emirates
  • /Stocks
  • /Ideas
FAB started correctionWe can correct to low 13 and if market structure did not help then we drop to 13.60s which can have best entry for next leg up. This AUG ATR around One dirham and if we manage to print 12.60 as low we can still visit the high of JULY
ADX:FABLong
by Kayuae
11
DANA GAS_ Next Target is Wedge Pattern Top, Achieve +99% PROFIT DANA GAS PJSC is forming a Wedge Pattern. The Next Target is the Wedge Pattern Top, Offering a chance to Achieve a +99% PROFIT. A Breakout is expected in the market once this wedge pattern is reached. This is Long-Term Analysis, must follow the Trend Continuation Technique. Guess the 2nd Target ????? Support me; I want to Help People Make PROFIT all over the "World".
ADX:DANALong
by TradingTrillionairesOfficial
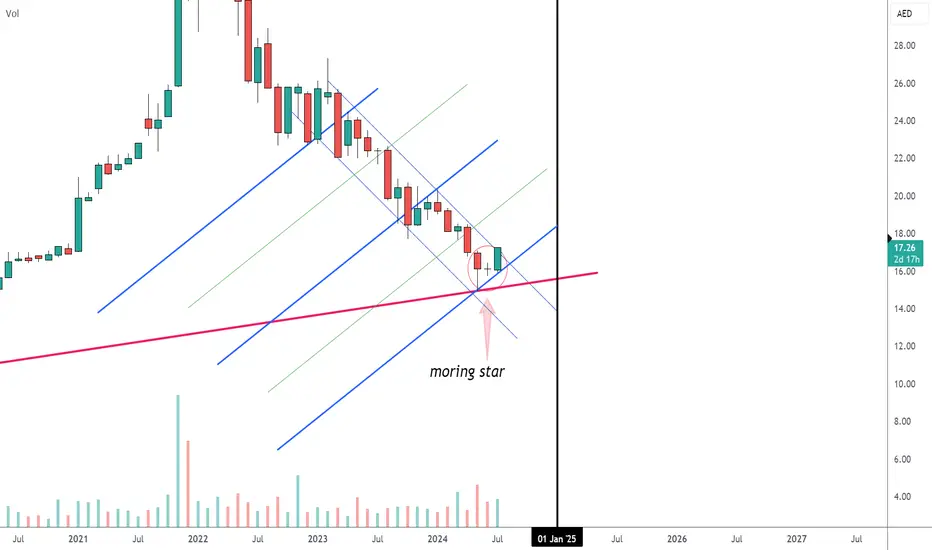
Eand Pls check the monthly CHART shows us a Moring Start that is a power full indication of a trend reversal on the way since its a MONTHY chart. The lower time frames are also aligned with this market structure change and PRICE action is shown higher highs and higher lows in progress.
ADX:EANDLong
by Kayuae
11
Emirate Integrated Next Target is AED 10.60 , +74% PROFITEmirate Integrated Trading in Side Waves or Box since 11 years. Expecting Breakout above the side waves and the Target is AED 10.60..... OFFERING the chance to make +74% Percentage Profit. Support me; I want to Help People Make PROFIT all over the "World".
DFM:DULong
by TradingTrillionairesOfficial
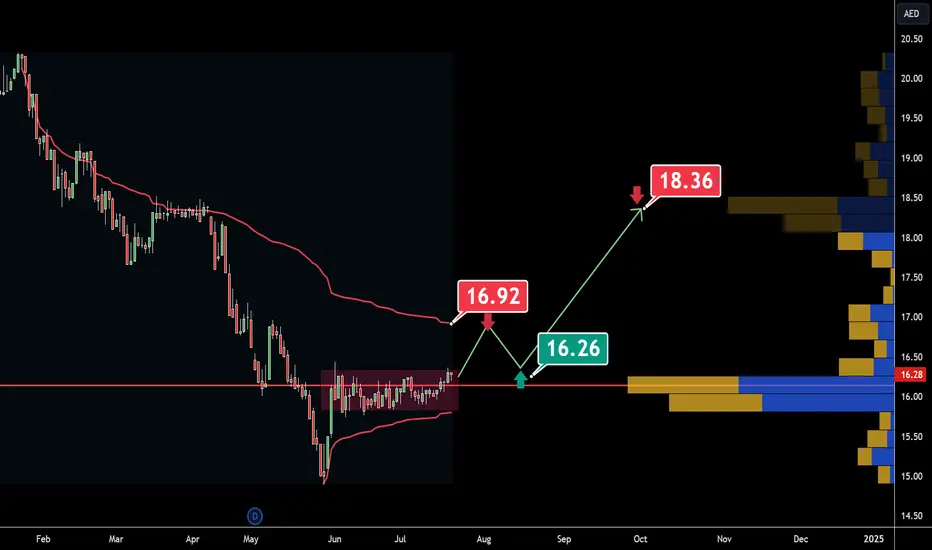
Eand We need a clear close above 16.30 for immediate target to high 16 then back to test the support and fly to 18 ..
ADX:EANDLong
by Kayuae
11
Update on Possible scenario for DFM There might be possibility that DFM reaches the area near the greens line so it can be suitable to take around the green line @1.27 and @1.25 and sell them if the price reaches 1.31 . The scenario fails once the price closes below the (stop loss) red line 1.24
DFM:DFMLong
by jalshaer
Updated
Possible scenario for Emsteel provided doesn't close below1.26There might be possibility that Emsteel reaches the area near the green lines so it can be suitable to take two quantities around the two green lines and sell them if the price reaches 1.36 with average profit for both quantities around 5% The scenario fails once the price closes below the (stop loss) red line 1.26
ADX:EMSTEELLong
by jalshaer
Updated
Possible scenario for DFM provided it doesn't close under 1.28There might be possibility that DFM reaches the area near the green line so it can be suitable to take around the green line @1.30 or lower and sell them if the price reaches 1.34 . The scenario fails once the price closes below the (stop loss) red line 1.28
DFM:DFMLong
by jalshaer
Updated
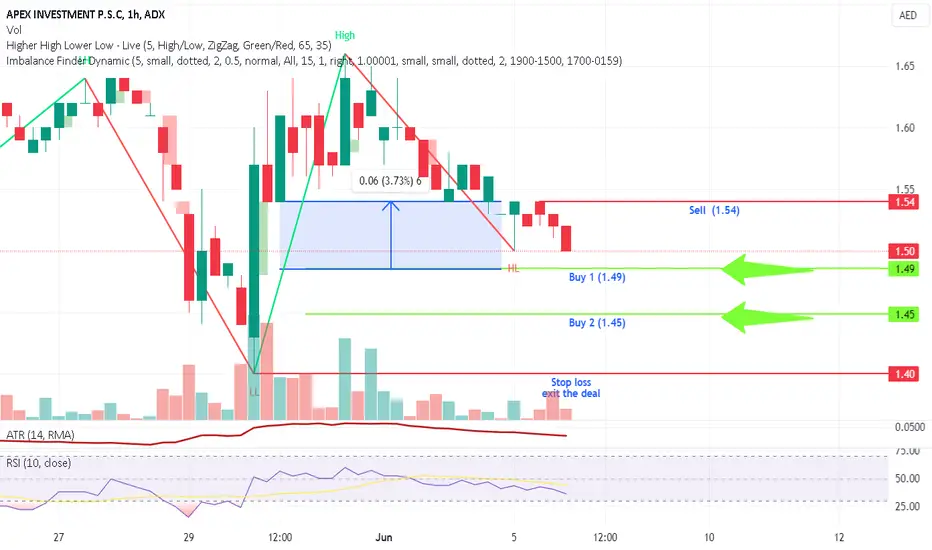
Possible scenario for Apex provided it doesn't close under 1.40 There might be possibility that Apex reaches the area near the green lines so it can be suitable to take two quantities around the two green lines and sell them if the price reaches 1.54 with average profit for both quantities around 4.5% The scenario fails once the price closes below the (stop loss) red line 1.40
ADX:APEXLong
by jalshaer
Updated
Possible Scenario for ESG on 60 mn framethere might be ossibility that ESG relaxed untill reaches the area near the green lines so it can be suitable to take two quantities around the two green lines and sell them if the price reaches 10.9 The scenario fails once the price closes below the (stop loss) red line 9.52
ADX:ESG
by jalshaer
Updated
DIC 1hr frame possible scenarioDIC 1hr frame possible scenario if it did not brake the 2.25 then there is a chance to continue to visit the previous top 2.40
DFM:DICLong
by jalshaer
Updated
Air Arabia 1 hr frame possible scenarioAir Arabia after this drop is it going to gain some profit let's see
DFM:AIRARABIALong
by jalshaer
Updated
11
Ajman 1hr frame is it going to hit the target or will failAjman 1hr if it closes above 1.87 then there is a chance to move toward 1.92
DFM:AJMANBANKLong
by jalshaer
Updated
11
EMIRAT ARABE AIRARABIA STILL DOWNPeriod: W1 Current trend: bearish Analysis: based on price trends, ITC, high/low volume indicators and also QQE forecast: bearish this share continues its fall to reach TP2 after a pullback on the institutional resistance at the round figure 2.3 with a reversed hammer the price will continue its fall until the next Order Block weekly . I think and suggest selling this stock...
DFM:AIRARABIAShort
by sissoko2fakoly
EMIRAT ARABE ADNOC GAS DOWNPeriod: D1 Current trend: bearish Analysis: based on price trends, ITC, high/low volume indicators and also QQE forecast: bearish after a retest break of the daily order block at the 2.9 round figure, the price will make a descent to the order block. there will be a reversal of the trend for some time and there is even a risk of breaking support. i think and suggest selling this stock...
ADX:ADNOCGASShort
by sissoko2fakoly
A Technical & Fundamental review of an emerging AI companyADX:PRESIGHT PRESIGHT is a data analytics company with seemingly a niche in sports analytics but the majority of its money comes from doing digital ID services for the government of Kazakhstan. They do use the name "Generative AI" in many of their releases but it is not clear yet how that's different from what used to be called "Algorithmic" just a couple of years ago. Either way, it is the trend for many countries in the region to use more and more of such intelligence services or "Data Analytics" as they call themselves. See below image of PRESIGHT fundamentals overview posted on their chart. So what explains the recent rise in stock price as much as 60% before PRESIGHT's earnings announcement? It was an expectation of revenue and income increases which drove the stock price up. The good news, is that this did happen. PRESIGH has announced their earnings for Q4 of 2023 on April 24th. They have indeed grown their yearly revenue for 2023 by 14% and increased their net income by 34% for the same year. The bad news is that their gross income is actually much less (-33%) and their pretax income is almost the same (+5%). Translation, the difference in net income is largely accounting. Meaning that their profit is still basically the same. Their Quarterly EPS YoY is not useful because they went public in 2023 their earnings per share are extremely low (12 fils per share compared to 231 AED when private). But their QoQ earnings are telling and they are down -39% for the quarter. So there is no secular growth story here. This company is growing in business YoY but the cost of new acquired revenue is much higher which is reflected in their pretax income being almost the same. A couple of flashy stories about the UFC business and Sports Cycling here and there but nothing major changed. The Trade: This company is just a trade for me. I would buy it at the shown TA level by (Cyan arrow) for a bounce back up. Once I own it, I will sell some at a 20% gain and hold the rest for the stock to hit the Magenta arrow. If however it hits the magenta arrow before it dips to the cyan arrow then I will just buy at the cyan arrow and then sell at 20% gain. As for the yellow arrow, that is where some major resistance lies. It's for that small chance that the stock explodes higher because the general public drinks the Kool-aid of AI stocks and might squeeze them higher. I would ride only 10% of my position to that level with a stop loss. Anyway this is what I am doing with my money. You do you.
ADX:PRESIGHTLong
by ConvictionTrades
Updated
Emaar - UAE - Long Set upForming a double bottom on 1H TF and also can see a bullish divergence. So have my entry / buy stop at 7.60 Entry 7.60 Stoploss 7.41 TP-1 7.76 TP-2 7.92 #Trading #Technical #Crypto #Stocks #commodities
DFM:EMAARLong
by ChartCurious
An upcoming setup in EMAAR for a 24% returnDFM:EMAAR I am looking to make a 24% return on EMAAR in the next 4-5 months. The thesis is based on seasonality aligning with technical analysis. If you look at the orange line in the chart above, which reflects the stock's seasonal performance, you will see that EMAAR typically rallies into it's August earnings report (Q2 financials). Q2 usually beats Q1 only about 30% of the time but I think this time will be one of those occasions. EMAAR saw a significant jump in it's Q1 earnings which I don't think will be a one time deal. More importantly, I believe this will be the expectation for the majority of investors, thus making it likely that EMAAR will rally into it's Q2 earnings. Additionally, analysts' estimates are still not high for Q2. They are 22% higher than EMAAR did YoY but 14% less than EMAAR already delivered last quarter (see financials posted on image below). I think EMAAR can beat those expectations. Remember this tends to be the seasonal performance of the stock anyway this time of year. I just think that there is more reason for this to happen this year. That said I am not going to just buy EMAAR at any price. While the stock is trading at a deep discount to it's DCF model 5 years out (see image above), it is trading at the high band of it's profit margin. With a PM of 39% it is already near its all time high PM of 41%. I track PM over time because most stocks in the UAE are Cyclical. Once they make a lot of money they usually cycle lower to hit the lower band of their historical PM. This is to avoid buying a company at the top of it's cycle (where it's financials would undoubtedly look great but would be unsustainable). According to my technical analysis shown on the black & white chart above there will be minor support for the stock at 7.14 & 7.01 AED. Their will also be major support at 6.88 & 6.78 AED. I plan on buying at around 7 dirhams and then doubling down at 6.78 for a two tier entry. From there I expect at least a 24% rally into September for EMAAR. Anyway, that's what I am doing with my money. You do you. Good luck.
DFM:EMAARLong
by ConvictionTrades
Emaar is now in a strong uptrendhello dear investors I think inchallah, Emaar will continue it uptrend until 1st target=12.50 2d target=19. Always think technically with ease: it will respect the corridor if breakout accure then you will unusually see highest levels. Just keep buyning and not sell untill breakdown this corridor. Remember that i am not having a cristal ball predicting markets movement but I try to be more rationnal . Good luck NB: if you see that i said something usefull ecncourage me in order to post more and more
DFM:EMAARLong
by HASSOUNI-trading
33
ADNOCDIST is getting ready to breakoutADX:ADNOCDIST is approaching a breakout level at 3.74 AED which is neckline of the a double bottom and above the 200 MA. Either long the break out with stop daily close below the 50 MA or enter at 3.65~3.66 AED if the stock rejects from 200 MA with a tight stop daily close below 50 MA. Not financial advice, my view only
ADX:ADNOCDISTLong
by Chartoholic
Updated
Fertiglobe is ready for some price recoveryADX:FERTIGLB price action shows it is ready for some price recovery. Long the breakout at 2.79 AED to target 3.05 AED. I would place the stop daily close below 10 MA. Not financial advice, only my view
ADX:FERTIGLBLong
by Chartoholic
Updated
22
Will seasonal performance save DANA from a disappointing QuarterADX:DANA DANA Gas has its Q1 earnings results scheduled for May 14th. Looking back on how DANA has performed, we see that it has missed 9 of its last 9 quarterly earnings. This is clearly not a good trend. Furthermore we see that analyst estimates for the upcoming quarter are only 2% less than what they expected for the same quarter last year (See fundamentals on image below for full view). In reality the YoY results expected by analysts should have been lowered even further to account for the poor performance trend that DANA has been on. Worst, the estimates for next quarter are 45% higher than the estimates for last quarter. So Analysts are expecting a 45% increase in earnings QoQ. That's a lot of pressure on DANA. Typically, going back since inception, Q1 earnings for DANA have been higher than Q4 61% of the time (see business cycle indicator in above figure). But still, a 45% QoQ estimate will be hard for DANA to beat or even meet, especially since it has missed for more than 2 years! This is not necessarily all bad news though. In the black & white chart above, I show a support level below (black arrow at 62 fils) which represents great support for DANA. The gray arrow above it at 66 fils would be the minor support. The ideal scenario for me would be for DANA to miss and then get punished with a price dip. Here I would buy DANA on the dip. One strategy is to buy at gray arrow then average down at black arrow for a two-tier entry or just buy all at the black arrow (62 fils). The reason I expect DANA to get punished (if they miss their earnings) is because this is typically DANA's most successful quarter. So if they miss it's bad for the year! Also because they are already fairly valued @ 70 fils according to the DCF intrinsic value model for 5 years out (see chart image above). There are better deals in the ADX. As for the reason I expect DANA to perform well after the dip, it's due to the seasonal performance of its stock. (see seasonal performance line superimposed on black & white chart). Here you can see that DANA is actually due for a price move upwards since February and even further up into July, but hasn't gone up much so far and instead has been consolidating sideways for 4 months. My theory here is: once the upcoming quarter is out of the way and DANA does disappoint, the stock will sink lower then start to trend upwards to track its usual seasonal stock performance. The reason this would happen is due to promises that management make after a disappointing quarter. Remember this is usually their most successful quarter. So management has to do something to save the year. So I'll be buying DANA at 66 fils & 62 fils and will be selling it at the resistance levels marked by the arrows (78 fils & 83 fils). This is what I am doing with my money. You do you.
ADX:DANALong
by ConvictionTrades
Updated
11
What Emaar shown in Short-Term In the short term, Emaar's stock has shown a consistent bullish trend throughout the current year. 1-There's a likelihood that Emaar's shares will continue to rise over the next month, but there's also a chance of a significant drop to 8.21 in the near future. 2-However, if the stock doesn't drop to 8.21 , it's probable that it will continue to rise until the upward trend loses momentum. 3- If the stock price reaches and exceeds 8.10 We expect a downturn and a temporary halt in the bullish trend, indicating the beginning of a new phase for the bearish trend. However, this scenario appears relatively unlikely considering the sustained rise over the past four years, suggesting the upward momentum could persist for another two years or more. This analysis is based solely on the bullish trend observed this year and generally over the past four years. DFM:EMAAR
DFM:EMAARLong
by TheRightPerson
112233445566778899101011111212131314141515161617171818191920202121222223232424252526262727282829293030313132323333343435353636373738383939404041414242
…999999

Made by humans

Select market data provided by ICE Data Services. Select reference data provided by FactSet. Copyright © 2026 FactSet Research Systems Inc.Copyright © 2026, American Bankers Association. CUSIP Database provided by FactSet Research Systems Inc. All rights reserved. SEC filings and other documents provided by Quartr.© 2026 TradingView, Inc.

More than a product
  • Supercharts
Screeners
  • Stocks
  • ETFs
  • Bonds
  • Crypto coins
  • CEX pairs
  • DEX pairs
  • Pine
Heatmaps
  • Stocks
  • ETFs
  • Crypto coins
Calendars
  • Economic
  • Earnings
  • Dividends
  • IPOs
More products
  • News Flow
  • Portfolios
  • Fundamental Graphs
  • Yield Curves
  • Options
  • Macro Maps
  • Pine Script®
Apps
  • Mobile
  • Desktop
Community
  • Social network
  • Wall of Love
  • Refer a friend
  • House Rules
  • Moderators
Ideas
  • Trading
  • Education
  • Editors' picks
Pine Script
  • Indicators & strategies
  • Wizards
  • Freelancers
  • Paid Spaces
Tools & subscriptions
  • Features
  • Pricing
  • Market data
  • Gift plans
Trading
  • Overview
  • Brokers
  • Brokers comparison
  • The Leap
Special offers
  • CME Group futures
  • Eurex futures
  • US stocks bundle
About company
  • Who we are
  • Space mission
  • Blog
  • Help Center
  • Careers
  • Media kit
Merch
  • TradingView store
  • Tarot cards for traders
  • The C63 TradeTime
Policies & security
  • Terms of Use
  • Disclaimer
  • Privacy Policy
  • Cookies Policy
  • Accessibility Statement
  • Security tips
  • Bug Bounty program
  • Status page
Business solutions
  • Widgets
  • Charting libraries
  • Lightweight Charts™
  • Advanced Charts
  • Trading Platform
Growth opportunities
  • Advertising
  • Brokerage integration
  • Partner program
  • Education program
Community
  • Social network
  • Wall of Love
  • Refer a friend
  • House Rules
  • Moderators
Ideas
  • Trading
  • Education
  • Editors' picks
Pine Script
  • Indicators & strategies
  • Wizards
  • Freelancers
  • Paid Spaces
Business solutions
  • Widgets
  • Charting libraries
  • Lightweight Charts™
  • Advanced Charts
  • Trading Platform
Growth opportunities
  • Advertising
  • Brokerage integration
  • Partner program
  • Education program
Look FirstLook First