Its a PAINTrend
Its been just going side was for ages now, once it breaks 3.46 and closes above with good volumes thats when we can have a trend confirmation. With last weeks closing its looking weak.
Breakout
Once we see a confirmed breakout that's when we can plan out buys for now its in a no trading zone it can retest support 1 and support 2 area. Also the have announced bonds that got listed on ADX this stock is looking good.
Hit like & follow guys ;)
Looking so YUMMYTrend
Fertiglobe is looking so nice at current levels I feeling like jumping in right away. Its been trending up however its about to break 200ema yet. For now its above 20,50,100 most likey we will see it breaking the resistance and close above 200ema very soon to establish a uptrend.
Plan
I think any bounce from the support area should be considered buying opportunity. However we will see the volumes and the candles forming into the support area.
Hit like & follow guys ;)
Breakout Soon ->Trend
Its in a strong uptrend for now, and its at a very crucial zone to break ascending triangle pattern. Get ready for some gains here.
Chart Pattern
From 15th August 2023 we are seeing its been trading in a tight range, and now its ready to explode most likely to the upside from here. I am targeting 3.10 zone in mid to short term.
Hit like & follow guys ;)
Very Tricky Be CarefuulTrend
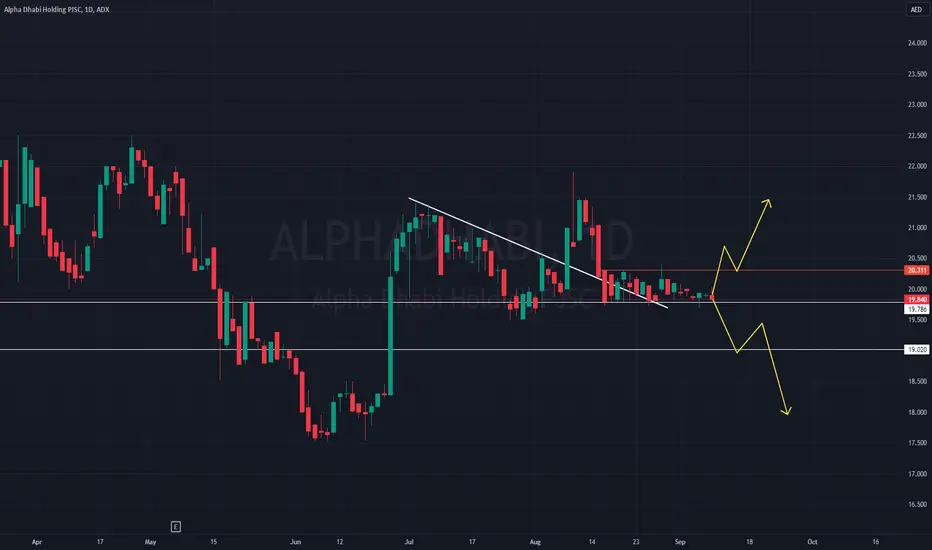
Overall the trend is still positive but now its been consolidating at the top for so many days I hope its not a distribution phase of this trend. We are seeing some weakness from the bulls but still there is no confirmation yet.
Chart Patterns
Well we can see a consolidation happening within a tight range and at the same time we can see price is testing higher resistance levels that is also indicating a triangle chart patter. My worry is if it breaks to the down side it will make a very big impact, panic selling will create more selling pressure and price can go lower from here. Incase if it breaks up then we are all smiling obviously.
For now its looking weaker on daily and weekly chart I think it will break to the downside and create a mess...huh!
Hit like & follow guys ;)
QShort
ReadyyaahhTrend
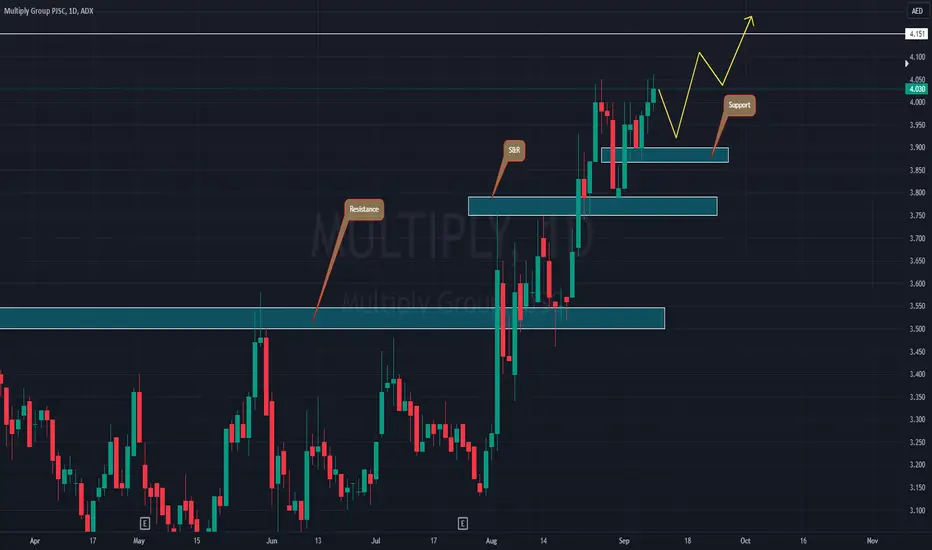
Multiply is on a strong uptrend and I think it will take a small break before breaking the next hurdle. Either it can come down to retest the immediate support or it will continue to go up from current level. Weekly closing is very bullish and i am expecting a continuation of this trend to the upside.
Targets
I think next resistance area is around 4.10-4.15 zone lets be prepared to book some profits in that zone and wait for a price action to plan new entries.
Hit like & follow guys ;)
Buying Opportunity?Trend
No doubt Emaar Properties is on a uptrend since long time, for now after hitting the resistance its correcting itself and we are seeing some selling pressure with low volumes on daily chart. But i think soon buyers will jump in to grab this stock at support zone.
Targets
In mid to short term i am looking at 8dhs per share price for emaar properties, its very sound fundamentally and technically too.
Real Estate
Property market is booming in Dubai and this will also reflect on the emaar chart. Also Emaar properties may give out higher dividends.
Hit like & follow guys ;)
Which Scenario ??Chart Pattern
Is it forming inverted cup and handle pattern (scary) if yes then buckle up! we ready to go south till about 0.550 zone. This scenario will change the trend and more down side can also be seen this will be scenario B
Pattern Failure
If this is a chart pattern failure then be ready for some big moves very soon and I think it will hit 0.8xx area very soon. But for this to happen deyaar has to close the price above 0.725 before breaking 0.660 so its a wait and watch game.
Early entry
However we can plan for a early bird entry as price is at support zone and target 0.760 area which will give us good RRR
Hit like & follow guys ;)
Will it survive here?Trend
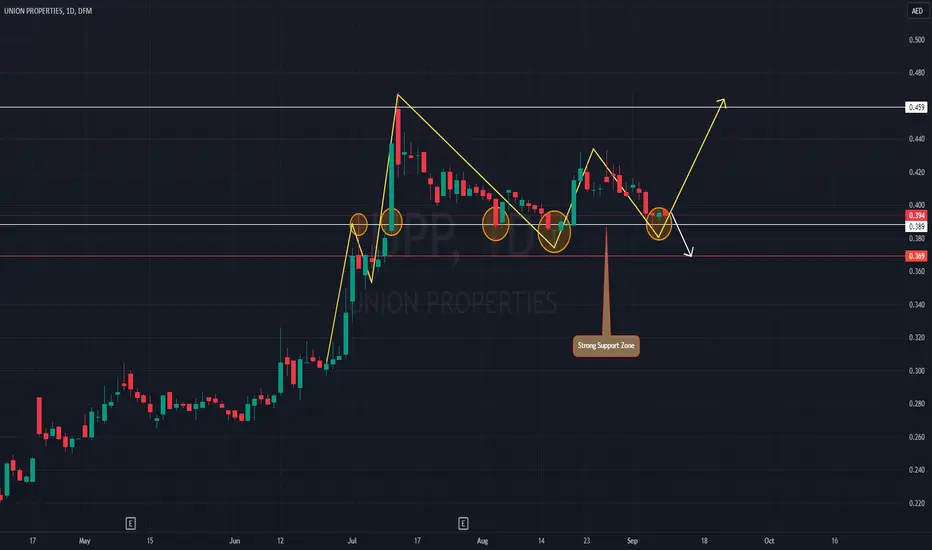
For now upp is still on a up trend but we are seeing its under selling pressure 12th July 2023. Support area is at 0.390 area and its been holding good so far. Its been retesting the same area again and again hopefully it will hold it and push the price up.
Negative Scenario
If the current level is not holding then most likely we will see it coming down till about 0.370 and then 0.350.
Need Bull Power
Bulls need to come out in open and flex their muscles to defend the current zone. I will only take it bullish once it breaks 0.410 till then its in a no trading zone for me.
Hit like & follow guys ;)
SHUAA0.456 was the end of the first wave
After that the stock descended in a second main wave as a sharp and deep zigzag ( now n C wave) whose target is around the 0.35 - 0.36 area after whitch the stock will ascend in the main third wave
(we will determine its target after ensuring of the end of second wave)
This analysis fails if only the 0.34 bottom is broken
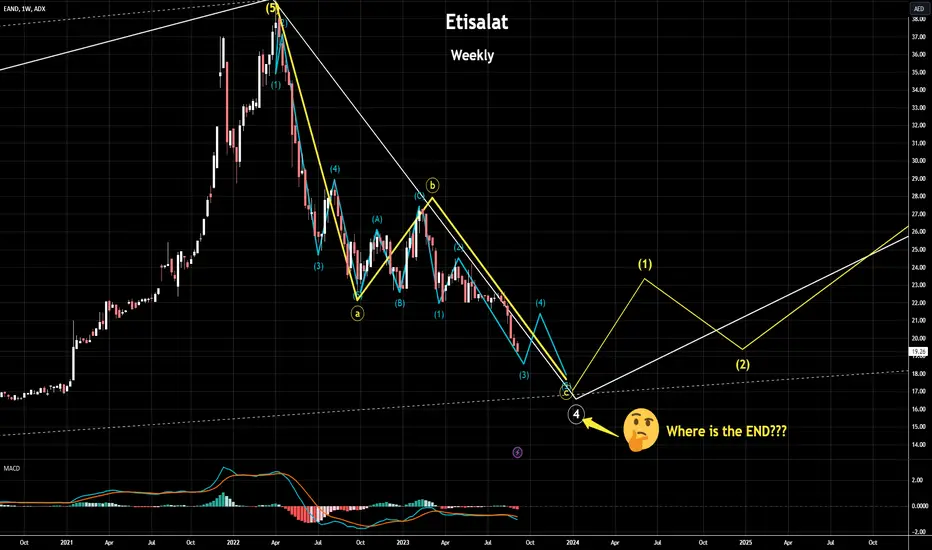
Etisalat - Main fourth waveThe fourth wave is a sharp and deep zigzag corrective pattern..
The stock moves in its last wave C and exactly we can say in the third of C.
after finishing this wave we will go up in a temporrary up wave 4
then go down in a final drop wave 5 , which is the end of C of the zigzag corrective pattern and the end of the fourth major.
EtisalatEtisalat since listing
Monthly chart
Its current decline is a major fourth wave that overlapped with the first, which turned its overall rising cycle into a complex diagonal wave, the target of which is the fifth, which will have multiple possibilities.
Important question:
What is the analysis of the fourth wave and where it will be end? 👇
Q HoldingQ Holding
In the long term
Entry conditions:
First - Do not break point 2.15
Secondly - crossing the 4.11-4.39 area with a weekly close
The first target area is 5.77-6.06
Second target 8.00
Stop loss 2.10
Risk Management to be obeyed
Q
QUICK ANALYSIS ON ADCBDear Emirati Traders, you can see on the chart thet the price pulled back multiple times on the resistance level and couldn't break through it, there's a high probability that the market will head down towards the 7.70 level, to make sure of that you must wait for a confirmation of the pullback then you can sell.
For further questions, don't hesitate to ask!
SELL ADAVIATIONDear Emirati Traders, it's been a while since I last posted about UAE Markets.
On ADAVIATION, you can see that the price is heading down after pullingback twice on the sell zone and went around the resistance level we have at 7.88 before taking his way down to the level 0.5 of the pitchfork, as you can see on the chart, today the stock closed below the 0.5 level, to sell you must wait for a confirmation to get a good selling position.
The comment section is all your for further questions!
EAND, timing an investment for 100% ROI in 2 years (not a trade)ADX:EAND
In this post, I am featuring a multi-year investment opportunity. An opportunity to make 100% return over 2 years. This idea is for my investment account. It is for growing money steadily over time for retirement. If you are looking for a trade, then this is probably too slow for you.
Etisalat is a company whose sales are 10% of the UAE’s GDP. Normally companies of that size would be very cyclical, but Etisalat’s business (not stock) is only semi cyclical.
Cyclical businesses suffer when the economy takes a hit, it affects their bottom line. While the economy does affect Etisalat for sure, its impact on the business is diluted by the fact that Etisalat’s net profit margins are constant at around 19% no matter what. How could that be? You see Etisalat and Du are government approved duopolies. They have price control. This is why, they are not purely cyclical businesses. This means you can only hit their stock so hard before they ignore you and the economy.
My chart above is a monthly chart. It shows the entire life of Etisalat as an exchange traded stock. It has suffered thru many price retracements throughout its life. If we look closely, we will see some interesting trends.
In the early 2000s EAND took a 62% hit which corresponded with a peak-to-trough retracement to the 81% line. From there, and within 2 years, the stock moved up 96%.
The stock dropped again and formed a bottom in December 2008 after declining 63% (again) from its previous high. Then from there, and within two years, the stock moved up 70%.
In March 2020, EAND dropped to its 81% peak-to-trough retracement line again! but this time, the drop was only 45% in price from its peak. Then from there, and again within 2 years, Etisalat moved up a whopping 254%.
And now Etisalat is doing it again. They are dropping precipitously in price from their all time high. But they are not quite there yet. My price to buy EAND at 16.34 AED, is at the 81% peak-to-trough retracement level, which also corresponds to a 58% decline for EAND from its all-time high (see circled double arrows).
But if you recall, I showed above that Etisalat respects either the 81% peak-to-trough retracement level or the 62% drop from peak (which sometimes is the same level)? That is why I will average down at 14.84 AED if I get the chance (see green arrow on chart). It probably won’t happen, but this will make the investment more durable. This is called a two-tier entry.
Finally note, that around my highlighted entry price, you will find the most epic moving average in all Technical Analysis. The 200 Monthly MA. This is going to be an incredible level of support! Most companies don’t have enough data to give you the opportunity to buy them at the 200 monthly MA. But Etisalat does. Not to mention that it is falling from a massive divergence (distance) to the 200 MA.
Remember Etisalat will likely need a few more months to get to my price. Currently at 20 dhs, EAND is 20% away from my buy in level. But if you buy this stock at the right time, you have the chance to make a large return in a few years or you can even own a great company with a secured business into your retirement for an even larger return than holding for two years.
Note, at the above entry price, dividend yield would be 10% per year. Not bad if you ask me.
This is what I am doing with my money. You do you.
Good luck.
Need Bull PowerWe saw some crazy moves in qholding , for now its taking a pause right near the strong resistance area. Last closing is not very promising we can see some sellers coming out of the bush in some volumes. At this point of time we need angry bulls to jump in are defend the territory.
Price is above 200 EMA giving us good indication its in a uptrend. But now the question is..is it time for correction?
Strong support at 3.50 and it have testing successfully with strong buying pressure, if it does not now 3.70 are then there are good chances it may revisit 3.50 and come back to break 3.77-3.80 zone.
News Effect
With the positive news hitting the market about qholding the stock price rocketed and now we expect it to sustain the gains.
If we look at the lower time frame 15 mins chart we can see side ways price action this is a good sign of relief that bulls are still active else bears would have taken control already as the price is just at the perfect place to short.
QLong
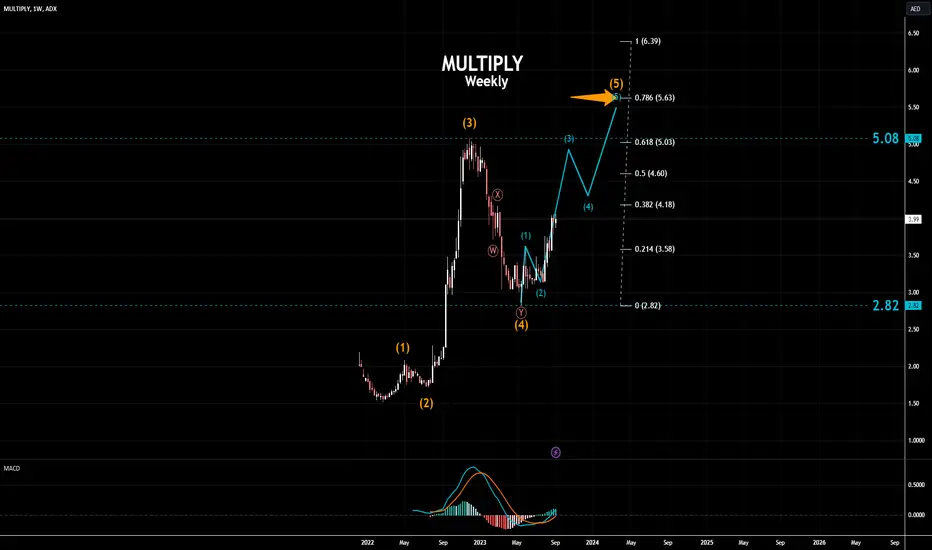
This is YummyFor now multiply is looking very positive , after the strong move to the upside its correcting and i think its taking a breather before it makes another violent move tot he upside. If we look at the weekly chart it have broken the range already and now it seems like its just taking a pause above the support zone. Last three candles are bullish we can see buying pressure coming in clearly indicating bull are defending zone.
Once we see a solid breakou t of 3.65 with big volumes I think we will see 3.80-4.00 very soon. Multiply is very strong fundamentally with rich cash flows and its also investing in other profitable companies which will bring in moolah.
Multiply is once of the top traded stock in Abu Dhabi Securities Exchange and I think very soon this stock will be above 4.00