Shuaa Capital , Insight into the company's shares!We closely monitor the stock's movements that suggest close moves . It is expected to be positive by 51%, and the confirmation of the negative trend change is Exceeding the levels of 40 and stability above it.
Target : from 48 to 55 in the medium term.
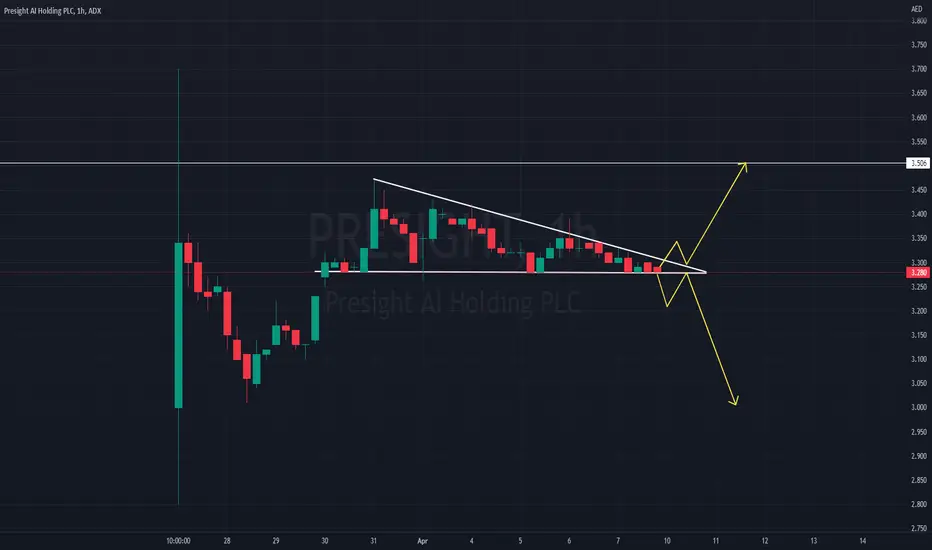
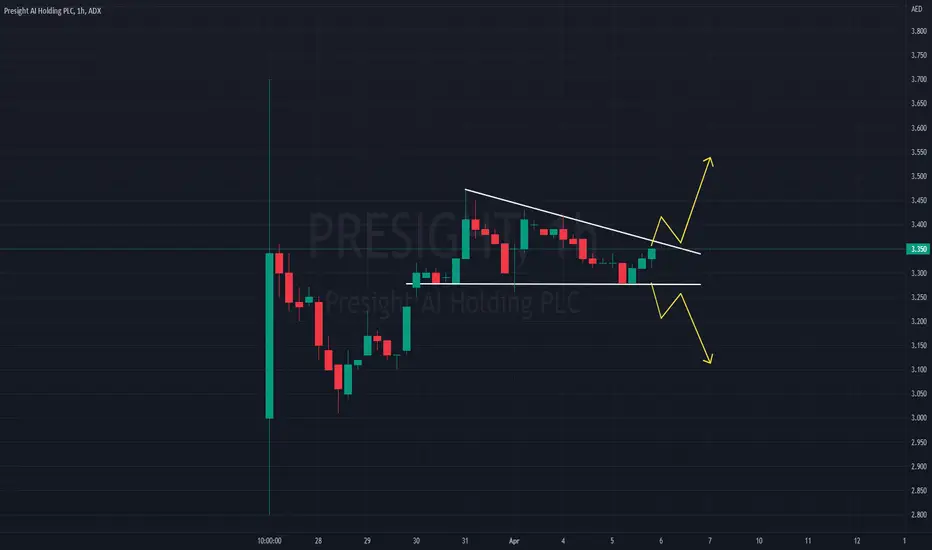
Billateral Pattern Identifiedits forming a pattern of
Assending triangle
also
Rising Wedge
Which indicates the movement can happen both ways
If it drops below 5.90 then it will be a confirmation of a bearish reversal
If it goes above 6.50 then it will be continuation of the bullish move
Make entries after 6.50 to ride the bull trend
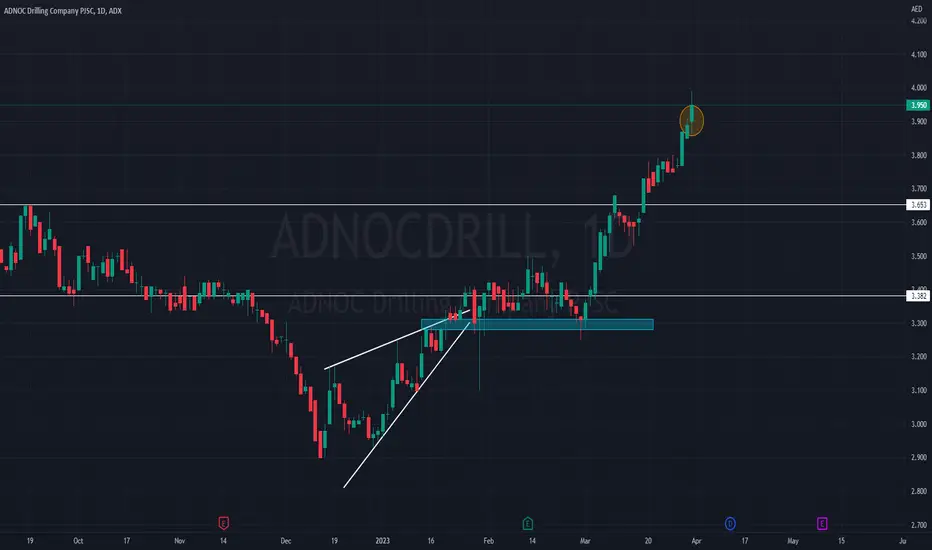
What Next?After the big announcement of dividends we saw a breakout as i had mentioned earlier but looks like it was a fake breakout!! it could not sustain the gains and todays closing is negative. Next support area is around 3.75 lets see how it performs coming week. On the other side I think it will soon give us buying opportunity so lets "stalk" this stock.
Hit like & follow guys ;)
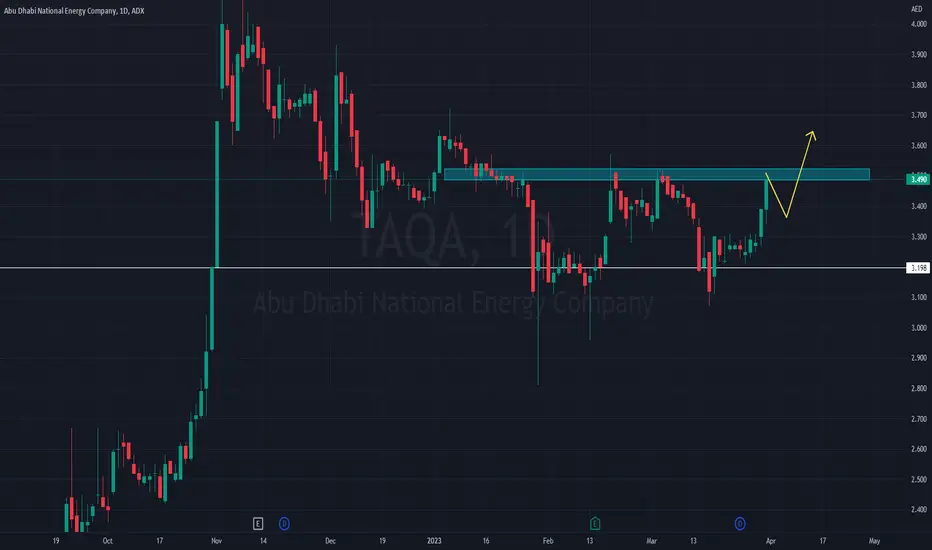
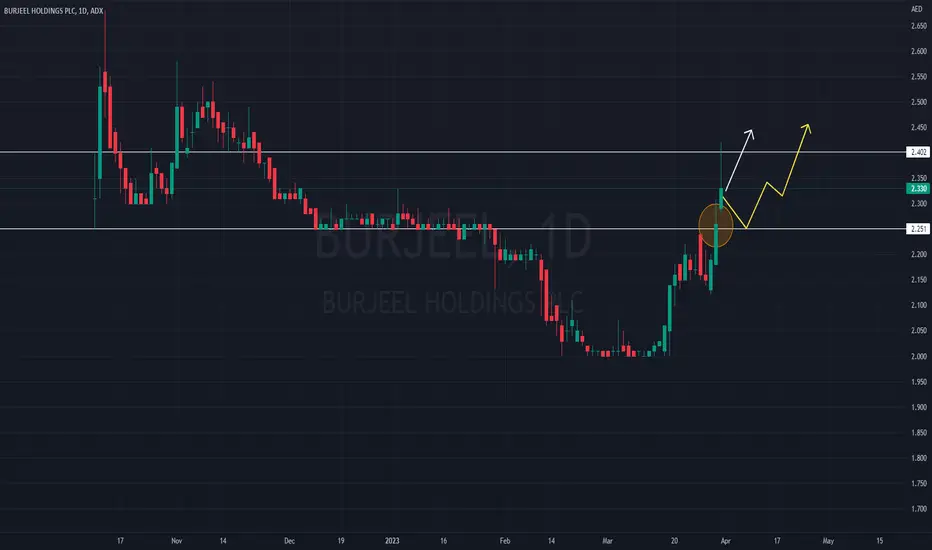
Retest?Its been going higher non stop for so many days and now its right into the resistance zone, i think it will be better if it take a breather and then resume it journey so that it can sustain the gains. Hopefully coming week we will see some good moves in taqa
Hit like & follow guys ;)
TLong
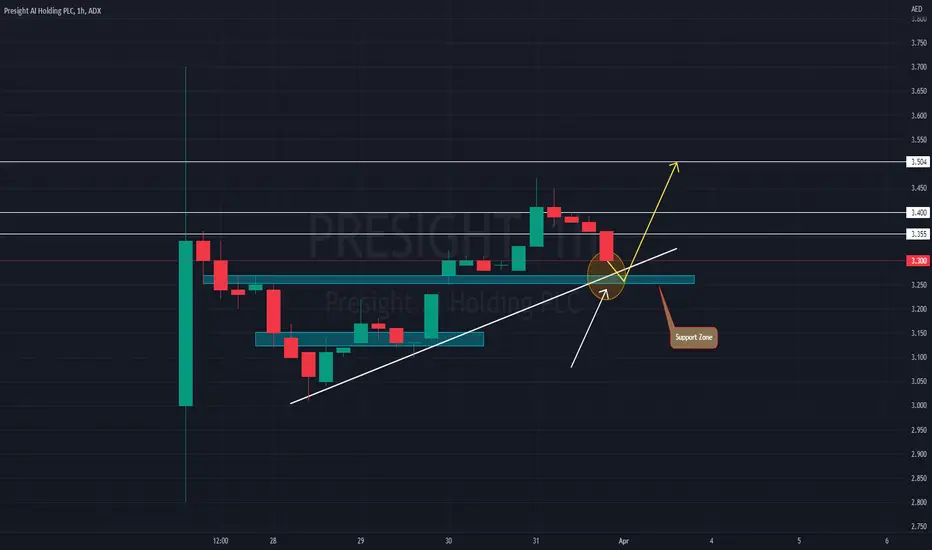
Watchout!!I was but disappointed with the closing today, but being a weekend this is what usually happens investors dont like to hold their positions over the weekend as anything can happen and scenario can change. Over all still positive if it opens with a gap up there are good chances it will go higher. If if opens with a gap down or flat opening it can go down to retest the support zone.
Hit like & follow guys ;)
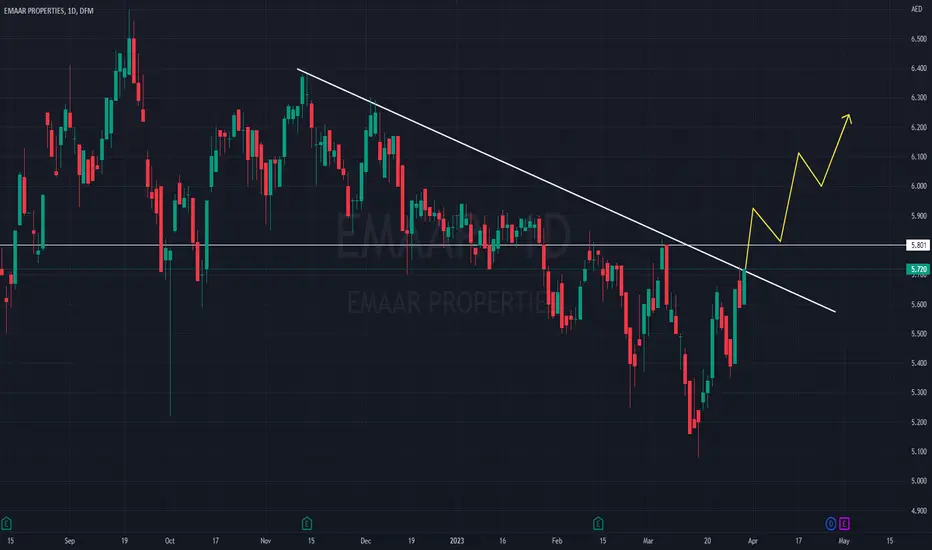
Make or BreakThere are good chances of reversal from this level, Emaar is been on a down trend for a while and tomorrow we can expect to see some bull power to reverse this trend. But again Friday is usually slow as its weekend so be careful only buy in small quantities so you can keep the position open over the weekend.
Hit like & follow guys ;)
Solid but ScaryThis stock is strong technically but fundamentally its very weak its a Red flagged company on DFM. For day trading, quick entry and exit is recommended.
Hit like & follow guys ;)
GLong
Continuation of fallIts been under pressure since it hit the peak of 6.00 and since then its been falling down. There is a hope of bottom formation at current levels but for now i think it will go down further to retest the support level and make a reversal from there. Till the time its below the downward trendline there is no hope of it turning into bullish!!
Hit like & follow guys ;)
SALIK: Current Market Status and Future ProspectsThe current share price of SALIK stands at 2.90, reflecting the overall market sentiment towards the company. With a market value of 5,329,289.81, SALIK has managed to garner significant interest from investors, as evident from the trading volume of 1,845,923 shares. This substantial volume indicates that the company's shares are actively being traded, showcasing a high degree of liquidity and an optimistic outlook from the market participants.
Key Trading Metrics for SALIK
To further analyze
ESHRAQ stock may achieve a return of 27% to 100% on these pricesthe reasons
Standing at an important support
Positive technical patterns formed
The last candlestick is a hammer candle with the possibility of a morning star pattern forming
Positive divergence on the MACD indicator
Buy with a stop loss of 41 levels
Target: 25% of these prices
to 100% in the medium term