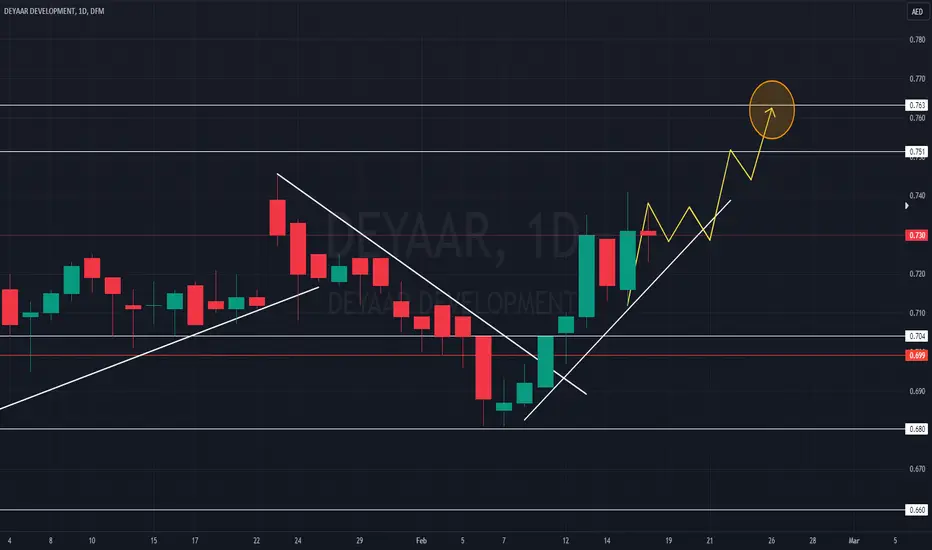
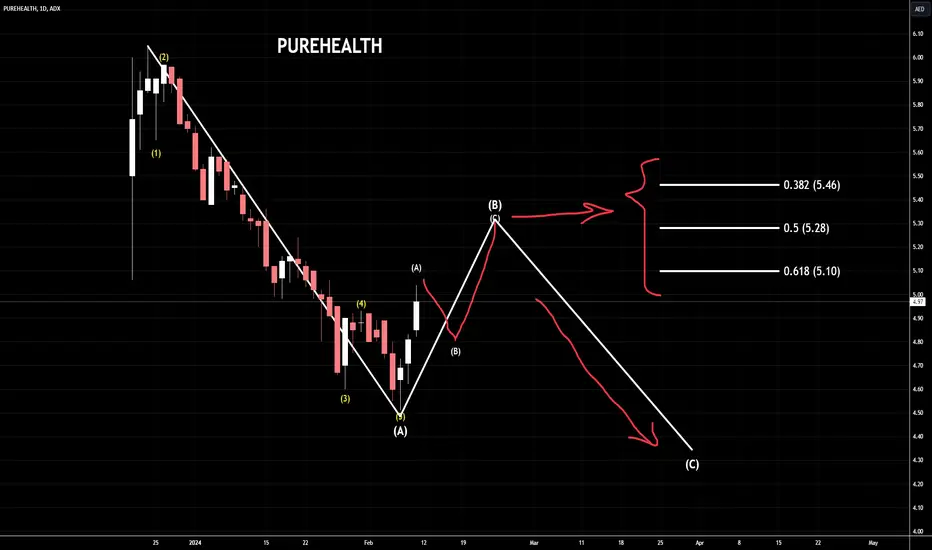
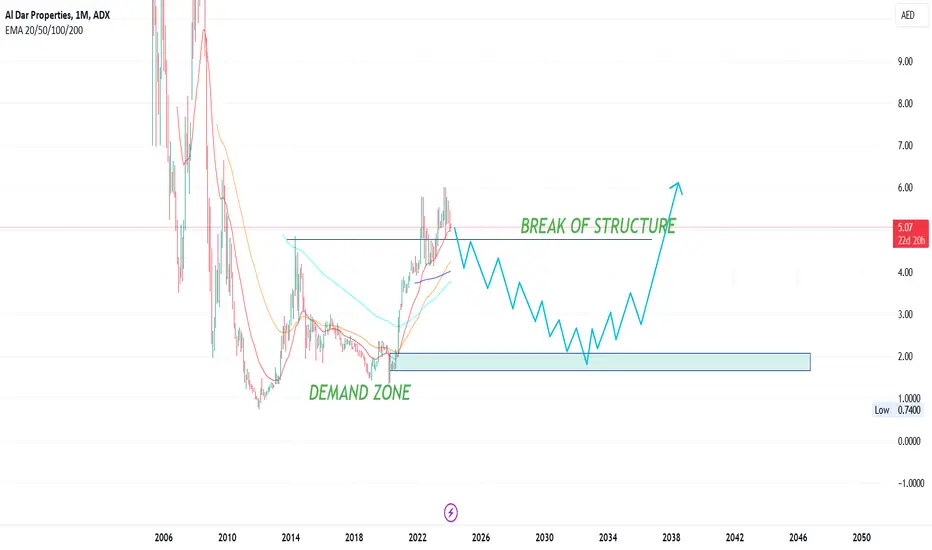
Deyaar BoomDeyaar is getting stronger fundamentally and technically as well. Thanks to the real estate boom in the DUBAI. New launches and deliveries is make Deyaar more profitable and its increasing its portfolio. Overall the trend in UP its been correcting itself on the way up so its healthy. Next strong area of resistance is at 0.763-0.765 zone
This stock should be above 1.00 early it was struggling but it has turned around now and its now trading with high volumes on daily basis. Still this is cheaper
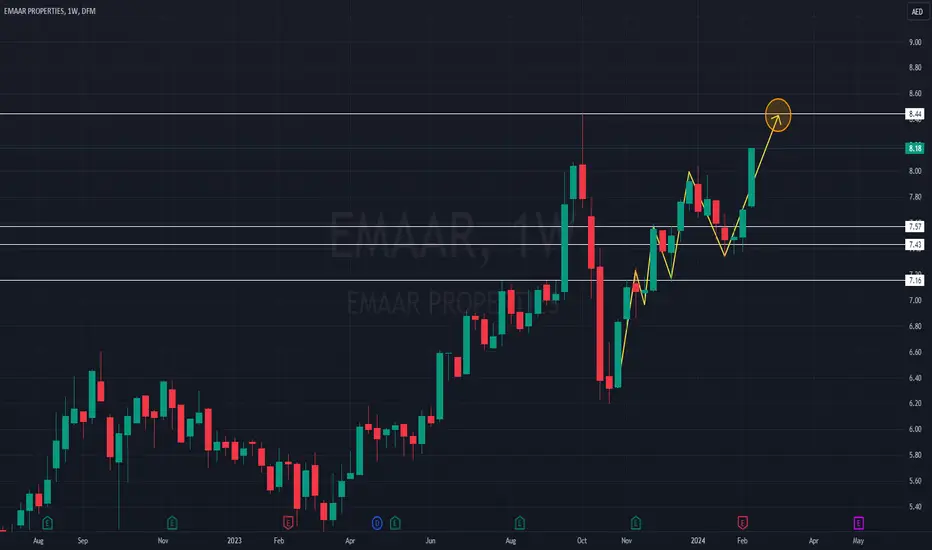
Powerful PerformaceEmaar properties showed good strength after releasing its financial results. Investors are happy with the quarterly results and we can see the smiles on the chart. Emaar is in a strong uptrend no doubt, it broke the resistance of 7.57 it has hit our targets and now its heading for 8.45
Real estate is booming in Dubai and Emaar is the biggest developer in the region. With new projects coming up and launches fundamentally its getting stronger and stronger. I think this time it i will cross 10.00
Bulls are here to STAYAmericana performed very well after they released the news about distributing dividends. Investors got excited in Wednesday's session and bought it in big volumes. Best part is in Fridays session when volumes are usually low and people book profits we didn't see any deeps correction it just touched 3.22 and again buying pressure came in.
For now Americana is still in a strong downtrend we cannot confirm a trend reversal just with one green candle spike. For now immediate resistance is at 3.35-
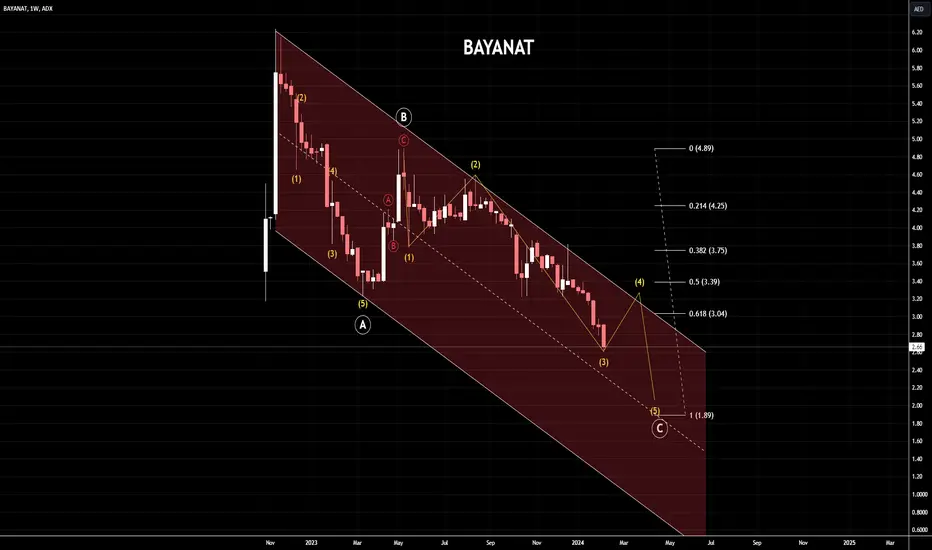
Bayanat
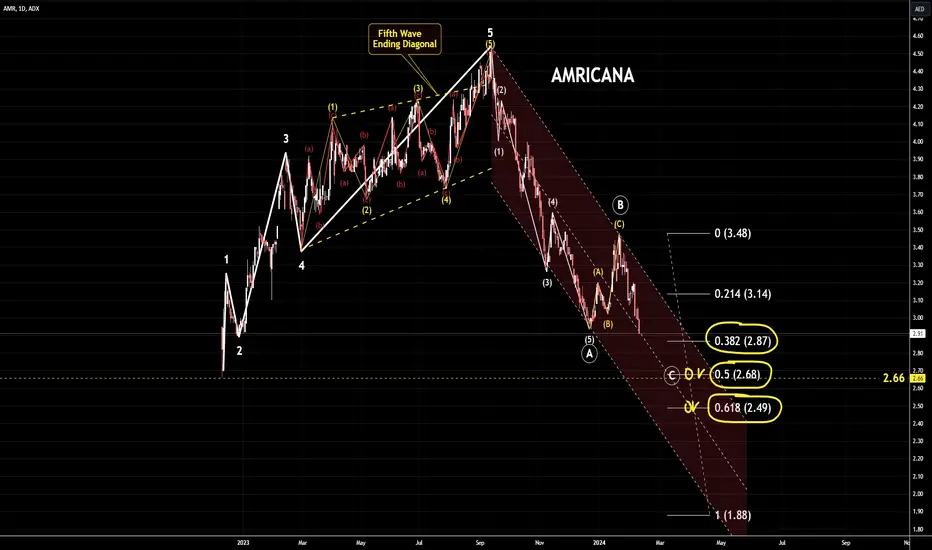
Possible wave scenario
The strategic target for the Great C wave is 1.88-1.89
We are currently in the third subwave of the third major of C
If the bottom of 2.60 is satisfied, we will have a rise in the fourth branch to areas 3.07-3.35 (numbered in yellow), after which we will fall in the fifth branch. Only then will the third main wave of C end, then we will rise in the fourth major, then we will fall in the last towards the target.
B
Will Emirates NBD Bank rebound to 21.7 ?Daily chart, the stock is trading in a rising expanding wedge, and may test the minor support S1 line, then rebound to R1 line.
Above R1 line, the target will be 21.7
Below S1 line, target is 15.4 - and can be brakes by the support line S.
Stop loss below support line S.
Bullish continuing trend Based on the latest data from TradingView, Gulf Pharmaceutical Industries (JULPHAR) is currently trading at 1.33 AED. The stock has shown significant movement, with a 72.06% increase in the last month and a 72.50% increase year-to-date. Recently, JULPHAR experienced a strong bullish trend, breaking above its 200-day Exponential Moving Average (EMA) and surpassing the resistance level of 1.17 AED with robust bullish candles. This pattern indicates a continuing bullish trend.
Considering these fa
JULPHAR | Bullish trend with anticipation of retracementObservation Summary:
Strong bullish Bias. On Jan 15, 2024, this stock got flagged as a volume leader. The price also broke above 200 EMA. Within 2 days, price broke the resistance of 1.17, with strong bullish candles. As per Hieken candles the trend is bullish continuation. Price is heading towards next resistance at 1.41 and 1.49. Price is also respecting the bullish trendline.
Anticipation:
~ Price has made a sudden increase but it is due for correction or retracement. It is aticipated
ARAM Bullish trend he 4-hour technical analysis for Aram Group on the Abu Dhabi Securities Exchange (ADX) from TradingView provides the following insights:
Oscillators: The summary of oscillators is largely neutral, with a mix of neutral, buy, and strong buy signals. Key oscillators like the Relative Strength Index (RSI) and Stochastic %K show neutral readings, suggesting no strong momentum in either direction.
Moving Averages: The moving averages are predominantly indicating a 'Buy' signal. This includes variou
Ghitha is trading sideways, then targets 63 after crossing upDaily chart, Ghitha Holding (ADX, UAE) stock is trading between the resistance and support (almost a rectangle channel).
It is a good trading opportunity BUY at support, SELL at resistance, until crossing up the resistance (around 49.0), then the target will be 63.0 extending to 70.0
Technical indicators: MACD is positive. RSI indicates some minor correction or sideways movement.