Long
Long
 Long
Long
ESG ADX Long Setup🏢 Company Overview
Emirates Stallions Group is a major diversified holding company based in Abu Dhabi, UAE, and is part of the International Holding Company (IHC)
🔧 Core Business
Manpower & Accommodation Solutions:
Provides workforce management and labor supply (both skilled and unskilled)
Develops and manages staff/workers accommodation via subsidiaries like Sawaeed Holding, Century Village, and Tri Star
Real Estate Development & Construction:
Offers a full suite of services: feasibility, design, construction, project management, and post-construction operations
Includes specialized hospitality and engineering projects (e.g., ESG Hospitality, Royal Architect, Abu Dhabi Land General Contracting)
Retail, Interior Decoration & Manufacturing:
Owns and operates furniture and interior retail brands such as Decovision, Vision Furniture, AFKAR (OC Home, 2XL Home)
Handles manufacturing of wooden doors, cabinets, paneling, and decorative wooden elements
Landscaping & Agriculture:
Through Gulf Dunes Landscaping and ESG Agro, delivers landscape design, installation, and agriculture solutions with an eco-friendly focus
Investments & Consultancy:
Provides technical consulting, brokerage services, and holds investments across various sectors and global markets
📊 Recent Financial Highlights (2024 Data)
According to Reuters/LSEG, ESG reported:
📈 Revenue: AED 1.27 B
💰 Gross Profit: AED 436 M
🧾 Net Income: AED 225 M
🌍 Business spans over 20+ countries, with more than 35 subsidiaries across 4–6 industries
The Wall Street Journal
The company is highly diversified across workforce services, real estate, retail, agronomy, and investments
Regional to global reach, especially strong within the Gulf Cooperation Council (GCC) and expanding internationally
Integrated model enables turnkey solutions spanning design, construction, workforce logistics, and operational management.
_______________________________________________________________________________
📉 Daily Trend Line Break – Technical Breakdown
🟢 The Setup
A descending trend line from the all-time high near 22.40 acted as a clear resistance cap through late June and early July. Which came after the May 2025 180% rally
This line connected multiple lower highs, creating a consistent bearish structure (Correction).
💥 Price Action & Breakout
Price action has now broken above that descending trend line, especially visible on the 30-min chart around the 15.70–16.00 zone.
This break came right after:
A demand zone bounce near 14.5
Completion of an Elliott Wave (4) correction
Breaking a daily trend line after a wave (4) correction is a classic confirmation signal that Wave (5) is kicking off.
If ESG holds above 15.70–16.00, we may see continuation toward:
🧾 Trade Idea (Long Setup)
📍 Entry: ~16.16
📉 Stop Loss: 15.08 (below local structure low)
🎯 Take Profit: 19.62 (prior supply zone retest)
🎯 Extended TP2: 22.3 (Last High)
⚖️ Risk/Reward Ratio: ~3.2R+
“ESG just tapped the demand zone like a sniper. That ABC correction looks done, and we got that hidden bullish divergence whispering ‘pump time’. If it breaks that 16.50 diagonal, bulls might rip through to 20 like it’s butter.”
⚠️ Disclaimer
This is not financial advice. Always do your own research and manage risk according to your strategy. Trading involves significant risk of loss.
 Long
Long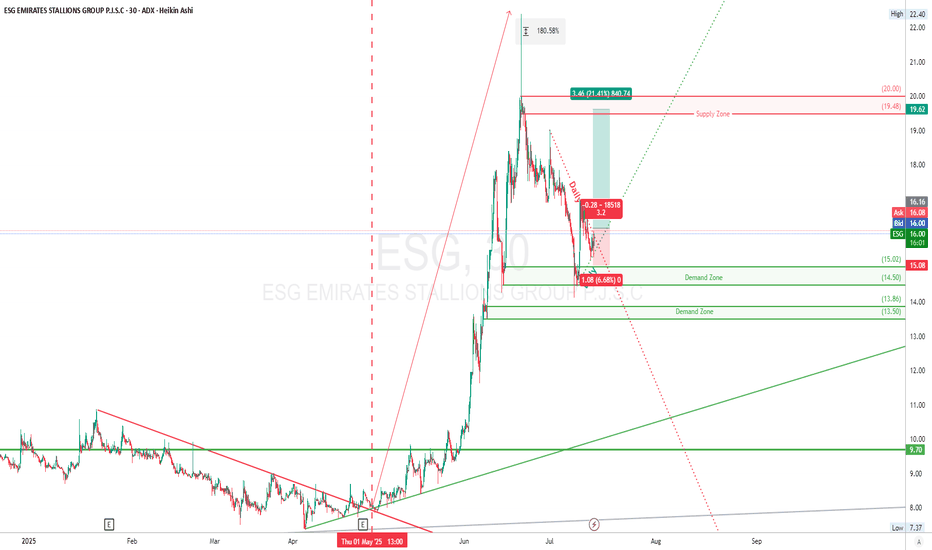
Overview: Alpha Data PJSC (ALPHADATA, ADX)Sector: IT & Digital Solutions | Location: UAE
🔹 New to the stock market — but not to the business
ADX:ALPHADATA is one of the largest IT companies in the UAE. It went public very recently — in May 2025 — but has been operating for over 40 years (founded in 1981). The company provides solutions in digital transformation, cloud computing, cybersecurity, and IT services.
What makes it especially attractive is its client base, which includes some of the UAE’s most prominent organizations:
• ASX:ADNOC , ADX:TAQA , ADX:EAND , Emirates, Etihad, DP World, Dubai Police, ADX:FAB
• These names represent the core of the UAE’s economy and government sector — large, reliable, and financially stable partners.
The digital and cybersecurity sector continues to grow rapidly, particularly in GCC countries where government-led digital transformation is accelerating. This makes Alpha Data’s business both relevant and resilient in today’s geopolitical and technological climate.
📉 Technical analysis: is the entry point near?
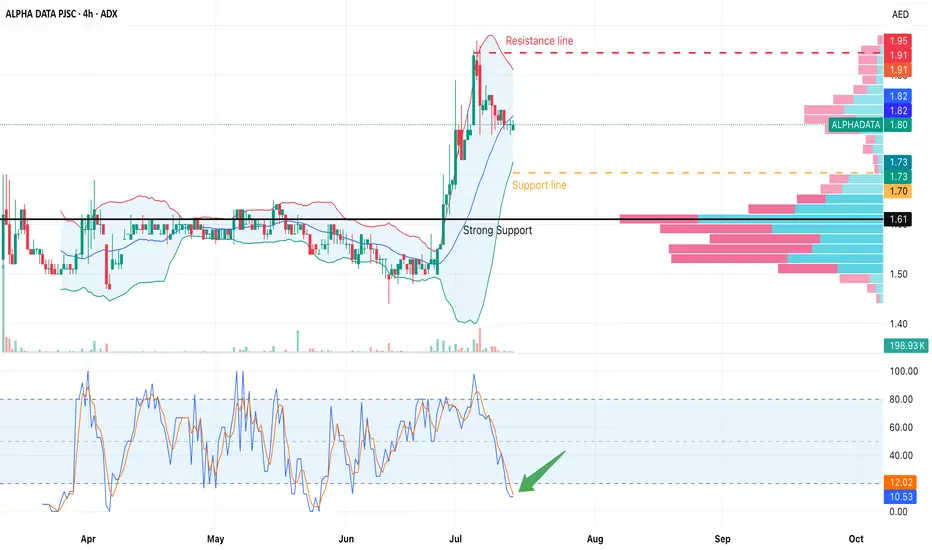
The chart shows that after the IPO, the price reached the 1.90–1.95 AED zone before undergoing a correction.
Currently, the price is holding around 1.78–1.80 AED, with the main volume area (POC) located at 1.61 AED — a strong support level.
Indicators suggest:
• RSI and Stoch RSI are in the oversold zone — signaling a potential reversal.
• The Volume Profile confirms that the price is still above key volume areas.
🟩 Bullish scenario:
• Holding above 1.70–1.75 AED → bounce toward the 1.90–1.95 zone is possible.
• A breakout above this range could open the way toward 2.00+.
🟥 Bearish scenario:
• A breakdown below 1.70 AED could lead to a retest of 1.61 AED, which may offer another long opportunity.
✳️ Why I’m interested in this stock:
• ✅ Recent IPO — the market is still forming its long-term view.
• ✅ Strong sector (IT, cybersecurity, digital transformation).
• ✅ Top-tier clients — from ADNOC to Etisalat.
• ✅ Rare dividend story: the company has already announced plans to pay dividends twice a year,
with an expected yield of 8–9% (based on the IPO price). Of course, the amount depends on profitability,
but the fact itself is unusual for a tech company in this region.
 Long
Long
 Long
Long
 Long
Long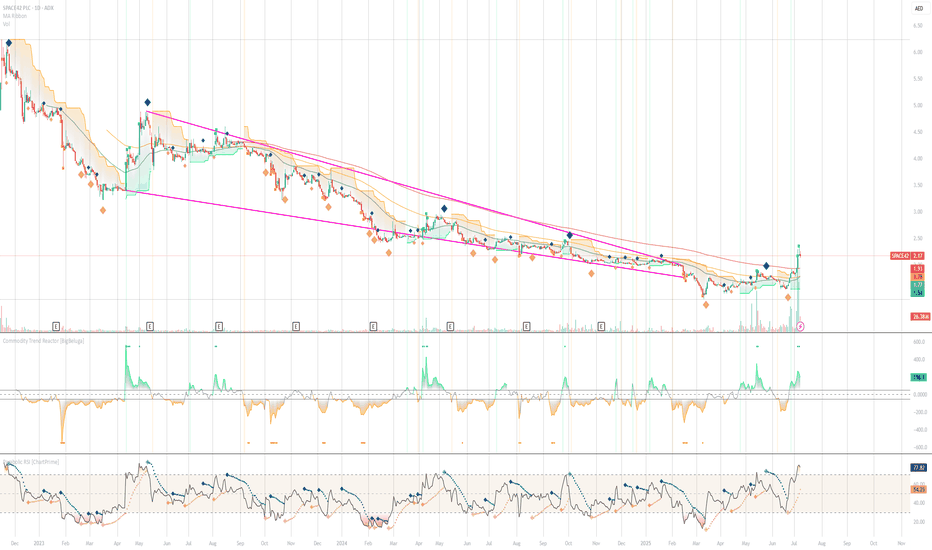
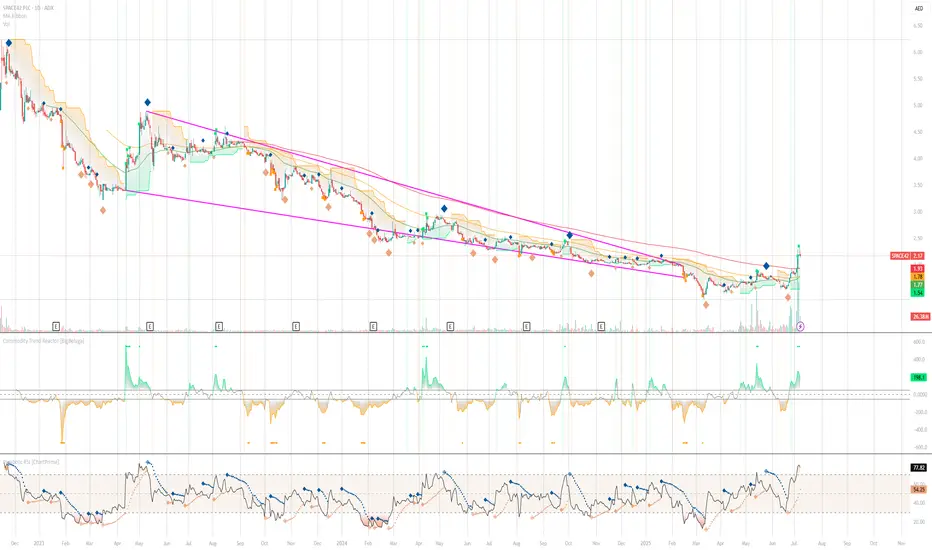
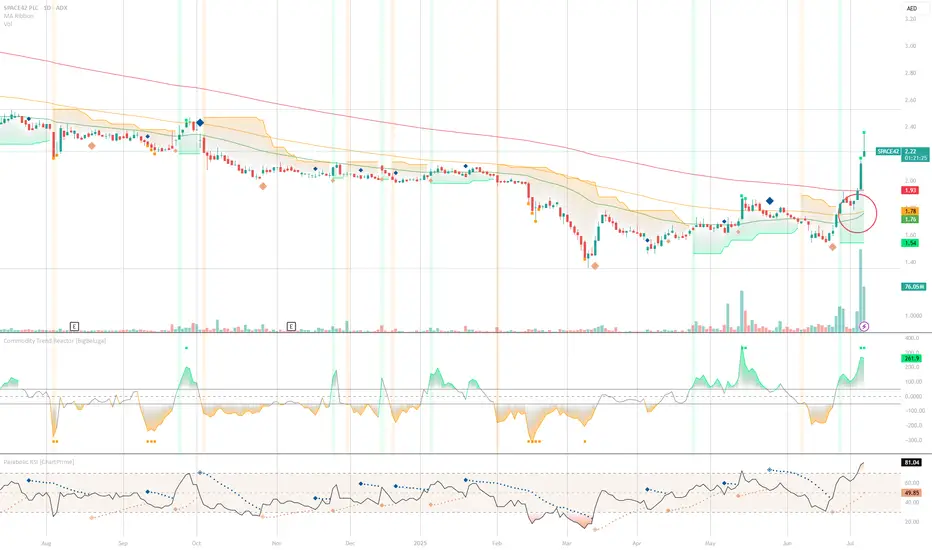
Updated Technical Analysis: Space42 PLC Daily CharThe daily chart of Space42 PLC is showing a strong bullish breakout from a long-term downtrend.
Key Observations:
Price Breakout: The price has decisively broken above the resistance at 1.78 AED, which was a key ceiling for several months.
Retest and Confirmation: There was a brief throwback to retest the 1.78 AED level, which successfully held as support, confirming the breakout.
Next Resistance : The immediate resistance is now located at 2.40 AED, which is the next technical target suggested by the breakout structure.
Support Levels:
Primary support: 1.78 AED (previous resistance, now confirmed support)
Secondary support: 1.60 AED (lower support zone within the previous consolidation range)
Indicators:
RSI: Currently at **80.77**, indicating strong momentum but also nearing overbought territory. Price may consolidate or pull back in the short term before further continuation.
Volume: A significant spike in volume accompanies the breakout, adding credibility to the move.
Commodity Trend Reactor: Displays positive strength and aligns with bullish momentum.
What to Watch:
Holding 1.78 AED Support: If the price remains above this level, the bullish structure is intact.
Approach to 2.40 AED Resistance: Look for signs of continuation (strong bullish candles and sustained volume) or potential rejection.
Pullback Behavior: A controlled retracement to 1.78 AED with low volume would be healthy and could provide a continuation setup.
Volume and RSI: Watch for decreasing volume on pullbacks and RSI behavior near current levels for potential cooling before a next leg higher.
Key Levels:
Support: 1.78 AED, 1.60 AED
Resistance: 2.40 AED
The current price action suggests bullish momentum, but traders should closely monitor how the stock behaves around these critical levels for confirmation of further movement.
Long 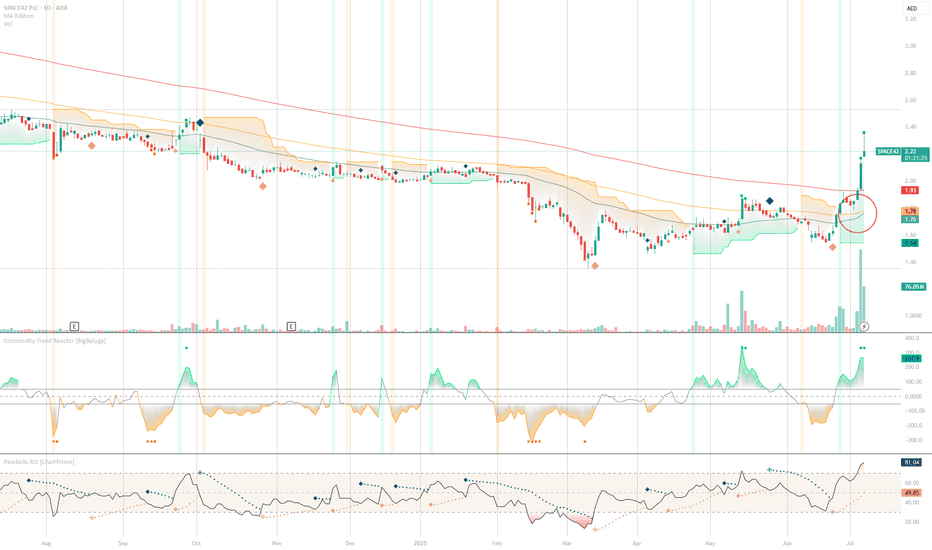
 Long
Long
 Long
Long
 Long
Long
 Long
Long
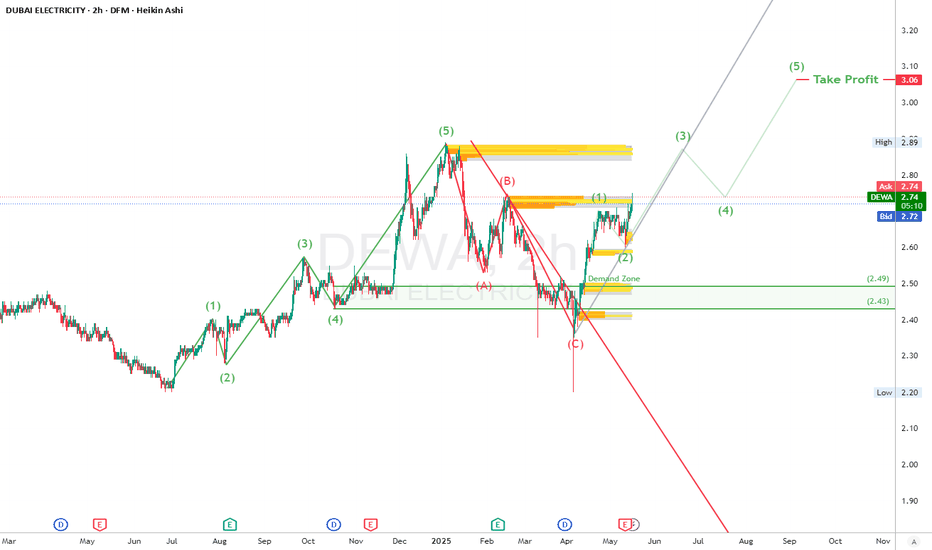
Is DFM a good buy? (Dubai)Why You Might Consider Buying
Fundamental tailwinds
-Dubai's economy is seeing strong growth, with GDP rising and non-oil sectors performing well. FDI inflows remain high, and tourism is growing (~16.8 m visitors in 2024).
-Exchange revenue is benefiting from rising trading volumes, even as clearing fees decline.
-It seems that each time DFM creates a new low, we get a nice pump from it, but this pump seems to get smaller each time it occurs.
Why Caution Is Warranted
Geopolitical volatility
-Regional tensions (Middle East conflicts).
Real estate pressure
-Fitch warns Dubai property prices could fall by double digits later in 2025–26 due to oversupply (~210k new units).
-Disclaimer: This analysis is for informational and educational purposes only and does not constitute financial advice, investment recommendation, or an offer to buy or sell any securities. Stock prices, valuations, and performance metrics are subject to change and may be outdated. Always conduct your own due diligence and consult with a licensed financial advisor before making investment decisions. The information presented may contain inaccuracies and should not be solely relied upon for financial decisions. I am not personally liable for your own losses, this is not financial advise.
 Long
Long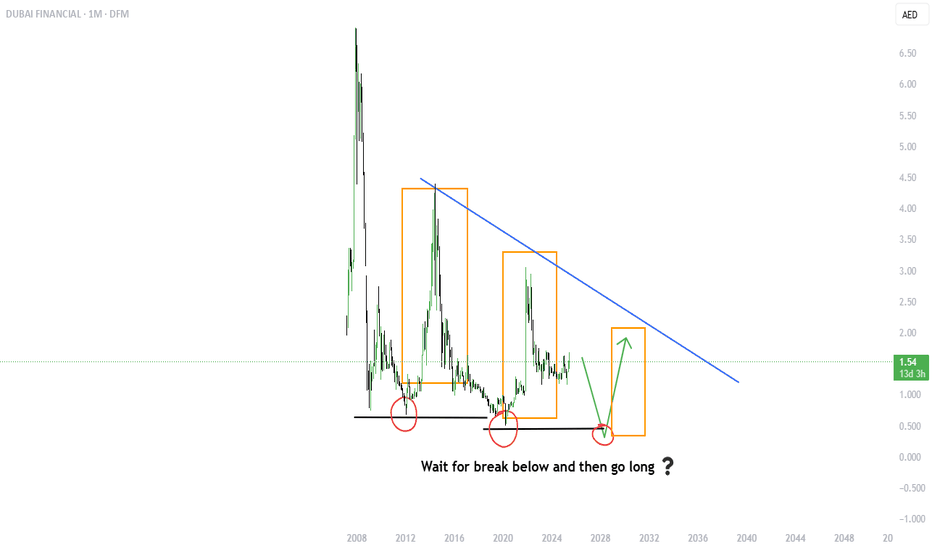
Short 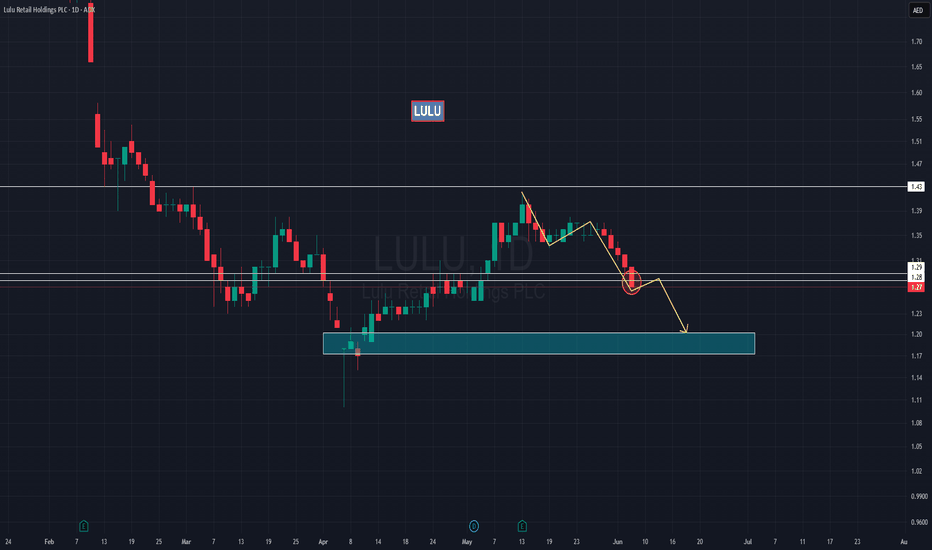
 Short
Short
 Short
Short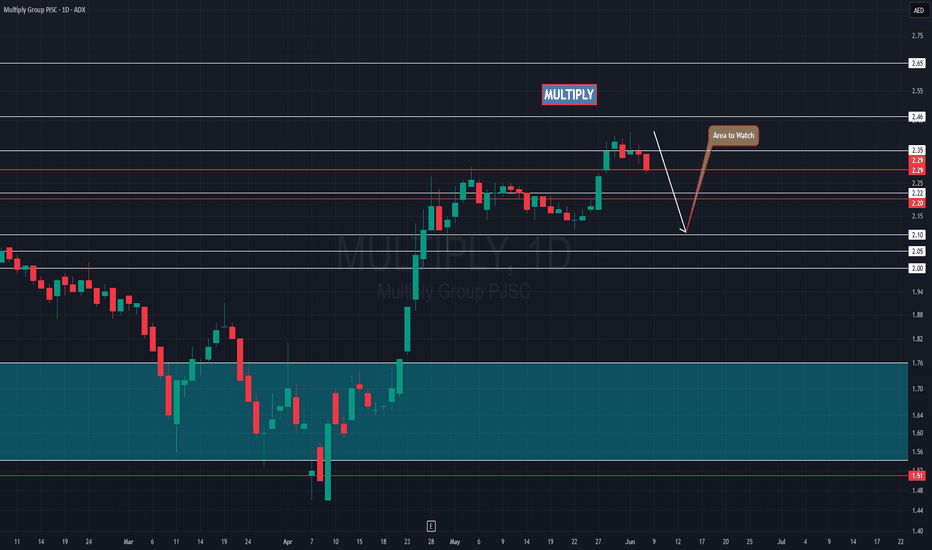
Short

 Short
Short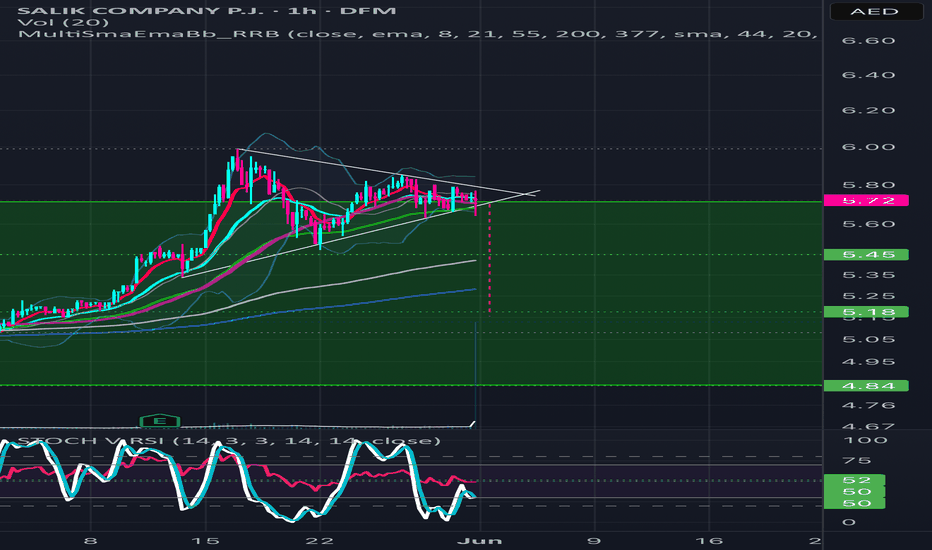
EMAAR Properties (Dubai)Emaar Properties, a leading real estate developer based in Dubai, has demonstrated robust financial performance in 2024, achieving record-breaking figures across various metrics.
Financial Performance:
Revenue: Emaar reported its highest-ever revenue of AED 35.5 billion (approximately US\$9.6 billion) in 2024, marking a 33% increase compared to the previous year.
Net Profit: The company's net profit before tax rose by 25% to AED 18.9 billion (US\$5.1 billion), reflecting strong operational efficiency and profitability.
Property Sales: Emaar achieved record property sales of AED 70 billion (US\$19 billion), a 72% increase over 2023 figures.
Revenue Backlog: The company's revenue backlog from property sales surpassed AED 110 billion (US\$30 billion) as of December 31, 2024, indicating robust future revenue streams.
Balance Sheet and Financial Ratios:
Total Assets: Emaar's total assets increased to AED 160.2 billion in 2024, up from AED 139.4 billion in 2023.
Total Equity: The company's total equity rose to AED 96.1 billion in 2024, reflecting a strong capital base.
Debt Levels: Emaar's total debt stood at approximately AED 9.6 billion as of the most recent quarter, with a debt-to-equity ratio of 10.5%, indicating prudent financial leverage.
Strategic Developments:
Dividend Policy: In December 2024, Emaar announced a new dividend policy, proposing its highest-ever dividend of 100% of share capital for 2024, amounting to AED 8.8 billion.
Land Acquisition: The company acquired 141 million square feet of development land in prime areas of Dubai, with a total development value of AED 96 billion, positioning itself for sustained growth.
Market Position and Outlook:
Emaar's strong financial performance in 2024 reflects its resilience and adaptability in a competitive real estate market. The company's strategic initiatives, including significant land acquisitions and a generous dividend policy, underscore its commitment to delivering value to shareholders. With a substantial revenue backlog and a robust pipeline of projects, Emaar is well-positioned to maintain its leadership in the real estate sector.
-*Disclaimer: This is just my personal opinion and not financial advice. I am not a professional financial advisor. Please do your own research before making any investment decisions. Any losses incurred are solely at your own risk.*
Long 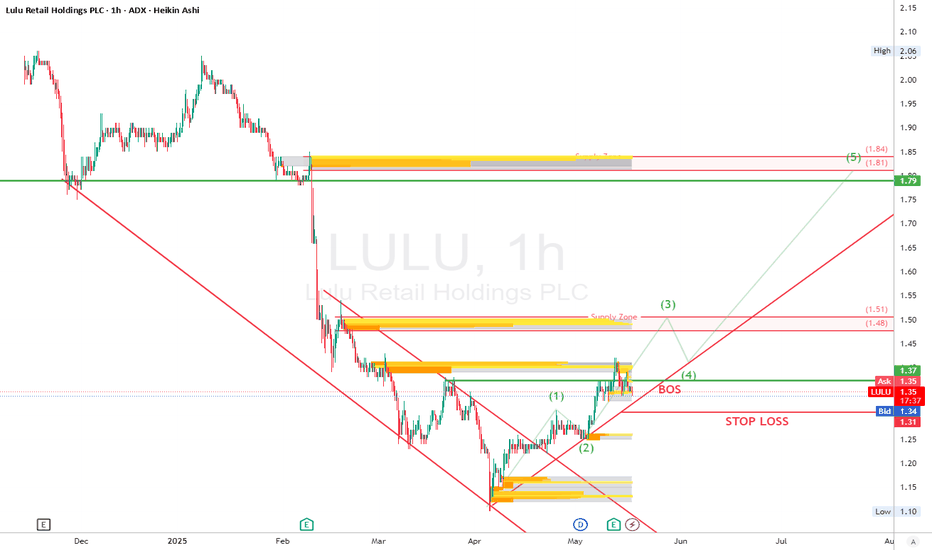
 Long
Long