• Products
  • Community
  • Markets
  • Brokers
  • More
Get started
  • Markets
  • /United Arab Emirates
  • /Stocks
  • /Ideas
Alpha Dhabi ADX - Bullish RSI DivergenceAlpha Dhabi is signaling a strong bullish continuation backed by RSI divergence and Elliott Wave structure. Enter near the 12.30–12.36 zone, manage risks with stops below 11.70, and take partial profits at each TP level. The RSI formed higher lows, while the price made lower lows, indicating momentum is shifting to the upside. Trade Setup: Entry: 12.36 (Bullish RSI divergence confirmation above demand zone) Stop Loss: 11.70 (Below key demand zone, invalidates Wave 2 structure) Take Profit Lev
ADX:ALPHADHABILong
by DubaiTradersHub
Updated
2
Dubai Taxi Company (DTC) - Possible Bullish BreakoutDubai Taxi Company (DTC) - Possible Bullish Breakout Setup 🚀 📈 Chart Pattern: Symmetrical Triangle + Flag Formation 📢 Revenue Estimate:$626M vs $507M** (🔥 +23% QoQ Growth) Strong earnings growth supports the bullish breakout scenario. RSI Divergence: bullish RSI divergence supporting an upside breakout. Flag Pattern: A bullish flag suggests a continuation toward new highs. Trade Setup: 🟢 **Entry:** **$2.73 - $2.75** (On breakout with volume confirmation) 🎯 **Take Profit:**
DFM:DTCLong
by DubaiTradersHub
EMSTEELBull market in metals underway. Wave 1 was 2020 to 2021/2. Wave 2 was 2022-2025 I think wave 3 has started which should be at minimum a move to the all time highs. +610%. Do you really want to be in tech right now? Or be sensible and pick a market very likely starting wave 3 of a bull market.
ADX:EMSTEELLong
by TipsOfPips
JULPHAR IS ready to explodeThis stock is raising money and reaching a certain point and moving upwards. Given its low risk and high reward, it will be a very good option in the future.
ADX:JULPHARLong
by amirsafaa
BILDCO 1H - RSI Divergence, ABC Correction Ending? Time to Buy?📈 BILDCO 1H - ABC Correction Ending? Time to Buy? 🚀 Market Overview Abu Dhabi National Co. for Building Materials (BILDCO) has experienced a strong rally since Mid 2024, reaching a high of 1.34, before correcting sharply. - The stock has now completed an ABC corrective pattern, with Wave C touching a major demand zone around 0.9546 - 0.9906. - RSI bullish divergence detected, signaling potential exhaustion of selling pressure. This could be the right time to accumulate positions as a new
BLong
by DubaiTradersHub
1
AMR (ADX) Potential Trend Reversal After a Long Downtrend📉 AMR 4H - Potential Trend Reversal After Downtrend 🚀 AMR has been in a strong downtrend (-47% decline) since October 17, mainly due to the Palestinian-Israeli war and subsequent boycott effects. - With a ceasefire in place, market sentiment may shift, creating a potential recovery. - A Break of Structure (BOS) has been confirmed, signaling a possible trend reversal. - Current wave analysis suggests the stock has completed Wave 1, and short wave 2 correction, and we are likely at early W
ADX:AMRLong
by DubaiTradersHub
4
Dubai Islamic Bank - 30% potential profitDubai Islamic Bank has a potential profit of 30%. Overall, the real estate, banking, and investment sectors in the UAE are gaining Momentum.
DFM:DIBLong
by Katri01
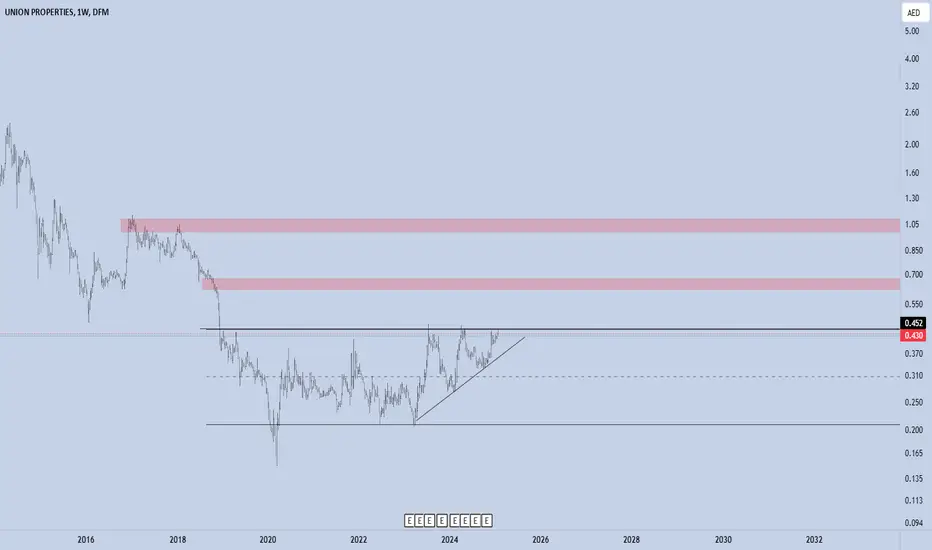
UPP - Do or DieI see weakness at the top of the channel, but if we break through, targets are marked. Overall, the real estate, banking, and investment sectors in the UAE are gaining Momentum.
DFM:UPP
by Katri01
FAB - Gaining Momentum hereIf we break through the red area, the next price targets are set. Overall, the real estate, banking, and investment sectors in the UAE are gaining Momentum.
ADX:FABLong
by Katri01
Salik Wave 5 on the way .. Hello Traders, #Salik #DFM finishing Wave C from ABC Correction of Wave 3 4.70 - 4.80 Potential Reverse zone , wishing you all a good luck
DFM:SALIKLong
by mohalsakkaf
BHM Capital 1H-DFM - Potential Wave 3 in ProgressUsing a combination of Supply and Demand Zones and Elliott Wave Theory, the stock appears to be in the early stages of a potential Wave 3. Wave 3 is typically the strongest impulsive wave, offering high momentum and significant profit margin. Key Levels: 1. Supply Zones (Resistance): o Zone 1: 2.88–3.01 (Conservative TP1 area) o Zone 2: 3.43–3.55 (TP3, next potential major reversal) o Zone 3: 4.22–4.56 (Stretch target for extended Wave 3) 2. Demand Zones (Support): o Zone 1: 2.10–2.16 (Curren
DFM:BHMCAPITALLong
by DubaiTradersHub
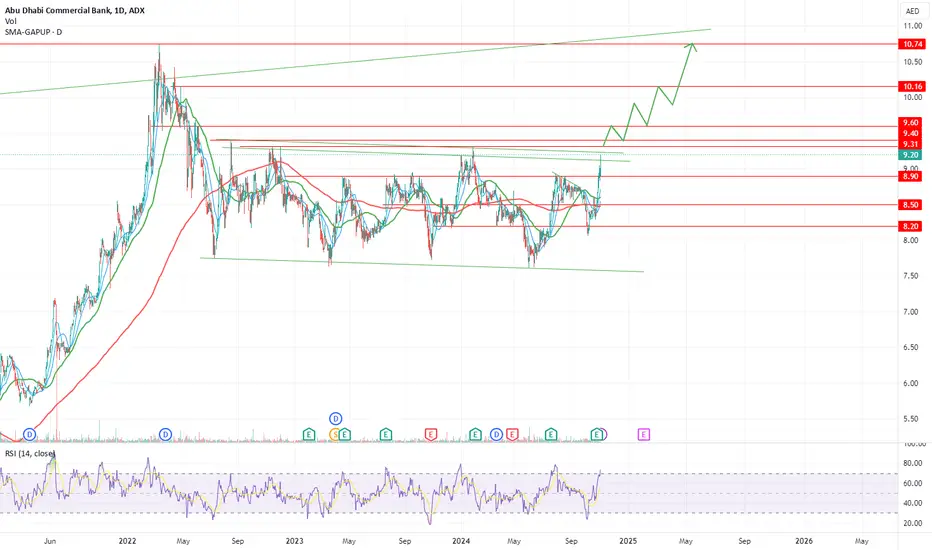
ADCB! Amazing chart!ADX:ADCB chart is amazing! More than two years of consolidation and now the stock seems to be ready to move forward. This is a long term buy and targets are higher than the levels shown on the chart, the anticipated price movement shown on the chart should unfold in the coming 6 to 12 months if the stock breaks above the level 9.31~9.4 AED. Stoploss daily close below 8.8 AED.
ADX:ADCBLong
by Chartoholic
Updated
IS EMAAR GOING DOWN ? Emaar's stock is targeting the levels of 12.20 - 12.05, presenting a good buying opportunity for short-term traders with targets of 12.65 - 12.75. It’s important to adhere to the stop-loss level, which is indicated by a daily close below these levels. Although there’s still a risk of the stock dropping back to previous levels around 11, the current movement needs to be monitored to determine its future direction.
DFM:EMAARLong
by CRYPTOMMS
Updated
ADX : DANADana in Emeriti stocks looks good and might drop before arising
ADX:DANALong
by emadeddissa
Taqa ADX should rebound from this levelDaily chart, the stock ADX:TAQA is still pushing downwards but the rate has slowed down. RSI is getting in the over-sold zone. So, I expect the rebound will start soon - may be in 2 weeks. Note the stop loss line. It is important to decide your own stop loss or profit protection level.
T
by snour
Updated
3
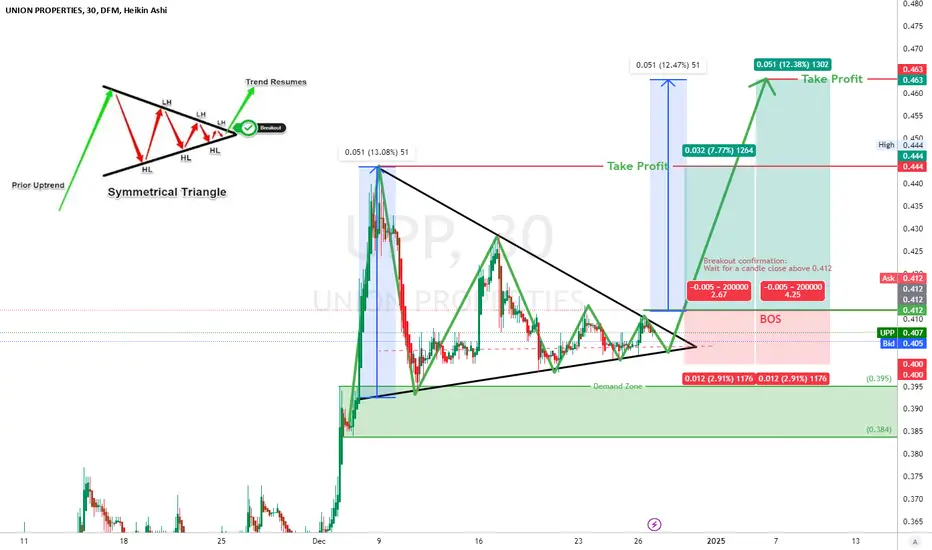
DFM:UPP Forming Symmetrical Triangle Pattern (Long)Trade Idea: DFM:UPP Symmetrical Triangle Pattern (Long) Overview: UPP is forming a symmetrical triangle, a consolidation pattern characterized by lower highs (LH) and higher lows (HL), converging toward an apex. These patterns are often continuation signals, with the breakout direction typically aligning with the prior trend. • Prior Trend: UPP has shown strong bullish momentum, increasing the likelihood of a bullish breakout. • Current Position: The price is nearing the apex of the triangle
DFM:UPPLong
by DubaiTradersHub
2
Bounce back. Burjeel Holdings Chart Analysis (ADX): The stock is in a downward channel, reflecting a long-term bearish trend. It is currently near the lower boundary of the channel (support around AED 1.98), a potential reversal point. A breakout above AED 2.40 (upper channel line) would confirm a bullish trend reversal. Watch for increased volume and bullish candlestick patterns for confirmation of a rebound. Upcoming earnings report in 44 days could act as a catalyst. Strategy: Short-term traders can cons
ADX:BURJEELLong
by ebadshafi89
Burjeel, ADX, is almost at the lowest historical levelWeekly chart, The stock ADX:BURJEEL is almost at the lowest price level historically. The least support level is 1.98 Technically speaking, below that level, the situation will be tough for even the stock maker. So, I believe, the rebound will start soon, for long-term bullish wave.
ADX:BURJEEL
by snour
Buy opportunityAction: Buy Instrument: SALIK Entry Price: 4.96 AED Support Zone: 4.88 to 4.75 AED (Strong demand zone) Resistance Zone: 5.60 to 5.88 AED (Key resistance levels) Target Price: 5.60 AED (Immediate target) Stop-Loss: 4.75 AED (Below the support zone) Risk/Reward Ratio: 1:3 Key Points: Demand Zone: The current price area (around 4.96 AED) lies within a strong demand zone (4.88 to 4.77 AED), indicating potential buying pressure. Resistance: The price faces resistance at 5.60-5.88 AED. If the stock b
DFM:SALIKLong
by GODOCM
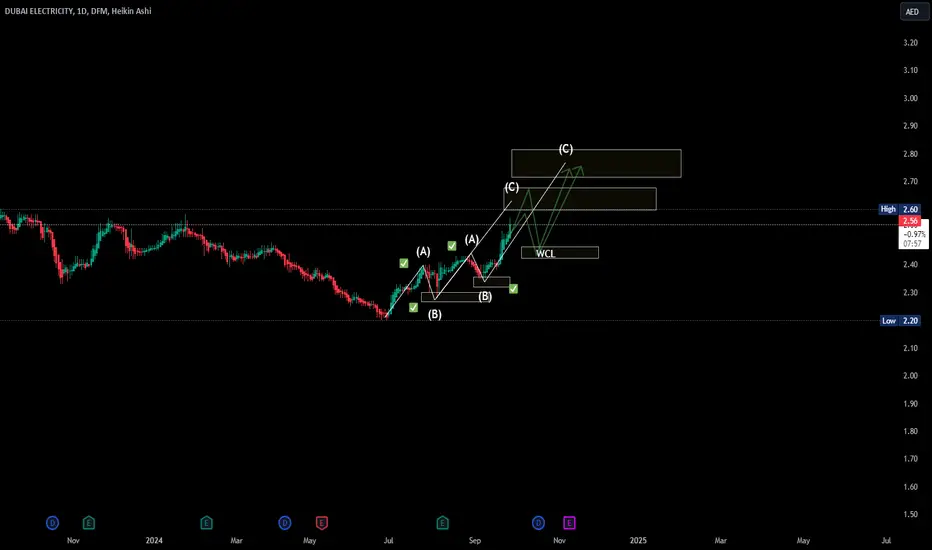
Dewa going upDewa more likely going up as showing in Day frame. As ABC correction and with Fib shows it hit the A,B and we are witting to hit target C. Note: Might be we see little correction on box WCL so we can Enter for LONG to continue going up to hit the target. Don't forget about your risk management.
DFM:DEWALong
by aljawadri
Updated
DewaAs you see I use tools of the Fib Analysis and ABC correction with trend. I put many scenario so it will give you idea about market when goes Up or Down. I hope its goes up but who knows ^^ be prepared with risk management. Note: all the lines its only to give you the big view of how trends goes doesn't matter of the dates and time.
DFM:DEWA
by aljawadri
Updated
UPP price action is bullish and is expected to appreciateDFM:UPP is coiling up nicely trading above 10 MA, long the break out of 0.375 AED preferably with high volume. Targets shown on the chart, stop daily close below 0.355 AED. PS. My views only, not financial advice!
DFM:UPPLong
by Chartoholic
Updated
1
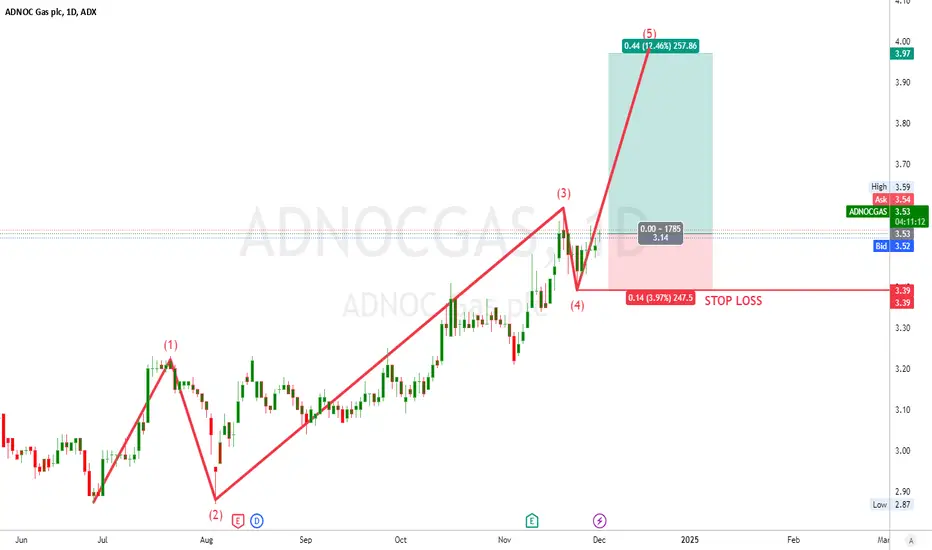
ADNOC Gas (ADX) – Riding Wave 5 Analysis: The stock appears to be in Wave 4 completion, and Wave 5 seems to be forming as per Elliott Wave Theory. The recent pullback aligns well with a key demand zone around 3.39, which has been respected, indicating strong buying interest. Wave Analysis: - Wave (1): Impulsive move from a prior consolidation range. - Wave (2): Corrective pullback, respecting prior demand. - Wave (3): Strong impulsive move higher with increased momentum. - Wave (4): A corrective pullback to a
ADX:ADNOCGASLong
by DubaiTradersHub
SHORT TERM BUY / LONG TERM SHORTPrice has been in a flag pattern that looks like it should break to the upside but another converging triangle within the channel shows a break below the range. Putting the two patterns together shows a tight trading range first to the upside and then a continuation back down in a break and retouch fashion. By measuring the price ranges, a break below the current low at 1.93 will drop price further to the 1.57 mark with extension to 1.26 level. Trade safe, good luck
DFM:DIC
by MENA-MARKETS-PRO
Updated
123456789101112131415161718192021222324252627282930313233343536373839404142
…999

Made by humans

Select market data provided by ICE Data Services. Select reference data provided by FactSet. Copyright © 2026 FactSet Research Systems Inc.Copyright © 2026, American Bankers Association. CUSIP Database provided by FactSet Research Systems Inc. All rights reserved. SEC filings and other documents provided by Quartr.© 2026 TradingView, Inc.

SOC 2 CompliantGDPR Compliant
More than a product
  • Supercharts
Screeners
  • Stocks
  • ETFs
  • Bonds
  • Crypto coins
  • CEX pairs
  • DEX pairs
  • Pine
Heatmaps
  • Stocks
  • ETFs
  • Crypto coins
Calendars
  • Economic
  • Earnings
  • Dividends
  • IPOs
More products
  • News Flow
  • Portfolios
  • Fundamental Graphs
  • Yield Curves
  • Options
  • Macro Maps
  • Pine Script®
  • MCP Server
Apps
  • Mobile
  • Desktop
Community
  • Social network
  • Wall of Love
  • Refer a friend
  • Creator program
  • House Rules
  • Moderators
Ideas
  • Trading
  • Education
  • Editors' picks
Pine Script
  • Indicators & strategies
  • Wizards
  • Freelancers
  • Marketplace
Tools & subscriptions
  • Features
  • Pricing
  • Market data
  • Gift plans
Trading
  • Overview
  • Brokers
  • Brokers comparison
  • The Leap
Special offers
  • CME Group futures
  • Eurex futures
  • US stocks bundle
About company
  • Who we are
  • Space mission
  • Blog
  • Help Center
  • Careers
  • Media kit
Merch
  • TradingView store
  • Tarot cards for traders
  • The C63 TradeTime
Policies & security
  • Terms of Use
  • Disclaimer
  • Privacy Policy
  • Cookies Policy
  • Accessibility Statement
  • Trust Center
  • Security tips
  • Bug Bounty program
  • Status page
Business solutions
  • Widgets
  • Charting libraries
  • Lightweight Charts™
  • Advanced Charts
  • Trading Platform
Growth opportunities
  • Advertising
  • Brokerage integration
  • Partner program
  • Education program
Community
  • Social network
  • Wall of Love
  • Refer a friend
  • Creator program
  • House Rules
  • Moderators
Ideas
  • Trading
  • Education
  • Editors' picks
Pine Script
  • Indicators & strategies
  • Wizards
  • Freelancers
  • Marketplace
Business solutions
  • Widgets
  • Charting libraries
  • Lightweight Charts™
  • Advanced Charts
  • Trading Platform
Growth opportunities
  • Advertising
  • Brokerage integration
  • Partner program
  • Education program
Look FirstLook First