Indigo: Can this news help recover the stock ?
IndiGo has formed a potential Head and Shoulders pattern on its daily chart, raising concerns about further downside.
📉 What does the chart indicate?
Left Shoulder: Around ₹4,980
Head: Around ₹6,100–6,200
Right Shoulder: Around ₹5,470
Current Price: Around ₹4,700
Neckline Support: Approximat
Where the world does markets
Join 100 million traders and investors taking the future into their own hands.
Get started for free$0 forever, no credit card needed

Supercharged
Supercharts

XAUUSD 1H | Gold Approaches a Key Resistance ZoneGold is currently trading around 4,175 on the 1-hour chart, with price moving between a nearby resistance area and a lower support zone.
Key technical levels
- Resistance: 4,200–4,215
- Support: 4,065–4,080
- Potential upside reference: 4,318
Bullish outlook
If buyers manage to break above the r
NSE Wipro: Wave (C) Signals More Downside Risk🔎 Elliott Wave Analysis | 240-Minute Chart
Wipro continues to show a bearish Elliott Wave structure on the 4-hour chart. The decline from the 2025 high near 324.60 has significantly weakened the price structure, and the recent recovery from around 158 toward 184–185 may be a countertrend boun
Mother & Child Patterns in Hindustan Zinc Ltd.#Future Segment Stock
𝗠𝗼𝘁𝗵𝗲𝗿 & 𝗖𝗵𝗶𝗹𝗱 𝗣𝗮𝘁𝘁𝗲𝗿𝗻𝘀 | 𝗛𝗶𝗻𝗱𝘂𝘀𝘁𝗮𝗻 𝗭𝗶𝗻𝗰 𝗟𝘁𝗱.
📊 An interesting example of the Mother & Child Pattern on the daily linear chart of Hindustan Zinc Ltd.
Identifying smaller patterns within a larger market structure can provide better clarity when assessing potential price targets.
NIFTY : INTRADAY TRADING PLAN | 19 OCTOBER 2026Previous Close: 23,121.60
Timeframe: 15 Minutes
1. MARKET STRUCTURE
NIFTY has recovered strongly from recent lows and is consolidating near 23,120. The short-term structure remains positive, but buyers must overcome the opening resistance to continue the recovery.
2. IMPORTANT LEVELS
🔴 M
TCS – Daily Analysis – 10% to 37.15% UPSIDE PotentialNSE:TCS
Tata Consultancy Services Limited (TCS) is establishing a major double-bottom reversal on the daily chart following an extended corrective move from its peak at ₹3,350.00 . The stock built a clean **W Pattern Breakout** structure supported by the **Bottom Entry Zone** around ₹1,976.80
XAUUSD: Elliott Wave Analysis — Overview
Following the completion of the major bullish impulse wave in January 2026, XAUUSD entered a corrective phase characterized by an ABC Zigzag structure. Currently, the focus is on the unfolding Wave (b) correction, which is forming a classic triangle pattern.
Wave Breakdown & Structure
* Wa
ASTRAL LTD. FLAG AND POLE BREAKOUTTimeframe: 30 Minutes | NSE
Astral is showing a potential Bullish Flag & Pole Formation after a strong impulsive move from the recent lows.
🔹 Pole: A sharp bullish rally with strong momentum.
🔹 Flag: Price is consolidating near the highs, potentially forming a bullish continuation pattern.
🔹 Vol
TCS IS BACK IN ACTION (AI ERA) 📌 TATA CONSULTANCY SERVICES (NSE: TCS) – Breakout After Q2 FY27 Results 🚀
TCS has broken out of a multi-week downward trendline after forming a rounding-bottom (cup) structure on a strong demand zone. The breakout came with a spike in volume right after the Q2 FY27 results.
- India's largest IT se
NIFTY 15-Minute Chart | Bullish Breakout SetupNIFTY is showing a potential bullish reversal after breaking above a descending trendline resistance on the 15-minute timeframe.
🔍 Technical Analysis: ✅ Price breakout above the descending trendline
✅ MACD bullish crossover with positive and rising momentum
✅ RSI near 77, indicating strong buying m
See all editors' picks ideas
Market Matrix (Zeiierman)█ Overview
Market Matrix (Zeiierman) is a multi-timeframe market analysis dashboard that brings together price structure, trend, momentum, and market strength into six compact indicator panels.
Instead of switching between multiple indicators and timeframes, Market Matrix displays higher-timefr
RedK Indicator Amplifier (RedK i-Amp)🟩 What is RedK i-Amp?
-------------------------------
RedK i-Amp is not an indicator in itself - it's a "wrapper" utility that "amplifies" another "source" indicator by improving its visual and alerting capabilities.
RedK i-Amp hooks to another indicator's plot and enables the addition of the fol
TASC 2026.10 A Low-Risk ETF-Trading Strategy█ OVERVIEW
This script implements concepts from a short-term ETF investment strategy outlined by Markos Katsanos in the article "Selecting Strong ETFs While Avoiding Sharp Overbought Reversals" from the October 2026 edition of TASC Traders' Tips . The strategy analyzes Katsanos' custom relative s
Buyers & Sellers Profile + Dynamic S/R (Zeiierman)█ Overview
Buyers & Sellers Profile + Dynamic S/R (Zeiierman) is a volume-profile and market-structure indicator designed to combine a large rolling Buyers/Sellers Volume Profile with dynamically generated support and resistance levels.
Instead of treating the volume profile and swing structure
Vol-Control Fund PositioningThe investors who sell because nothing happened
In 2017 the American stock market was so calm that a whole class of institutional portfolios held more equities than their own capital, simply because the rules they follow told them to. Reconstructed with the model behind this indicator, their estim
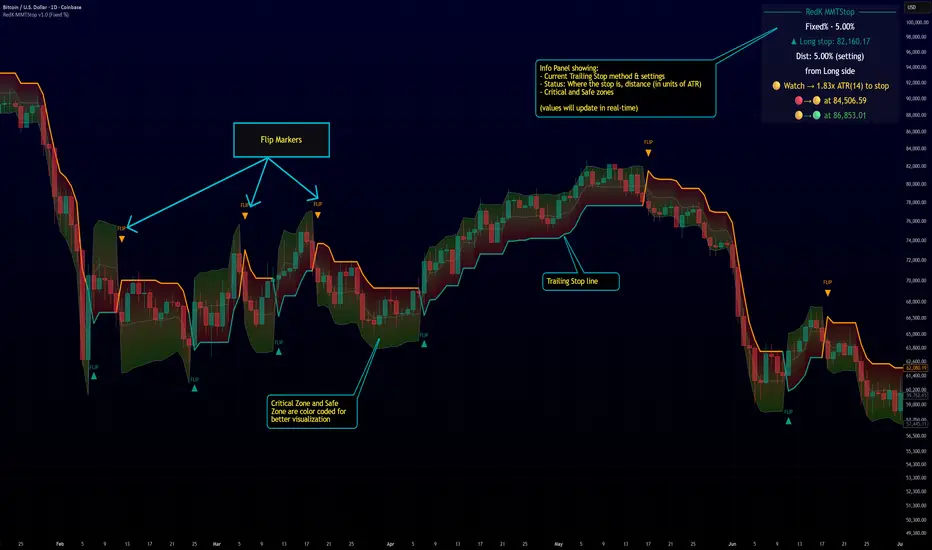
RedK Multi-Modal TrailingStop (RedK MMTStop)█ RedK MMTStop - Release Notes
Introduction & background
RedK MMTStop is a Multi-Modal Trailing Stop indicator - Let's quickly explore the "trailing stop" concept first as a refresher - then explain what a multi-modal trailing stop indicator does.
A "Trailing Stop" is what helps traders avoi
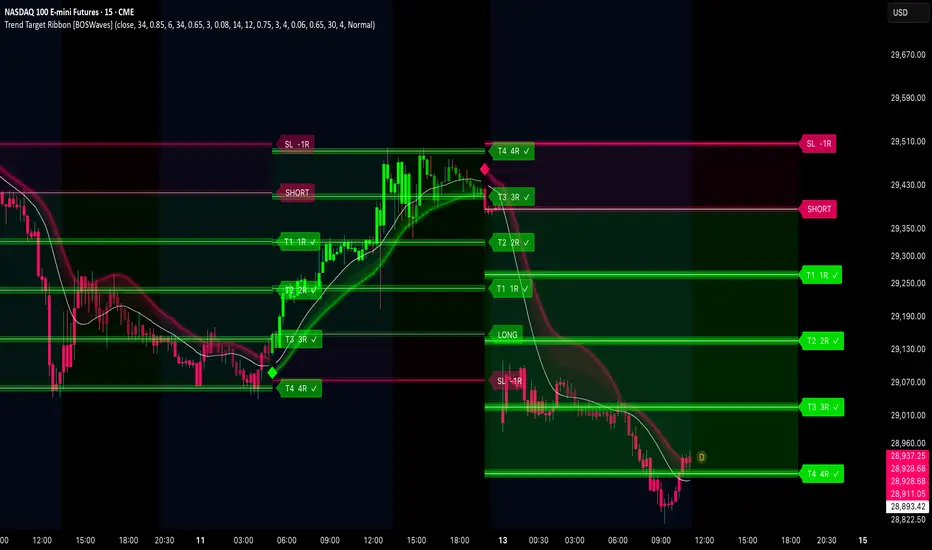
Trend Target Ribbon [BOSWaves]Trend Target Ribbon - ALMA Conviction Trend Detection with Integrated Structure-Based Position Planning and R-Multiple Target Tracking
Overview
Trend Target Ribbon is an ALMA-based trend identification system that combines slope-normalized momentum confirmation with standard deviation band
Wyckoff [theUltimator5]This indicator was designed to be a comprehensive, intuitive, overly engineered algorithm that plots Wyckoff accumulation and distribution patterns on the chart as they arise. It shows the current status of the regime on a side panel, while also overlaying the accumulation or distribution schematic
XeL OnlineRecursionXeL OnlineRecursion is a Pine Script library for online and streaming statistical estimation on continuous numerical and financial data.
The library is designed around recursive statistical populations whose retained state is updated observation by observation. Most recursive components use consta
Dual-Phase Reversal by DGTDual-Phase Reversal • Exhaustion, Pivots & Pressure
Dual-Phase Reversal (DPR) is a two-phase market exhaustion framework that tracks directional momentum through Momentum Exhaustion and Terminal Exhaustion . It combines sequential price conditions, Momentum Shift initiation, phase qualificatio
See all indicators and strategies
Community trends
Indigo: Can this news help recover the stock ?
IndiGo has formed a potential Head and Shoulders pattern on its daily chart, raising concerns about further downside.
📉 What does the chart indicate?
Left Shoulder: Around ₹4,980
Head: Around ₹6,100–6,200
Right Shoulder: Around ₹5,470
Current Price: Around ₹4,700
Neckline Support: Approximat
KARURVYSYA Rounding Bottom Breakout Backed by Massive VolumeThe daily chart for Karur Vysya Bank Ltd. presents a strong bullish setup, having just completed a classic rounding bottom pattern.
The price action indicates a structural shift in momentum, shifting from a gradual accumulation phase into a decisive markup phase.
Key Chart Observations:
Pattern Br
Auropharma - Multi timeframe analysisIn the lower timeframe, the price is giving a breakout from a descending triangle. In the daily timeframe, the price is moving within a range and is forming a rounding-top pattern. It is a bearish pattern, but the range movement has made it choppy. If the price falls, it won't be a trending move.
S
Mid-Week Chart Study: Market Structure on Monthly Time Frame Apoorv Dubey, SEBI Registered Research Analyst
Disclaimer:
This video is for educational and informational purposes only and is not a recommendation to buy, sell or hold any security. Investments in securities markets are subject to market risks. Read all related documents carefully before investin
A 74% Rally Could Be Brewing After This Long CorrectionSupreme Industries is showing early signs of a major trend reversal after spending more than two years under a falling resistance trendline. Since making its high near 6300 in 2024 the stock has continuously faced selling pressure at lower levels. Every recovery attempt was rejected near the same de
Force Motors cmp 17680.20 Weekly ChartForce Motors cmp 17680.20 Weekly Chart
- Support Zone 15000 to 17000 price band
- Strong Support Base 16500 to 17000 range
- Resistance Zone 17950 to 19950 price band
- Prices seems testing retesting the Support Zone
- Volume falling, need to increase for fresh uptrend
- Breakout from Descending Tr
MVGJL — SWING TRADING WEEKLY SETUPMVGJL — SWING TRADING WEEKLY SETUP
Entry, Stop Loss & Targets Are Clearly Defined — Helping You Plan Your Trade With Confidence.
📊 Stock Strength: 62/100
(Note: Higher score indicates stronger stock conditions, not guaranteed returns.)
A bullish breakout has appeared on the 1 Week timeframe with
India Cements (D): MASSIVE SUPPORT BOUNCE & BREAKOUTTimeframe: Daily | Chart Scale: Linear
Explosive +12.04% surge today backed by a massive 28.53M volume spike! 🔥
Technical Highlights:
✅ Macro Floor: Bounced directly off a massive long-term angular support (active since Feb 2020!).
✅ Breakout: Cleared & closed above short-term consolida
See all stocks ideas
Today
IIFLCAPSIIFL Capital Services Ltd
Actual
—
Estimate
—
Today
LMWLMW Limited
Actual
—
Estimate
68.20
INR
Today
HEIDELBERGHeidelbergcement India Limited.
Actual
—
Estimate
0.83
INR
Today
SRFSrf Limited
Actual
—
Estimate
19.71
INR
Today
RAJRATANRajratan Global Wire Limited
Actual
—
Estimate
—
Today
ADORAdor Welding Limited
Actual
—
Estimate
—
Today
IGILInternational Gemological Institute Ltd
Actual
—
Estimate
3.55
INR
Today
JTLINDJTL Industries Limited
Actual
—
Estimate
—
See more events
Community trends
The battle is ongoing on BTCUSD — 1H timeframeHello traders!
This is actually one of my active trades. I went long at the previous level around 80,700 on the first touch, which also swept the liquidity below the equal lows on the left. Price then made a nice excursion to the upside and closed above the previous swing high. The two yellow arrow
BTCUSD (Bitcoin / U.S. Dollar)
BTCUSD 15m Short: High-Asymmetry Setup at Key Resistance
• Ticker: BTCUSD (Bitcoin / U.S. Dollar)
• Timeframe: 15-Minute (15m)
• Current Price: 81,518.58 USD
Trade Parameters
• Position Type: Short / Sell
• Entry Zone: 81,572.62 USD (Immediate resistance level)
• Stop Loss (SL): 81,607.70 U
Btc (1h)BTCUSD 1H – Bearish Setup 📉
Bitcoin is approaching a major resistance zone around 83,200–83,600. Price rejection from this area could lead to a bearish move toward 80,700, followed by a possible extension toward 80,300.
Key Levels:
- Resistance: 83,200–83,600
- Support 1: 80,700
- Support 2: 79,7
BTC/USDT - Base Fuel the Next Push Toward $86KBINANCE:BTCUSDT is compressing around a key decision area after repeatedly holding above the 80,000–81,300 support zone. Buyers have defended this region several times, while price is now pressing back toward the descending trendline that has capped every major recovery since early October.
The s
Bitcoin (BTCUSD) Forecast | SMC Analysis, Liquidity Sweep BTC is trading near $81,910. Price may sweep SSL liquidity around $80,400–$80,700 before a potential bullish reversal toward $82,800–$83,000 and $84,000. Watch for MSS confirmation before any entry.
⚠️ Disclaimer: This analysis is for educational purposes only, not financial advice. Cryptocurrency
ETHUSDT: The Balance Is Quietly ShiftingETHUSDT is still trading within a broader range, but the price action near the lower end of that range is becoming more interesting.
What stands out to me is the market’s repeated ability to absorb selling without breaking down cleanly. Buyers are not dominating yet, but they are showing up often e
SKYHINX — Demand Zone Setup (Daily Chart)A potential bullish reversal opportunity is developing at a key daily demand zone.
📊 Market Structure
After a significant bearish move, price has returned to a historically important demand area where buyers may attempt to regain control.
The focus is on how price reacts around this zone and whet
BTCUSDT: Holds the Breakout, Next Target ZoneBTC is still holding above the descending trendline on the 2H chart, while the ascending channel continues to support the short-term bullish structure.
Price is also staying above the EMA cluster around 82.25K–82.27K, making 82.2K–82.5K the key support area to watch.
If buyers continue defending t
Short-Term Counter trend Sell SetupBTCUSDT – Short-Term Countertrend Sell Setup ⚠️
Market: BTCUSDT
Timeframe: 30M
Setup: Potential Short / Sell
Key Area: Marked Supply Zone
🔍 Market Analysis
The overall trend on the higher timeframes is bullish. However, price has reached a potential supply zone where selling pressure may appear.
Bitcoin USD 45 Minute ChartBullish Recovery Attempt Signals Potential Continuation Toward Major Resistance
Bitcoin is showing signs of a short term bullish recovery after an extended period of sideways consolidation and repeated price fluctuations around the 81,000 to 82,000 support region. The latest price action shows a st
See all crypto ideas
XAUUSD M45: Higher Lows — But 4,218 Is the Real Test
Market Context — Buyers Are Recovering Control
Gold is trading around 4,178 after a strong recovery from the structural low at 4,074.
The M45 chart reveals an important shift in market behaviour. After several bearish sessions, gold broke away from its descending trendline, formed a bullish Chan
XAUUSD 15 minI think gold stuck in consolidation for long hours then gonna break its upper short term resistance (4150) and main is gold have very strong support below (4130-4120) I don't think so its gonna break sooo easily.. and if its broke there is long pips in pocket... I guess soo
So wait for proper cons
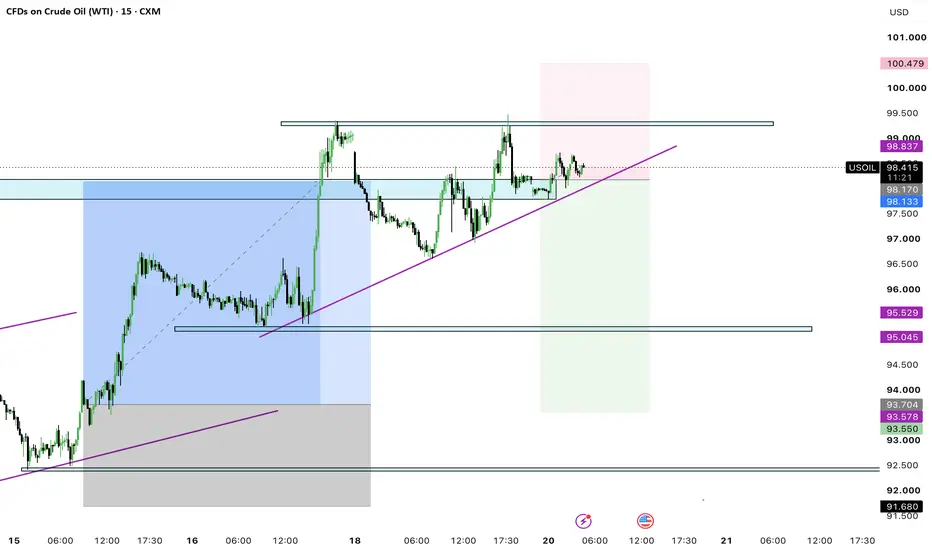
USOIL SELLUSOIL / Crude Oil Price Prediction: Bearish Breakdown Below Lower Trendline | Fakeout vs Real Breakout Explained
Description:
Crude Oil Technical Analysis Today - Bearish Bias Below Trendline
Oil is trading inside a rising channel. My bias is BEARISH if price breaks the lower trendline.
Trade Pl
M30: Breakdown Retest Keeps the Downside in Focus
Gold is trading around 4,131, with the M30 structure still bearish after breaking below the previous rising trendline. The latest rebound remains corrective while price trades below the 4,157.050 Breakdown Retest zone.
Market Drivers
Gold remains under pressure from elevated U.S. yields and a rela
XAUUSD: Can Gold's Rebound Survive a Demand Test?Gold is holding its recovery, but buyers have yet to clear the resistance that would invalidate the chart's bearish pullback scenario.
The next meaningful test lies beneath current price: can demand hold when the rebound loses momentum?
MARKET OVERVIEW
Softer oil and declining Treasury yields are
# BRIAN XAUUSD – GOLD BELOW 4,200, LIQUIDITY SWEEP OR BREAKOUT # BRIAN XAUUSD – GOLD BELOW 4,200, LIQUIDITY SWEEP OR BREAKOUT TOWARD 4,317?
Gold has started the new trading week with a modest recovery toward 4,175, but the broader H3 structure remains bearish. Buyers are attempting to rebuild momentum after the recent decline, while the descending trendline co
Gold Is Preparing for a RepricingGold is currently in a phase where short-term monetary pressure is competing with a broader investment case that remains supportive. Expectations that U.S. rates could stay restrictive are limiting upside momentum, but geopolitical uncertainty and continued demand for defensive assets are keeping in
XAU/USD GOLD ANALYSIS ICT+SMC M30 | Bullish Reversal SetupXAU/USD — GOLD MARKET ANALYSIS (M30)
📊 Market Structure: Bearish short-term trend, with price approaching a strong demand zone.
🔹 ICT: Sell-side liquidity may be swept near 4,105–4,100 before a potential bullish reversal.
🔹 SMC: Demand zone around 4,100–4,108 may attract buyers. Wait for a bullis
H1 Bearish Structure After FVG Breakdown
Fundamental Analysis
Gold remains under pressure as the market reassesses the Fed’s path. September CPI rose 3.7% YoY, while PPI also came in hot, reinforcing concerns that inflation remains too persistent. At the same time, oil prices have climbed toward five-month highs amid geopolitical tensions
See all futures ideas
EURUSD – Buyers Are Starting to Rewrite the TrendEURUSD is showing an interesting change in character. After spending weeks inside a well-defined bearish channel, price has finally moved outside that structure and is now holding around 1.1200 instead of immediately falling back into the previous downtrend . For me, that behavior matters more than
GBPUSD 4H | Demand Zone & Channel Support ReactionGBPUSD — 4H Technical Analysis
GBPUSD has been in a broader bearish structure, but price is now reacting from a well-defined 4H demand/support area that aligns with the lower boundary of an ascending channel.
The setup is based on three key factors:
1️⃣ 4H Demand Zone
Price has repeatedly reacted
EURUSD BULLISH VIEW ON 1W & 1D TIME FRAMEThe eurusd has shown stronge bearish momentum at 1d time frame and the price has came to my demand zone after a zig zag supply . According to my Analysis the supply is over and we can see a stronge demand from the OFL after the sweep of the previous candle and it has done it . so I have make struct
AUDNZD buy opportunity Bullish Outlook | Key Support Level
Technical Analysis
Price Action: Price has reached a major support level.
4H RSI: 21, indicating oversold conditions and potential buying pressure.
Daily RSI: 42, indicating neutral momentum.
Current Trend: Bullish.
Overall Bias: Technical confluences favor a po
Can Rupee strengthen further?Rupee has gained almost 2% from its recent peak of 96.85, amid the slew of measures announced by the RBI to curb the speculative trading in the forex markets. Currently it is trading near its 30 Weekly EMA level of 94.6580. Historically, a close below 30WEMA caused rupee to strengthen/consolidate fo
EURUSD ready to rallyThough monday was bank holiday E/U has successfully closed below the range with amazing volume. And since its approaching 4H fvg and along with it there is previous weeks POC (point of control) it’s really a good to take shorts!!!
Will be looking for confirmation on LTF such as 15min.
USDINR — Week 41 Structural Analysis | Structural AdvanceUSDINR — Week 41 Structural Analysis | Structural Advance Above Resistance
LTP/CMP: 96.7800
Introduction
USDINR maintains its Structural Advance above the established Resistance Zone. The latest displayed price is 96.7800, above the 94.50–95.50 Resistance range.
The current structural position r
See all forex ideas
Trade directly on Supercharts through our supported, fully-verified, and user-reviewed brokers.