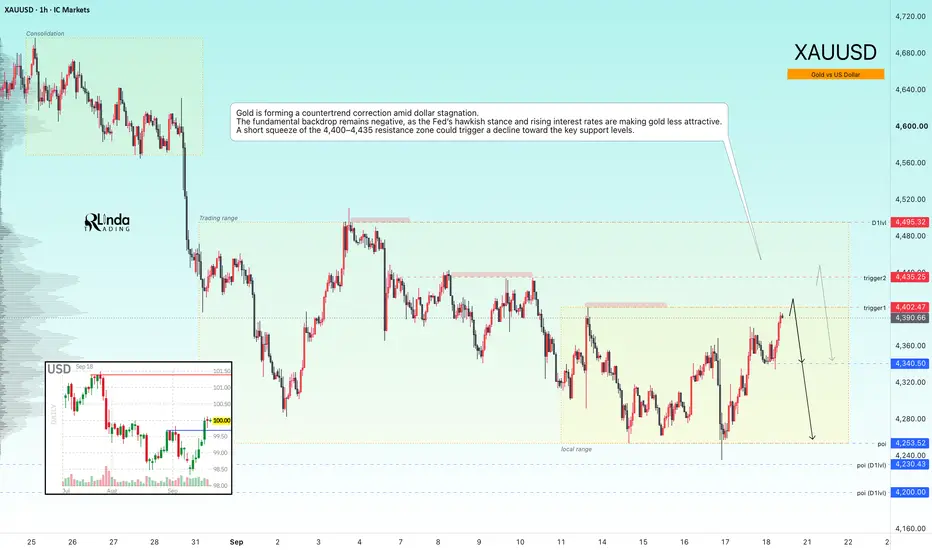
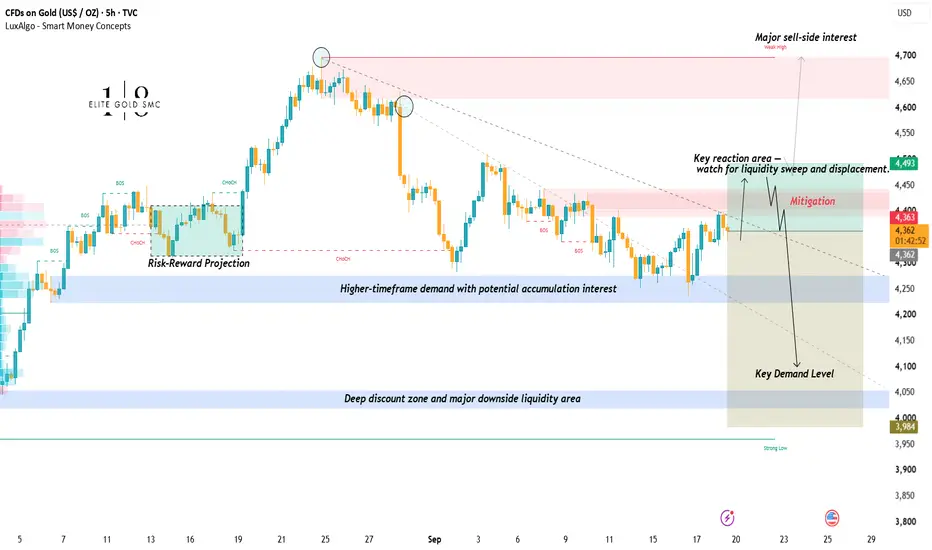
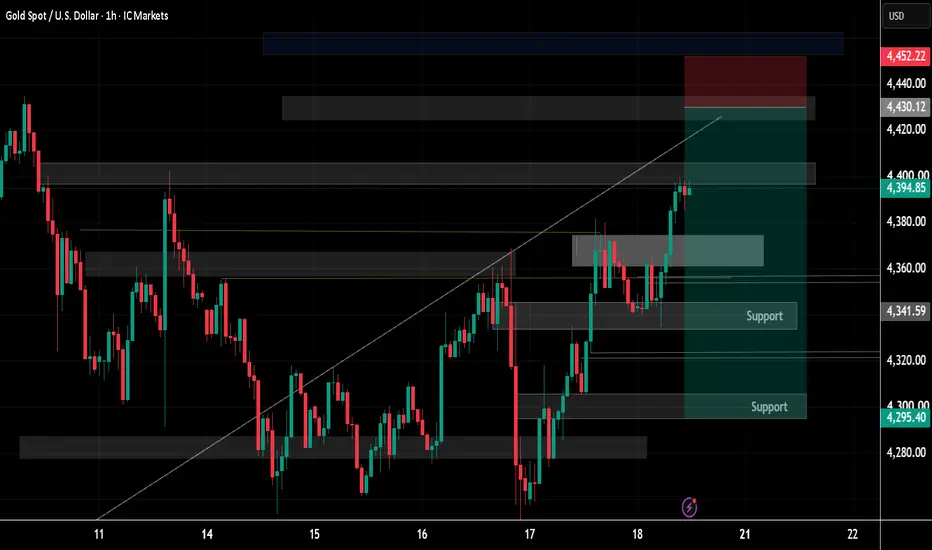
GOLD - A countertrend correction aimed at liquidity huntingICMARKETS:XAUUSD has been forming a countertrend correction toward the 4,400–4,430 liquidity zone since the session opened. The fundamental backdrop remains weak, and the market is still in a bearish trend
The dollar is stagnating after breaking through local resistance levels. The Fed’s hawkish stance and rising rates are supporting the Dollar Index, which is putting medium-term pressure on the metals market. However, the correction in oil prices is giving gold some room to recover as it tests key levels.
Gold is stabilizing, but further upside remains limited by the Fed’s hawkish outlook and geopolitical risks. The BOJ decision and developments in the Middle East will determine the short-term direction
Drivers:
Upside: further declines in oil prices and yields, de-escalation of the conflict, softer U.S. data, dovish BOJ.
Downside: escalation in the Middle East, higher oil prices, hawkish Fed stance, dollar strength
Resistance levels: 4,402, 4,435, 4,495
Support levels: 4,340, 4,253, 4,200
Gold is forming a countertrend correction amid dollar stagnation. A short squeeze of the 4,400–4,435 resistance zone — with the key focus on two triggers — could trigger a decline toward the key support levels. The formation of reversal patterns after the retest could provide a potential entry opportunity
Best regards,
R. Linda!  Short
Short
XAUUSDHello Traders! 👋
What are your thoughts on Gold?
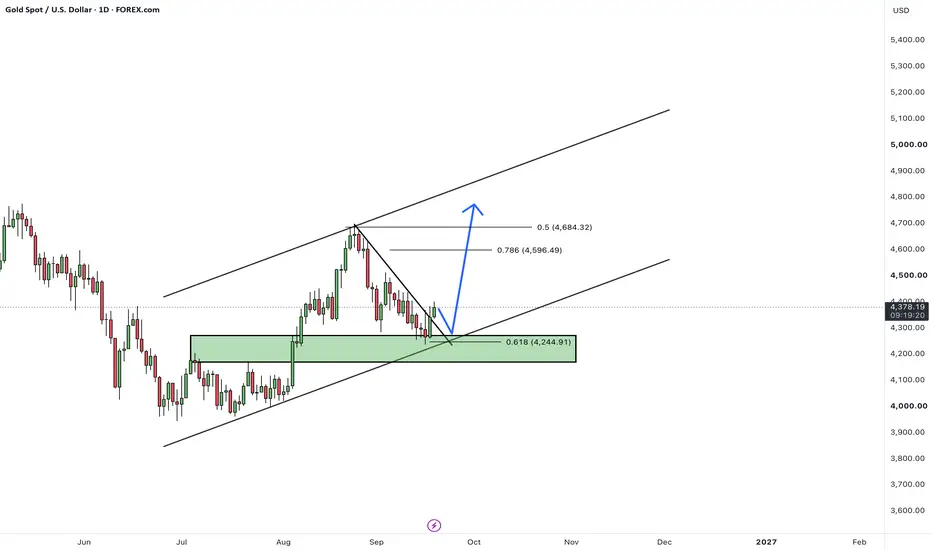
Gold was recently rejected from the upper boundary of the ascending channel and the key $4,700 resistance zone, triggering a corrective move lower.
The correction pushed price toward the lower boundary of the ascending channel, where it also reached the important $4,200–$4,250 support zone. Price found support in this area and buyers managed to regain control. The 0.618 Fibonacci retracement around $4,245 also overlaps with this zone, adding further technical significance to the support.
Following this reaction, Gold has now successfully broken above the short-term descending trendline, suggesting that the recent corrective structure is losing momentum and that the bullish structure may be gradually resuming.
From here, we expect price to spend some time consolidating and fluctuating around the current levels, followed by a potential pullback toward the broken trendline.
After that, we expect Gold to begin its next bullish leg and move toward the upper boundary of the ascending channel, provided the key support structure remains intact.
On the upside, the $4,600 area represents an intermediate resistance, while the $4,680–$4,700 zone remains the key resistance area and the previous rejection point.
As long as Gold remains above the $4,200–$4,250 support zone, the broader bullish structure remains intact and the upside scenario continues to be valid.
However, a decisive break and daily close below this support zone would weaken the current bullish structure and could expose the market to a deeper correction.
If you found this analysis helpful, please support it with a like and share your thoughts in the comments! Good luck with your trades!❤️ Long 
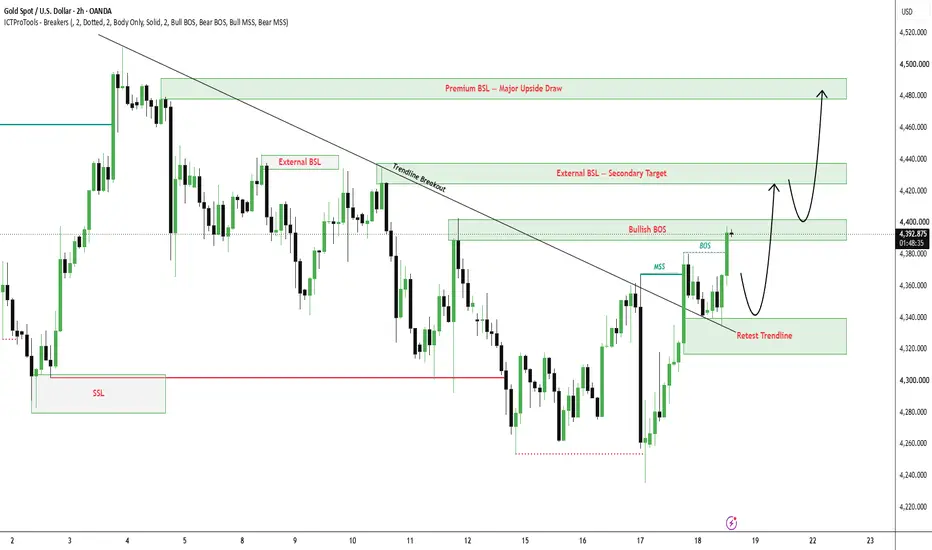
XAUUSD — Trendline Breakout, Buy the RetestGold is trading around $4,394 after extending the post-FOMC recovery and breaking above the descending H1 trendline. The latest expansion has already produced a bullish BOS, showing that short-term order flow is shifting away from the previous bearish delivery structure.
The macro backdrop has also improved for Gold in the near term. Gold rebounded more than 2% on Thursday as the U.S. dollar and Treasury yields retreated from their post-Fed highs, while easing oil prices reduced some immediate inflation pressure. The U.S. 10-year yield has since stabilized near 4.94%, and Brent has eased toward $103–104. However, the Fed’s recent 25 bp hike and its signal that further tightening remains possible still limit the strength of the broader bullish case.
SMC View
The key technical development is the breakout above the descending trendline, followed by bullish BOS around the $4,390 area.
Buy-side liquidity around the previous internal highs has already been taken, confirming displacement through the former resistance structure. The cleaner continuation setup is therefore not to chase the current expansion, but to wait for price to retrace into the broken trendline and rebalance before looking for another bullish leg.
The $4,320–$4,340 Retest Trendline zone is the main bullish POI. If this area holds and produces a bullish MSS or CHOCH, the next liquidity draw sits above current price.
Main Trading Scenario
Buy Priority: $4,320–$4,340
Condition: Wait for Gold to retrace into the broken trendline / retest zone and show clear bullish rejection. A lower-timeframe bullish MSS or CHOCH should confirm that buyers are defending the new structure.
Entry: $4,320–$4,340 after confirmation
SL: Below $4,305 and the retest structure
TP1: $4,425–$4,440
TP2: $4,478–$4,495
Key Zones to Watch
$4,390–$4,400 — Bullish BOS / current resistance
$4,425–$4,440 — External BSL / secondary target
$4,478–$4,495 — Premium BSL / major upside draw
$4,320–$4,340 — Main trendline retest POI
Below $4,305 — Immediate bullish setup weakens
Prime Gold View
The H1 structure has improved materially after the trendline breakout and bullish BOS, but price is already trading close to short-term resistance.
The higher-quality buy remains a controlled retracement into $4,320–$4,340, followed by bullish confirmation. If buyers protect that structure, Gold could continue toward $4,425–$4,440 first, with the larger $4,478–$4,495 Premium BSL remaining the main upside liquidity objective.
No confirmation, no trade. Long 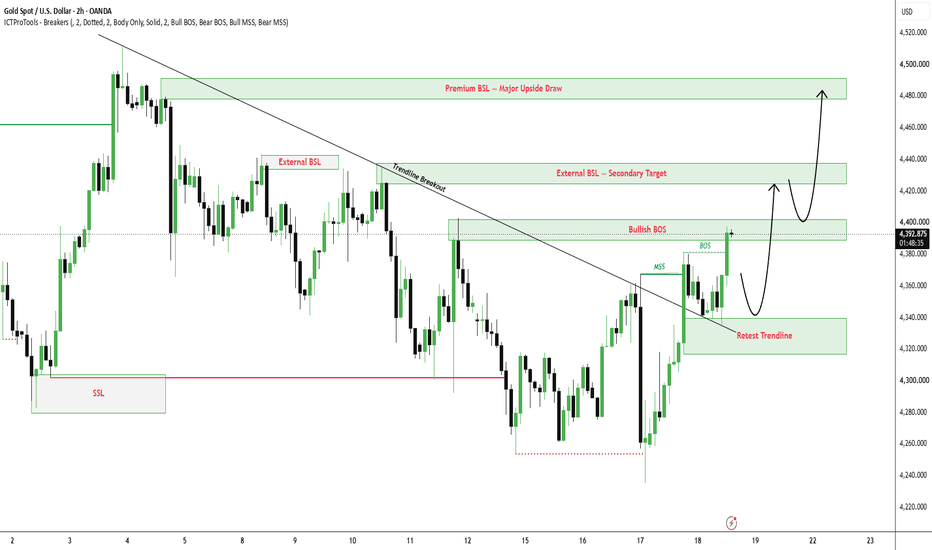
Long 
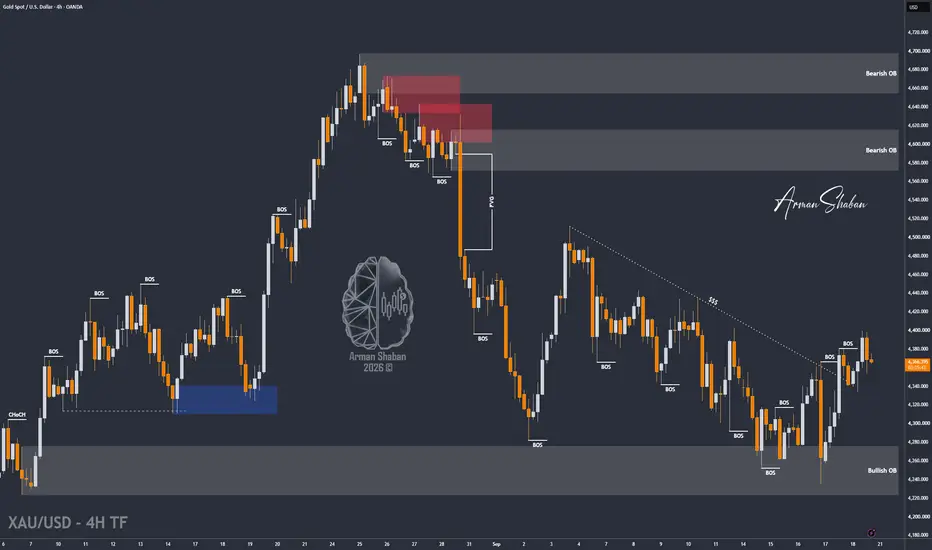
XAU/USD | Gold Hits $4399, Can Buyers Defend $4360?By analyzing the #Gold chart on the 4H timeframe, we can see that price followed our bullish scenario and rallied toward $4399 . However, after reaching the important supply zone, sellers stepped in and pushed Gold back toward $4368 .
In my view, $4360 is now the key level . If Gold manages to close a 4H candle above this level within the next four hours, I expect another bullish attempt toward $4380, $4400, $4425, $4440 and potentially $4460 .
If you've been following these Gold updates and find them useful, give this idea a Boost to support my work! 🙌
The nearest supply zones are around $4380 – $4400 , followed by $4424 – $4463 . On the downside, the important demand zones remain $4330 – $4350 , followed by $4310 – $4325 and the deeper $4224 – $4285 area.
For now, my short-term bias remains bullish as long as $4360 holds . A decisive break below this level could trigger another correction toward the lower demand zones. Long 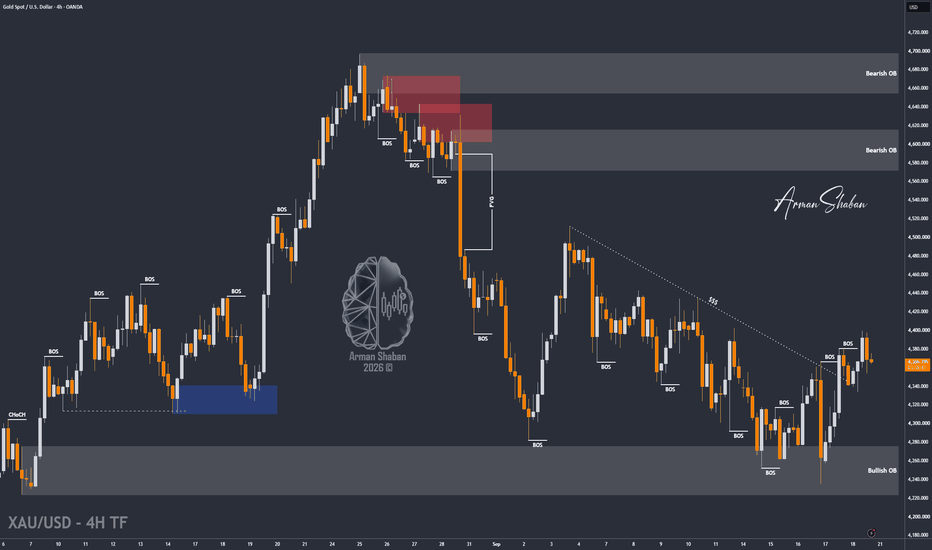
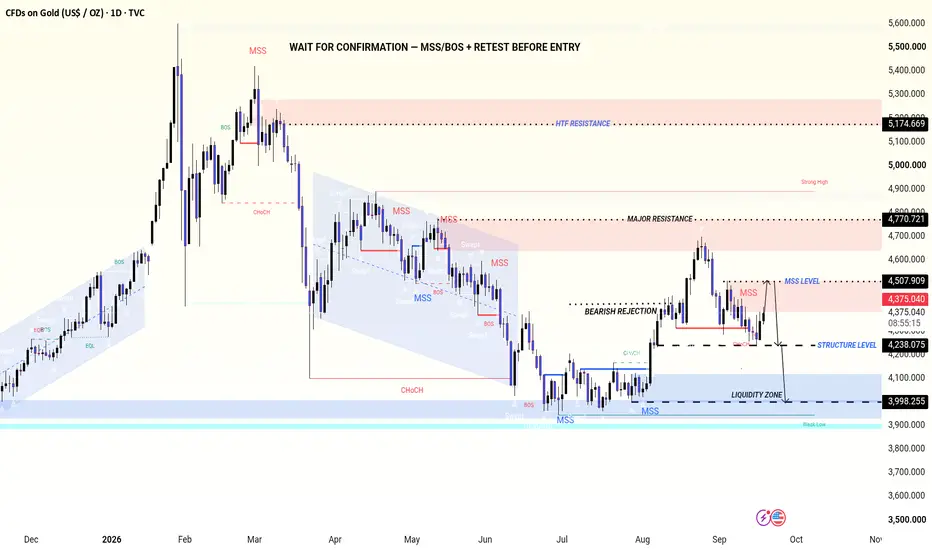
Gold 1D Outlook | MSS, BOS & Key Liquidity LevelsXAUUSD 1D — Market Structure, Liquidity & Supply/Demand Analysis
Gold is currently trading around 4,373, with the daily chart showing a clear sequence of structural shifts after the previous major decline. The analysis is based on MSS, BOS, liquidity sweeps, supply/demand zones and key support/resistance levels marked on the chart.
1. Previous Bullish Expansion
The left side of the chart shows a strong bullish phase where price continued forming higher highs and higher lows. Multiple BOS formations confirmed that buyers were maintaining control.
The strong impulsive candles indicate aggressive buying pressure rather than simple sideways movement. Each pullback was followed by another bullish expansion, keeping the structure intact.
2. Major High & Liquidity
Price eventually pushed toward the 5,400+ area, creating a major swing high. After reaching this region, bullish momentum weakened and price started producing rejection candles.
The subsequent MSS/CHoCH indicated a change in short-term structure and opened the way for a deeper correction.
3. Bearish Expansion
After the structural shift, several strong bearish candles appeared. These candles broke previous swing lows and produced multiple BOS signals.
The reason behind this phase was the failure to maintain the previous bullish structure, followed by continued selling pressure and liquidity being taken from lower levels.
4. Consolidation & Liquidity Sweeps
Around the 4,500–4,800 region, price spent considerable time moving sideways. The repeated wicks around previous highs/lows suggest liquidity was being tested on both sides.
This type of price action should not automatically be treated as a buy or sell signal. Confirmation from structure is important before interpreting the next directional move.
5. Major Demand Reaction
Price eventually moved toward the 4,000 area, where the chart marks a major demand zone.
The reaction from this zone produced a series of bullish candles and a subsequent MSS, suggesting that selling momentum was losing strength and buyers were becoming active around the marked demand.
6. August Bullish Recovery
From the demand area, Gold started creating higher lows and higher highs. The bullish candles became more consistent, eventually producing a BOS and confirming a recovery in the short-term structure.
This move continued toward the 4,500+ region, where price again encountered resistance.
7. Current Structure
The latest price action shows rejection from the 4,500–4,770 supply/resistance area. The recent candles are trading below the marked 4,507.909 level, while 4,236.998 is acting as an important structure/support level.
The current area can therefore be treated as a decision zone rather than assuming an immediate continuation.
Key Levels
4,507.909 → Key resistance / MSS area
4,236.998 → Key support / structure level
3,998.255 → Major demand / downside liquidity area
4,770.721 → Major resistance / strong-high area
5,174.669 → Higher-timeframe supply/resistance
Bullish Scenario
If price holds above 4,236.998 and produces a confirmed bullish MSS/BOS, followed by a successful retest, the recovery structure could remain valid toward the higher resistance levels.
Bearish Scenario
If price fails to hold 4,236.998 and confirms a bearish structural break, attention can shift toward the 3,998.255 demand zone.
Risk Management
This is a technical market-structure analysis, not a guaranteed signal. Avoid entering simply because price reaches a marked zone. Wait for confirmation + retest, define your invalidation level before entry, and manage position size according to your own risk plan.
Educational note: Every candle does not have one independently provable “reason”; the candle-by-candle interpretation above is based on its position within the visible structure, liquidity and supply/demand context. Short 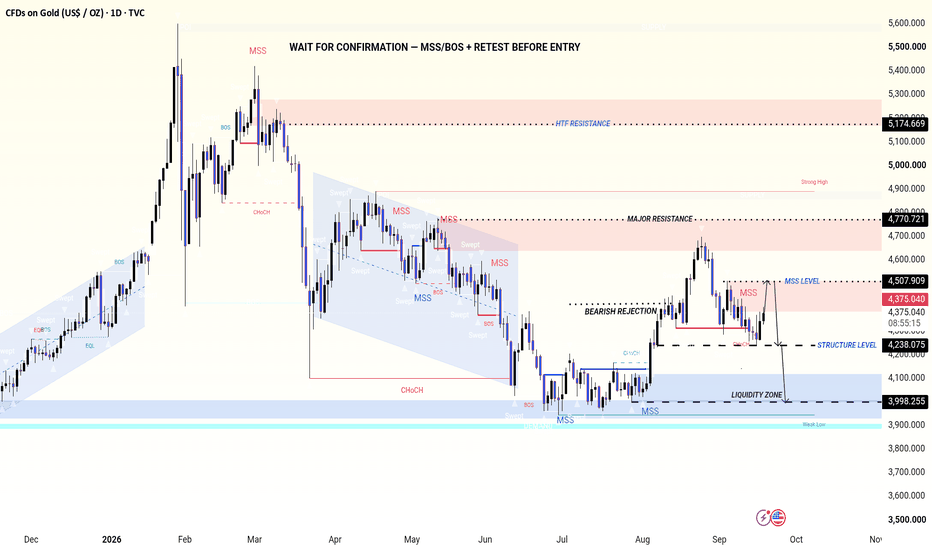
Lock In Profits — The Trading Skill Most Traders Learn Too LateA trade is running beautifully.
You got the direction right, price is moving exactly as expected, and your position is showing a solid profit. Then, a few minutes later, the market reverses — and most of that floating profit disappears.
That’s when many traders start thinking:
“I should have taken profit earlier.”
But locking in profits isn’t simply about closing a trade as soon as it turns green. It’s about protecting profits while still giving a good trade enough room to develop.
1. Profit on the Screen Isn’t Realized Profit Yet
If a position is sitting at +2R but hasn’t been closed, it is still unrealized profit. Price can pull back and take some of that profit away.
A common mistake is treating unrealized gains as if the money already belongs to you. Once price starts reversing, emotions take over and the original trading plan quickly disappears.
Don’t manage a trade based on the fear of losing profit. Manage it based on price structure.
2. Break-Even Isn’t Always “Safe”
Moving your Stop Loss to Break-even sounds perfect: if the trade fails, you lose nothing.
But move it too early and a completely normal pullback can take you out before price continues in your original direction.
Break-even makes more sense when the market gives you a technical reason — for example, price establishes a new structure, holds a breakout, or the original invalidation level is no longer necessary.
Protecting profit too early can also mean cutting winners too early.
3. Partial Profits Can Reduce Psychological Pressure
Suppose a trade reaches +2R . Instead of choosing between “close everything” and “hold everything,” a trader can take partial profits and manage the remaining position according to the plan.
This approach won’t improve every trade, and it can reduce your total profit when price continues moving strongly. But for some strategies, it can help balance realized profit with the opportunity to stay in the trend.
The important part is that your partial-profit rules should be defined before the trade , not created because you suddenly become afraid of losing your gains.
4. Your Trailing Stop Should Follow the Market, Not Your Emotions
A Trailing Stop doesn’t necessarily have to follow a fixed distance.
In an uptrend, traders can monitor Higher Lows . In a downtrend, they can watch Lower Highs . As long as the structure remains intact, the position may still have a valid reason to stay open.
When that structure changes, protecting the remaining profit has a clearer technical basis.
That’s the difference between:
“I’m closing because I’m afraid my profit will disappear.”
and
“I’m closing because the reason for staying in the trade no longer exists.”
The Real Secret Is Having an Exit Plan
Traders spend a lot of time searching for the perfect entry , but a good entry only solves the first part of the trade.
Before pressing Buy or Sell, you should already know: where your idea becomes invalid, when you can start protecting the position, whether you will take partial profits, and what would make you exit completely.
You cannot capture every dollar of every market move.
A more realistic goal is to build a process that helps you protect profits without suffocating good trades.
Entry gets you into the trade. Exit management decides how much of the move you actually keep.
This article is for educational purposes only and does not constitute financial advice. Education 
Gold Technical Analysis | Upside & Downside Liquidity TargetsXAUUSD 4H — Market Structure, Retest & Liquidity Analysis
Gold is trading around 4,377 on the 4H chart. The current structure shows a period of consolidation after the previous bullish expansion, with price now approaching a key retest/resistance area around 4,402–4,450. The chart also highlights potential upside and downside liquidity targets.
🔹 1. Initial Bullish Expansion
The left side of the chart shows a strong sequence of bullish candles. Price consistently formed higher highs and higher lows, indicating that buyers were controlling the short-term structure.
The BMS marked on the chart confirms a structural shift, while subsequent bullish candles continued the expansion. Pullbacks were relatively shallow, showing that buyers were willing to defend previous levels.
🔹 2. Momentum Toward the Highs
As price moved toward the 4,600–4,700 region, several consecutive bullish candles pushed the market higher.
The reason for this move, from a price-action perspective, was the continuation of the bullish structure and successful breaks of previous swing highs. However, after reaching the upper area, momentum began to weaken.
🔹 3. Bearish Structure Shift
Near the late-August high, price started producing smaller candles and repeated rejection wicks. This indicated that bullish momentum was losing strength.
The following strong bearish candles broke important swing levels, creating a CHoCH/BMS-type structural shift. This was followed by further downside movement as sellers gained control.
🔹 4. September Selling Pressure
During the next phase, bearish candles dominated several sections of the chart. Price repeatedly failed to maintain higher highs and started creating lower highs.
The reason for these declines was the continued bearish structure combined with rejection from higher levels. Every failed attempt to reclaim the previous resistance allowed sellers to push price toward lower liquidity.
🔹 5. Mid-Range Consolidation
Around the 4,300–4,450 region, price entered a more compressed range. Candles became smaller and alternated between bullish and bearish closes.
This indicates a temporary balance between buyers and sellers. The BMS visible around this region suggests that short-term structure was attempting to shift, but confirmation remains important.
🔹 6. Current Price Action
The latest candles show price recovering from the lower area and moving back toward 4,400+.
However, price is approaching the marked RETEST BEFORE ENTRY region. This means the area should be treated as a confirmation zone rather than an automatic entry point.
A strong rejection could indicate renewed selling pressure, while a confirmed breakout followed by a successful retest could change the short-term structure.
🎯 Important Levels
4,402–4,450 → Key resistance / retest area
4,444.92 → Upper range
4,234.68 → Lower range
4,318–4,345 → Nearby support/liquidity area
4,103.49 → Downside liquidity target
4,682–4,722 → Potential upside target region
📈 Bullish Scenario
If price breaks and closes above the 4,402–4,450 resistance area, then holds the level on a retest, the next upside liquidity/target area marked on the chart becomes relevant.
Confirmation through BMS/CHoCH + retest would provide stronger technical evidence than entering on the initial breakout candle.
📉 Bearish Scenario
If price rejects the resistance/retest area and breaks below the nearby support structure, downside liquidity could become the focus.
A sustained move below the lower range would increase attention toward the 4,103 area shown on the chart.
Risk Management
This analysis represents technical scenarios based on the displayed 4H structure. It is not a guaranteed signal. Avoid entering solely because price touches a level; wait for confirmation, define invalidation beforehand, and use appropriate position sizing.
Educational approach: individual candles do not have a guaranteed single “reason.” Their interpretation comes from their close, wick, surrounding structure, liquidity and location within the trend. GOLD Price Update – Clean & Clear ExplanationGold has recovered strongly from the 4,295–4,300 support zone and is now testing the 4,400–4,430 supply/resistance area this zone can attract profit-taking and selling pressure after the recent recovery.
Although Gold has recovered as U.S. yields and oil prices eased, the market remains sensitive to USD strength and Treasury yields. If yields or the dollar move higher again, Gold could face renewed downside pressure.
Technically Price fails to break and hold above 4,400–4,430, a bearish rejection could develop, opening the way toward 4,342 and potentially 4,300 a deeper retracement could revisit the lower support structure on the other hand, a strong breakout above 4,430, followed by a sustained hold, would weaken the rejection scenario and keep the upside structure in focus toward 4,452.
Overall structure: Gold remains in a short-term recovery phase, but the 4,400–4,430 zone is the key decision area. Watch the candle reaction and market structure around this zone before considering the next directional move.
your support means a lot! If you found this analysis useful, leave a Like and tell me your thoughts in the comments. Best of luck with your trading journey! 🚀 Short 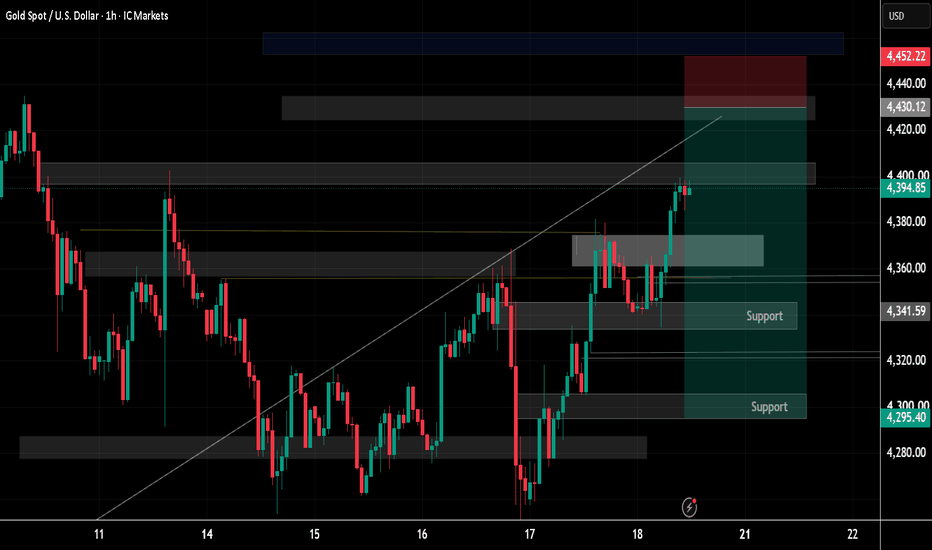
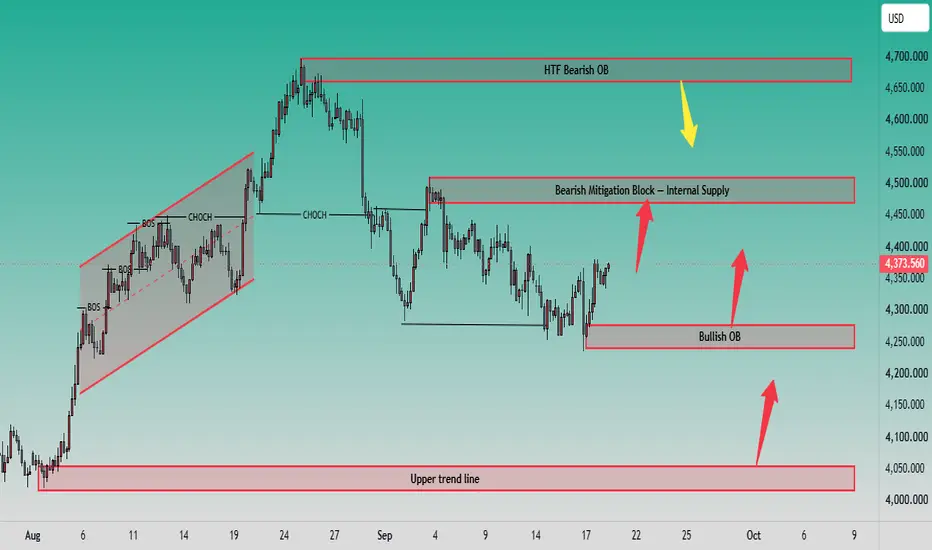
XAUUSD — 4,500 Is the Real Test XAUUSD — 4,500 Is the Real Test
Gold is trying to recover, but this is not the type of chart where I want to get emotional too early.
After the strong selloff from the late-August high, price broke the clean bullish structure and started building a wider bearish correction. That bigger damage is still there. But now gold is holding around the 4,350 area, and more importantly, price closed back above the 100-day SMA zone near 4,320. That tells me buyers are not fully gone yet.
The macro side also supports this pause. USD is trading more quietly as oil prices and US Treasury yields ease, while RSI on the daily chart is sitting in a more neutral zone. In simple words, sellers still have the bigger structure, but they are not pushing with the same strength right now.
From an SMC view, the current recovery looks like a move from the bullish OB / demand area around 4,250 - 4,290. As long as price holds above 4,320 - 4,330, I think gold can continue climbing toward the internal supply and bearish mitigation block around 4,460 - 4,500.
But here is the trap: a push into 4,480 - 4,500 does not automatically mean gold is bullish again. That area is exactly where sellers may try to reload. It is also close to the previous broken structure, so late buyers can easily get caught if price rejects there.
My main view is short-term bullish recovery while gold holds above 4,320, but I will treat 4,460 - 4,500 as the real decision zone. If buyers reclaim that area cleanly, gold can open a wider recovery toward 4,600 - 4,635. But if price rejects from there, the market may rotate back down toward 4,300 and possibly 4,250 again.
Key Price Zones to Watch
Current reaction area: 4,350 - 4,365
Main support / 100-day SMA area: 4,320 - 4,330
Bullish OB / demand zone: 4,250 - 4,290
Internal supply / bearish mitigation block: 4,460 - 4,500
HTF bearish OB: 4,630 - 4,690
Major downside support: 4,030 - 4,060
Bullish confirmation: clean reclaim above 4,500
Bearish rejection signal: failure around 4,460 - 4,500
Invalidation for recovery: clean break and hold below 4,320
Do you think gold can reclaim 4,500, or is this recovery only setting up another sell reaction from supply?
Long 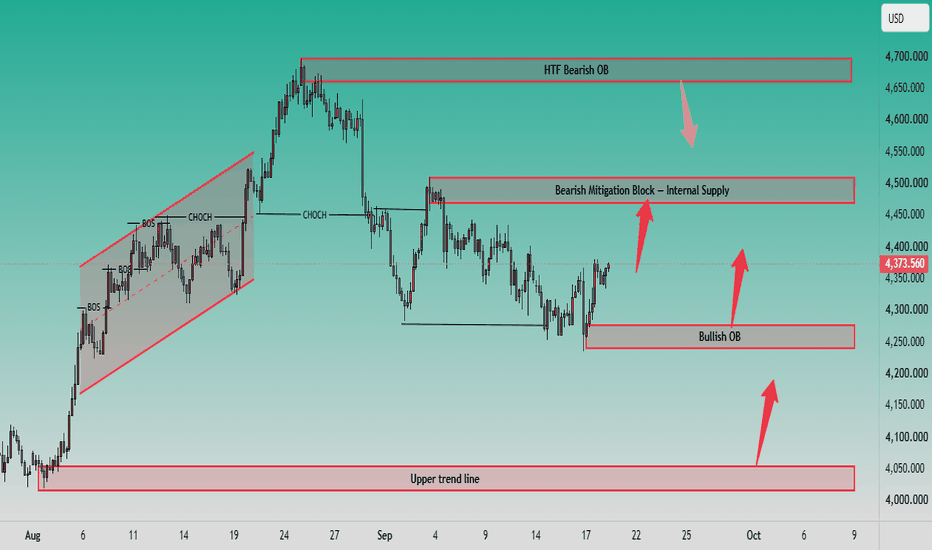
 Short
Short
XAUUSD — 4,370 Retest Before 4,406?
Gold is trading around 4,386 after extending the M30 recovery above the rising trendline.
The short-term structure remains constructive, but price is now approaching an important resistance area.
The simple read
4,370 is the key breakout support.
If buyers defend this zone, Gold may continue toward 4,398–4,406.
A clean break above 4,406 could open the way toward the upper resistance around 4,437.
If 4,370 fails, the deeper structure support around 4,331 becomes the next important reaction area.
Key price zones
4,370 — breakout support
4,331 — key structure support
4,398–4,406 — major resistance
4,437 — upper resistance target
The M30 recovery is still healthy while price holds above the rising trendline.
But resistance is close.
Do not chase the candle.
Wait for the pullback.
Wait for reaction.
Can 4,370 hold and send Gold through 4,406? Long 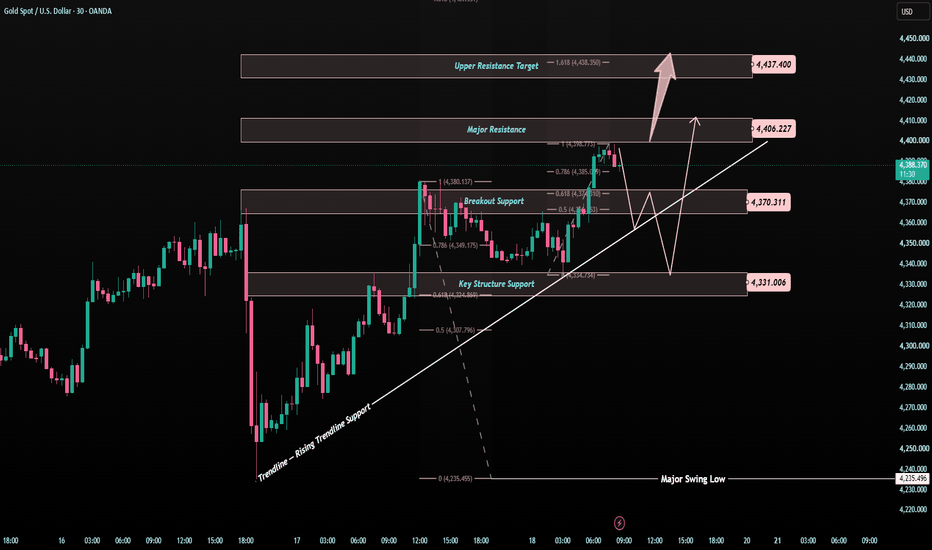
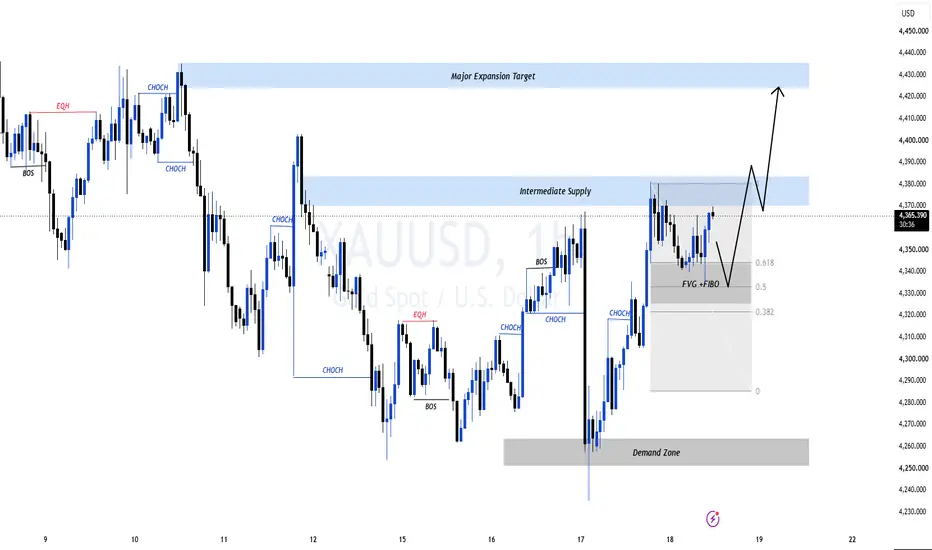
Gold 1H: Buy 4,335 or Break 4,385?
• Macro Driver: Spot Gold consolidates near $4,357 on Friday, September 18, 2026, preserving gains following an aggressive post-FOMC short squeeze earlier in the week. With US Treasury yields leveling off and the US Dollar Index (DXY) consolidating as the Fed delivered an expected status quo policy rate, global traders are actively digesting fresh macro catalysts—including today's preliminary Michigan Consumer Sentiment data—to gauge consumer inflation expectations for Q4.
• Market Condition: Institutional order flow shows an active re-accumulation cycle. Following the major sell-side liquidity sweep at the 4,235 – 4,260 Demand Zone, smart money initiated a massive displacement wave that generated multiple Bullish CHoCH and BOS breaks. The current intraday correction represents a calculated pullback into internal discount imbalance arrays to fuel the next leg up.
Technical Context
• Structure: Institutional Bullish Expansion / OTE Retest. On the 1H timeframe, Gold executed an impulsive V-shaped recovery off the 4,235 floor, breaching prior swing highs up to 4,380 before stalling at the Intermediate Supply Block.
• Liquidity & Imbalance: Price is currently printing an orderly corrective retracement from 4,380 (current market price: 4,357.245). The technical projection anticipates a downward drift into the confluent FVG + FIBO 0.5–0.618 discount mitigation zone (4,332.000 – 4,345.000). A confirmed absorption here is positioned to drive a breakout through the Intermediate Supply block (4,368.000 – 4,385.000) and expand aggressively toward the Upper Macro Supply Ceiling (4,420.000 – 4,435.000).
Key Zones
• Macro Upper Supply Ceiling (Target Blue Box): 4,420.000 – 4,435.000
• Intermediate Supply Block (Middle Blue Box): 4,368.000 – 4,385.000
• Immediate Market Price: 4,357.245
• Confluent FVG + FIBO 0.5–0.618 Retest Zone (Grey Box): 4,332.000 – 4,345.000
• Structural Fib 0.382 Base: 4,322.000
• Major Demand Zone Floor (Bottom Grey Box): 4,240.000 – 4,265.000
Trading Plan (IF–THEN)
• IF price completes the corrective pullback into the 4,332.000 – 4,345.000 FVG + Fibo 0.5–0.618 confluence block AND validates lower-timeframe (M5/M15) bullish rejection displacement/CHoCH -> THEN look to execute Long positions, targeting 4,380 and expanding directly toward the 4,420.000 – 4,435.000 Upper Macro Supply Ceiling.
• IF price delivers a decisive 1H candle close below 4,320 -> THEN the bullish continuation setup is delayed, exposing a deeper retest toward the 4,285 discount level.
MMFLOW View
• Bias: Pro-Trend Bullish Retest. Chasing greens directly inside the 4,370–4,380 intermediate supply block carries poor risk-to-reward; the institutional mathematical edge favors waiting for confirmed demand mitigation inside the FVG + Fibo 0.5–0.618 discount array before riding the expansion wave.
Are you looking to buy the 4,335 FVG mitigation, or waiting for a clean 1H breakout above 4,385? Long 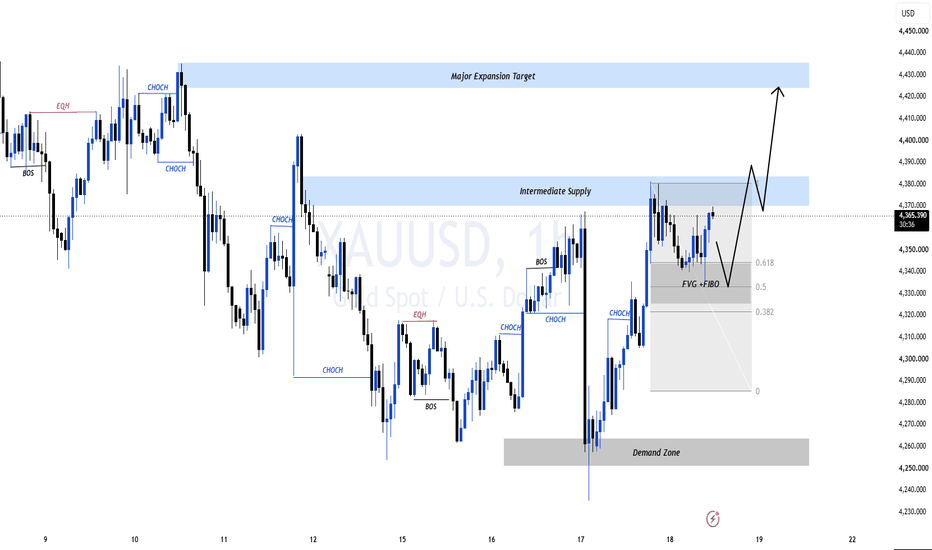
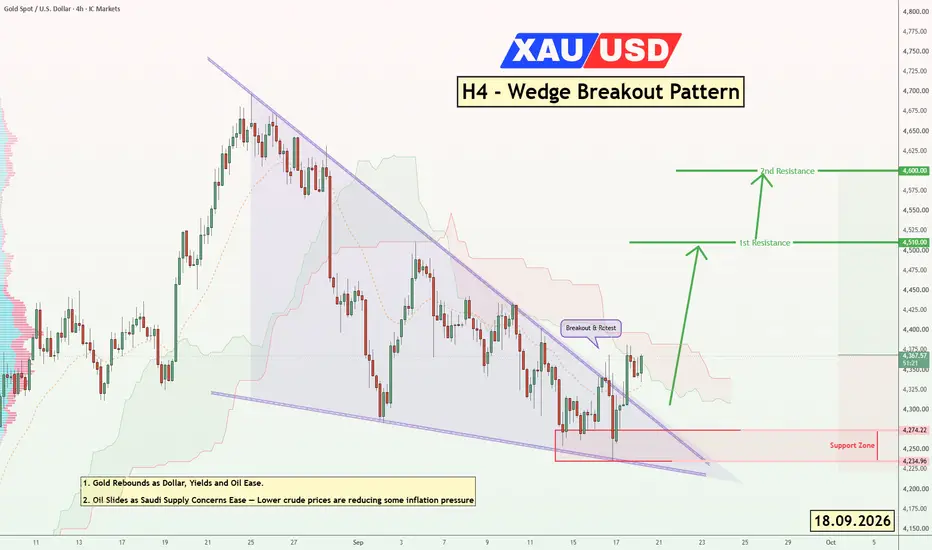
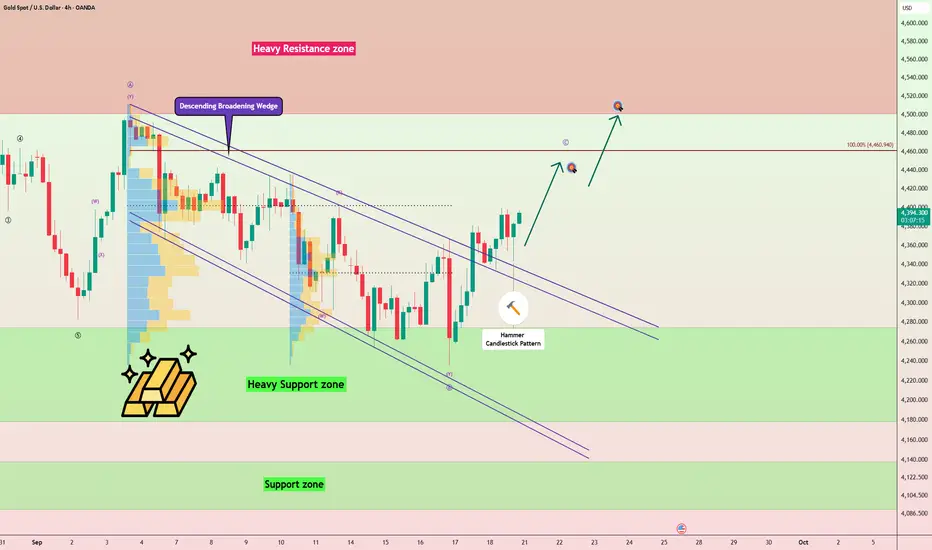
Gold Breaks the Broadening Wedge — Is $4,500 Next?Gold ( OANDA:XAUUSD ) has successfully broken above the upper trendline of the Descending Broadening Wedge Pattern and is currently trading above the pattern.
This breakout could signal the beginning of another bullish move during the final trading hours of the week and potentially into next week.
Can gold confirm the breakout above $4,400 and extend its rally toward $4,487?
Technical Analysis
The breakout above the Descending Broadening Wedge suggests that bearish pressure may be weakening and buyers are attempting to regain control.
However, the key trading level of $4,400 remains important for confirming stronger bullish momentum.
💡 Educational Note: A breakout above a Descending Broadening Wedge can signal a bullish reversal, especially when price successfully holds above the broken upper trendline.
I expect gold to gain stronger bullish momentum after breaking above $4,400 and rise at least toward $4,443.
If bullish momentum increases, the move could extend toward $4,487.
Trade Setup
First Take Profit(TP): $4,443
Second Take Profit(TP): $4,487
Stop Loss(SL): $4,321(Worst)
Key Trading Levels: $4,330 _ $4,400
Which level do you think gold will reach first?
🟢 $4,487
🔴 $4,321
📌 Gold Analysis(XAUUSD), 4-hour time frame.
🛑 Always use proper risk management and set a Stop Loss(SL) for every position.
🚀 If this analysis helps your trading plan, a BOOST would help more traders discover it. Long 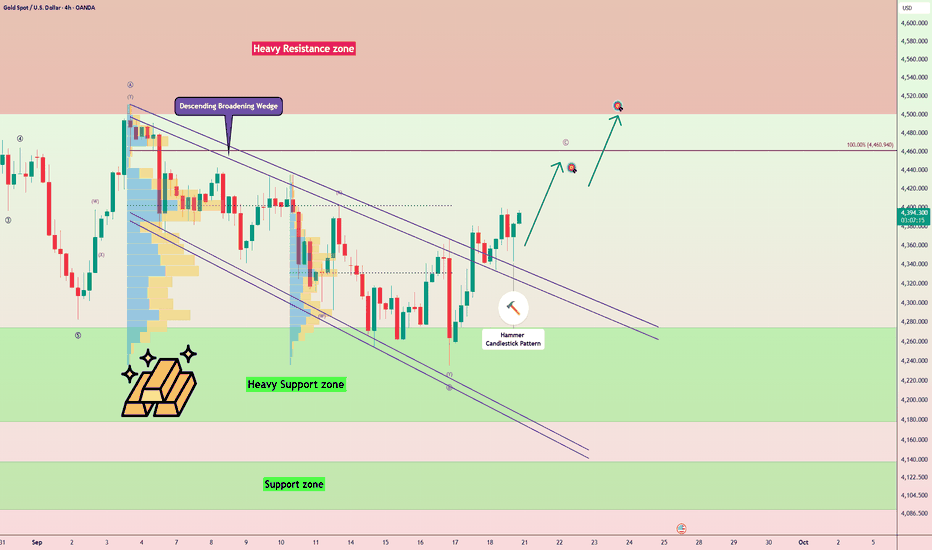
Short 
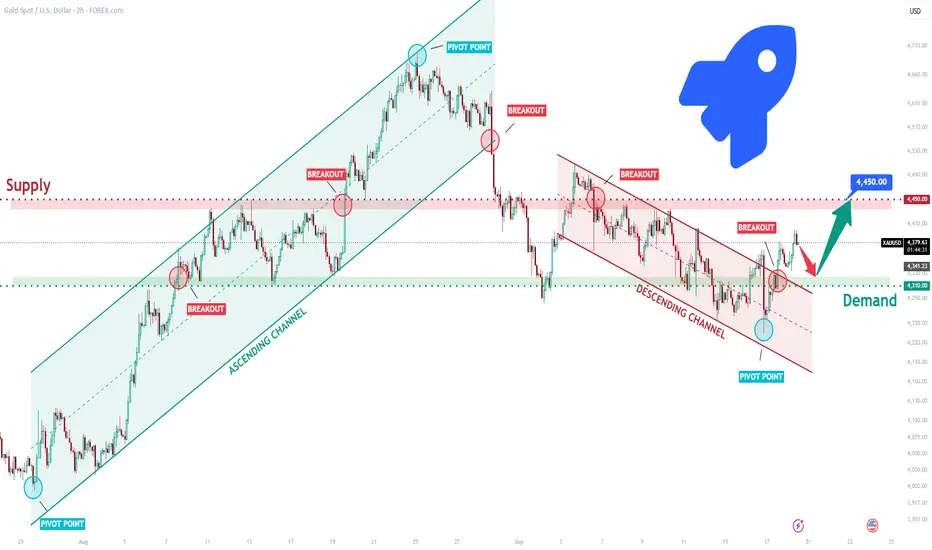
XAUUSD Long: Channel Breakout Could Drive Price Higher To 4,450$Hello traders! Here’s my technical outlook based on the current XAUUSD (2H) chart structure. XAUUSD previously traded inside an ascending channel before breaking higher and later forming a descending channel. Price then tested the Supply Zone near 4,450, where sellers rejected the upside before pulling back toward demand.
Currently, XAUUSD is trading below the 4,450 Supply Zone while holding above the 4,310 Demand Zone. The recent bounce from support suggests buyers are preparing for another move higher.
As long as XAUUSD remains above 4,310 and respects the current support structure, the bullish scenario remains valid. A continuation higher could target 4,450 (TP1). However, a break below 4,310 would weaken the bullish outlook. Manage your risk! Long 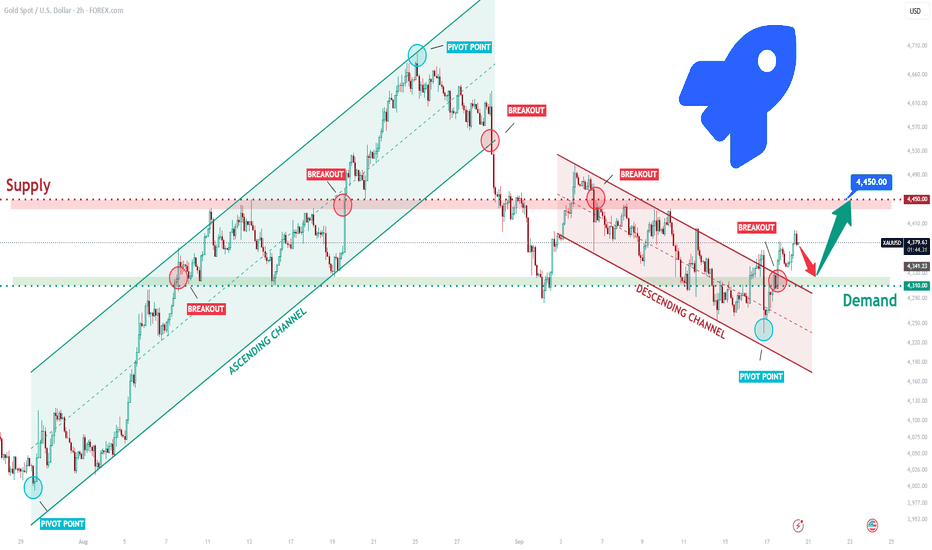
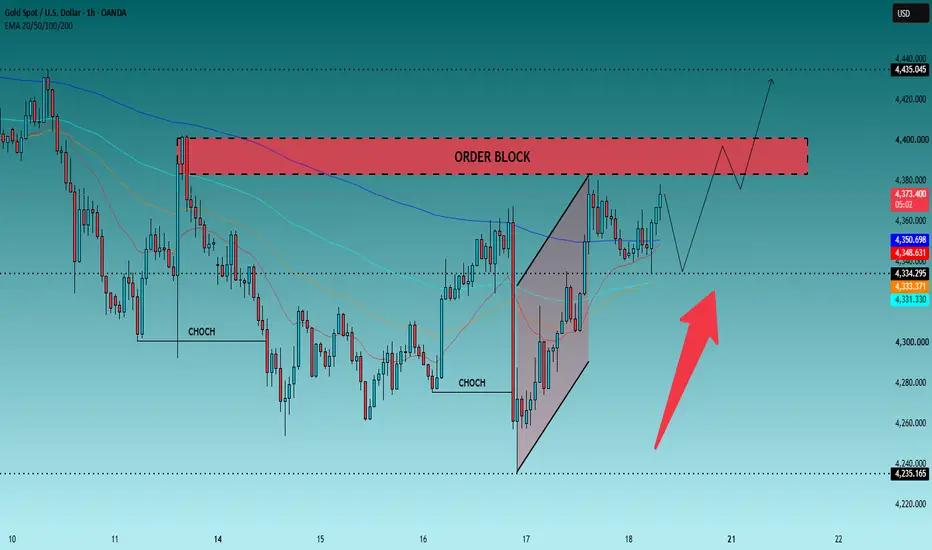
XAUUSD H1: Gold Is Knocking on the Door Sellers Must DefendGold has already answered one important question from yesterday.
Buyers did not disappear.
The recovery from the 4,260 area has now pushed price back toward 4,375, and the H1 chart looks considerably healthier than it did during the previous sell-off.
But there is a problem.
Gold has recovered directly into the place where sellers should be waiting.
The red zone around 4,380–4,400 is an H1 Order Block, and price is now standing just underneath it.
So today I am not interested in asking:
“Is Gold bullish or bearish?”
I think there is a better question:
What happens when Gold actually knocks on 4,400?
Because the answer could decide whether this recovery becomes a real continuation — or another expensive trap for late buyers.
Right now, buyers have momentum. They do not have permission.
Look at what has changed since the low near 4,260.
Gold recovered aggressively, broke away from the lower structure and is now trading above the cluster of short-term moving averages around 4,331–4,351.
That is constructive.
It tells me the H1 market is no longer behaving like sellers have complete freedom.
But price is approximately 4,374 as I write this.
That means buying immediately would mean buying almost directly into 4,380–4,400 supply.
I do not like that location.
The market has already travelled.
The easy part of the rebound is behind us.
Now buyers have to prove they can do something more difficult:
turn supply into support.
The trade I want most is not at 4,374
If Gold pushes into 4,380–4,400, breaks through it and gives us an H1 close above 4,400, I would not chase that breakout candle.
I would wait.
I want to see price come back toward the broken zone.
If 4,385–4,400 holds on the retest, the Order Block has failed to do its job.
That is my signal that buyers have earned access to the next section of the chart.
BUY — THE DOOR OPENS
Trigger: H1 close above 4,400 + successful retest
Entry: 4,390–4,400
SL: 4,372
TP1: 4,420
TP2: 4,435
TP3: 4,460
TP4: 4,480
This setup is intentionally late.
I am paying a higher price in exchange for confirmation.
And there is one target that deserves special attention:
4,435.
That level sits near the next major reference on the chart. If Gold reaches it after converting 4,400 into support, the H1 recovery will have done much more than simply bounce from 4,260.
It will have broken through the area sellers were supposed to protect.
But buyers have another route
A breakout is not the only way I would consider buying Gold today.
In fact, I would be interested if price moves in the opposite direction first.
The H1 moving averages are gathering around 4,331–4,351, while the chart also shows an important horizontal reference around 4,334.
That creates a potential reload area.
Imagine Gold gets rejected from the Order Block.
Price falls.
Late buyers panic.
Then Gold reaches approximately 4,335–4,350 and refuses to continue lower.
That would get my attention.
I specifically want to see price trade into this area and then produce an H1 recovery back above 4,350.
If that happens:
BUY — LET THE MARKET COME BACK TO US
Entry: 4,345–4,352 after H1 recovery above 4,350
SL: 4,325
TP1: 4,375
TP2: 4,390
TP3: 4,400
TP4: 4,435
This is very different from blindly placing a buy order at an EMA.
The zone is only the location.
The recovery is the trigger.
That distinction matters, especially for newer traders.
Now give the sellers their turn
The red Order Block is on the chart for a reason.
If sellers still control this area, 4,380–4,400 is where they should show it.
So I will also watch for a false breakout.
Gold can trade above 4,380.
It can even briefly approach 4,400.
That alone does not invalidate the sellers.
What matters is where the H1 candle finishes.
If price trades into 4,385–4,400 but an H1 candle closes back below approximately 4,378, I have evidence that buyers entered the room and were immediately pushed back out.
That gives me a completely different trade.
SELL — THE DOOR SLAMS SHUT
Entry: 4,375–4,382 after rejection is confirmed
SL: 4,405
TP1: 4,350
TP2: 4,334
TP3: 4,310
TP4: 4,280
I would not sell simply because price touches the red rectangle.
I want the rejection first.
Otherwise, I could be selling directly into a breakout.
4,334 is where today's story can turn ugly
There is another scenario that deserves attention.
Suppose Gold rejects 4,400, falls through the EMA cluster and produces an H1 close below 4,330.
At that point, something important has changed.
The moving averages are no longer acting as a platform.
The recent bullish recovery has lost its immediate support.
I would then wait for a rebound toward 4,330–4,340.
If that rebound cannot reclaim the area, I would look lower.
SELL — THE RECOVERY LOSES ITS ENGINE
Entry: 4,330–4,338 after bearish retest
SL: 4,355
TP1: 4,305
TP2: 4,280
TP3: 4,260
TP4: 4,235
Notice that 4,235 is not my first target.
There are several places where buyers could react before Gold ever reaches it.
That is why the position is managed through intermediate targets rather than assuming price will travel straight down.
There is one area where I would do absolutely nothing
Roughly 4,355–4,375.
That may sound strange because this is close to where Gold is trading now.
But that is exactly the point.
From here, price is too close to resistance for me to love a BUY, while sellers have not yet produced the rejection I need for a SELL.
There is nothing wrong with having no trade in the middle.
Sometimes the chart becomes much clearer after travelling another $20.
4,400 can confirm the breakout.
4,380–4,400 can produce the rejection.
4,335–4,350 can offer the pullback.
Those locations give me information.
The middle gives me temptation.
So, who has the advantage?
At this moment, I give buyers a short-term advantage because Gold has recovered from 4,260 and is holding above its H1 EMA cluster.
But buyers are approaching their examination.
The Order Block around 4,380–4,400 is the exam paper.
A rejection sends Gold back toward 4,350 and 4,334.
A loss of 4,330 puts 4,305, 4,280 and 4,260 back into play.
But an H1 breakout above 4,400, followed by a successful retest, changes the conversation completely.
Then I am looking toward 4,420, 4,435 and potentially 4,460–4,480.
So I am not choosing BUY or SELL before Gold reaches the decision area.
I am letting 4,400 choose for me.
If Gold reaches 4,400 today, what happens first: rejection or breakout? Long 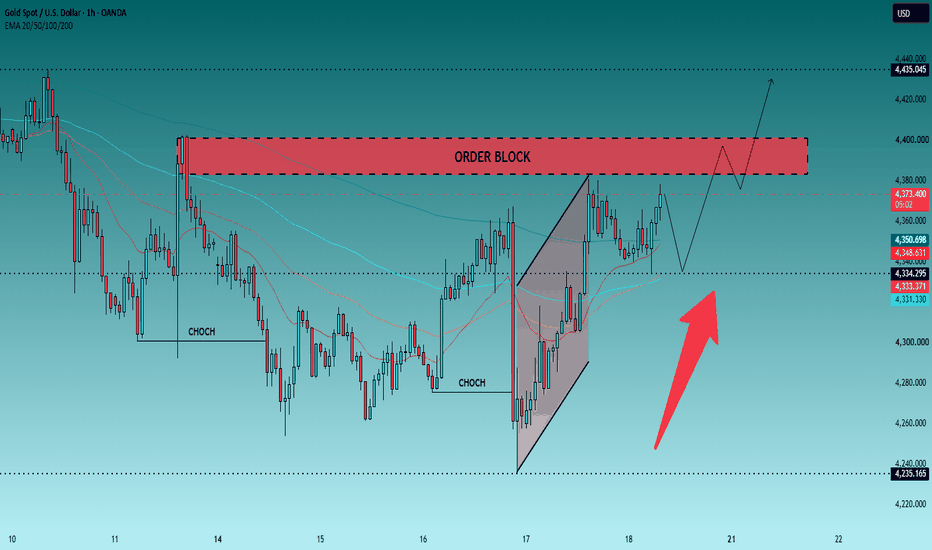
 Long
Long
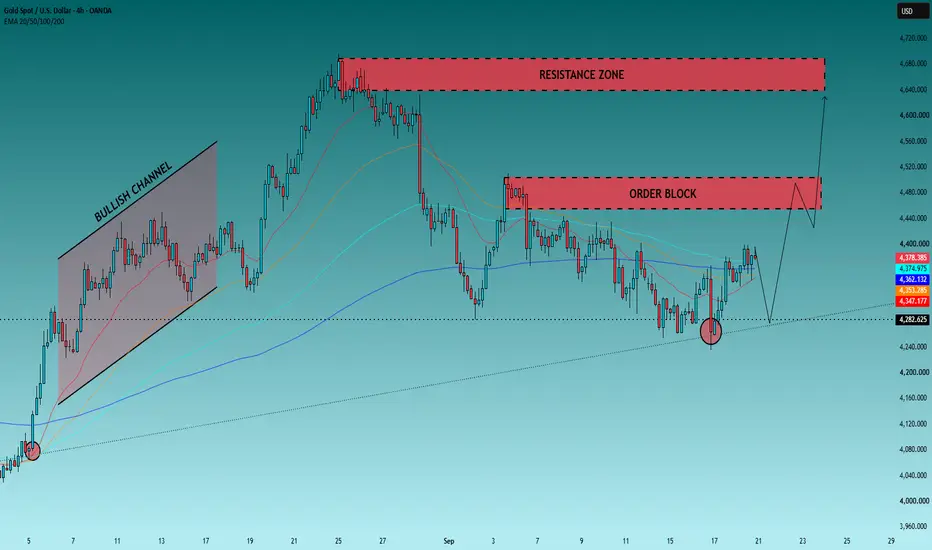
XAUUSD: The 4,282 Floor Could Decide Gold’s Next Big MoveGold is doing something interesting on this chart.
It is not breaking out.
It is not collapsing either.
Instead, price is rebuilding above a level that has already proved important — 4,282.
And that gives us a much cleaner way to trade the next move.
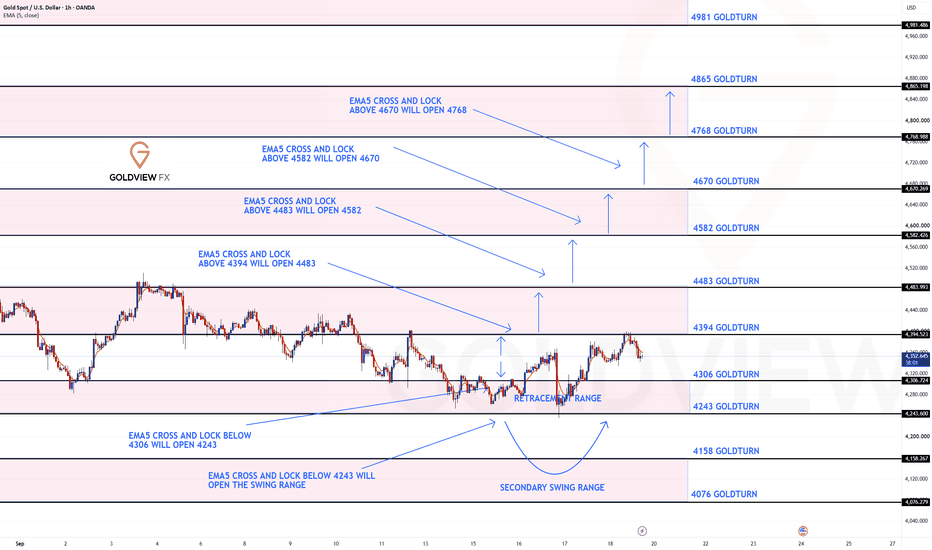
Forget trying to predict whether the next candle will be green or red. There are three doors on this chart:
4,282 → Survival
4,450–4,500 → Permission
4,630–4,680 → Destination
The trade depends on which door Gold opens first.
4,282 Is More Important Than It Looks
Look at the reaction around the recent low.
Gold pushed below the 4,282 area, tested the rising trendline and immediately recovered. Buyers did not simply defend the level — they forced price back toward the EMA cluster.
Price is now trading around 4,378, above the EMA 20/50/100/200 cluster shown on the chart.
That is constructive.
But I would not call Gold fully bullish yet.
Why?
Because buyers have recovered the middle of the battlefield, but they have not defeated the sellers waiting above.
The real problem starts around 4,450.
The Trap Is Between 4,400 and 4,450
This is where I think many traders could get caught.
A move above 4,400 will look bullish enough to attract breakout buyers.
But the major H4 Order Block sits roughly around 4,450–4,500.
That means buying blindly at 4,400 gives you very little information about whether Gold can actually break the important supply.
I want confirmation, not excitement.
BUY Scenario #1 — Buy the Pullback
I will consider a BUY if Gold pulls back toward 4,340–4,360, holds that area and then closes back above 4,380.
Entry: 4,375–4,385
SL: 4,335
TP1: 4,420
TP2: 4,455
TP3: 4,490
The idea is simple: the EMA cluster becomes support instead of resistance, giving buyers another attempt at the Order Block.
BUY Scenario #2 — Let Sellers Lose First
This is the setup I prefer for a larger bullish move.
Gold must break the 4,450–4,500 Order Block and produce a convincing H4 close above 4,500.
Then I want the breakout area to survive a retest.
Entry: 4,485–4,505 after confirmation
SL: 4,445
TP1: 4,560
TP2: 4,630
TP3: 4,680
Above 4,500, the chart changes considerably.
The next major destination becomes the upper 4,630–4,680 resistance zone, which is also where the previous major high was formed.
SELL Scenario — One Level Changes Everything
I am not interested in selling Gold simply because it reaches resistance.
The cleaner bearish trigger is 4,282.
If price returns there and we get an H4 close below 4,282, the recent recovery has failed and the rising trendline is no longer protecting buyers.
That would invalidate my bullish recovery thesis.
Entry: 4,275–4,285 on a failed retest from below
SL: 4,320
TP1: 4,240
TP2: 4,200
TP3: 4,160
There is also a more aggressive SELL opportunity at 4,450–4,500, but only if Gold reaches the Order Block and prints a clear rejection back below 4,440.
In that case:
Entry: 4,435–4,445
SL: 4,510
TP1: 4,380
TP2: 4,330
TP3: 4,285
My Map for Gold
Right now, I give buyers a slight advantage while price remains above 4,282 and the rising trendline.
But there is an important distinction:
4,282 keeps buyers alive.
4,500 puts buyers in control.
Until 4,500 breaks, the current rise is still a recovery into supply rather than a confirmed bullish continuation.
So I am not chasing Gold around 4,380.
I would rather buy a confirmed pullback, buy after sellers lose 4,500, or switch bearish if 4,282 finally gives way.
Three doors. Three completely different trades.
Which one do you think Gold opens first — 4,282 or 4,500? Long 
Long 
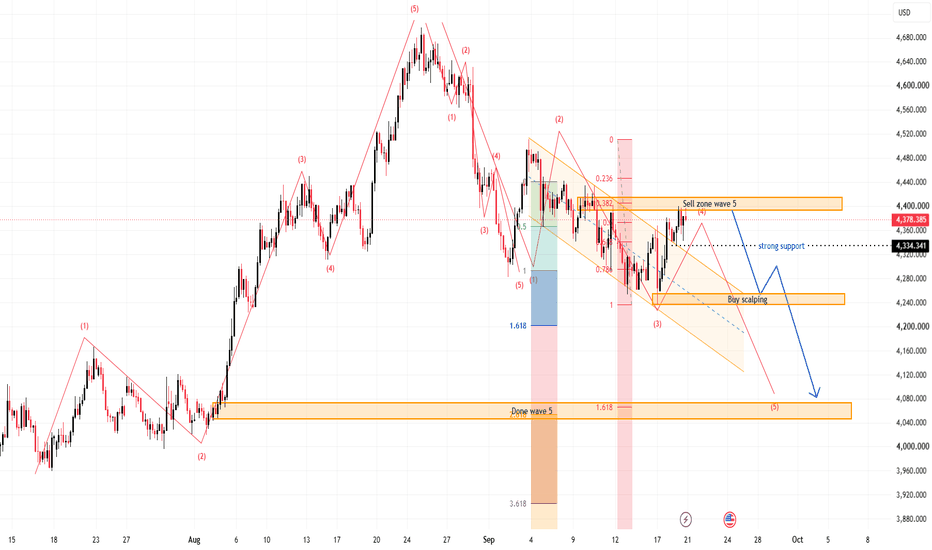
XAUUSD — Weekly Wave 5 Lower Toward 4,060
From Kelly’s view, gold enters next week inside a broader bearish corrective structure. Price is currently trading around 4,378, after recovering from the 4,240–4,250 area, but the rebound is still developing beneath a descending channel and an important sell zone around 4,390–4,410.
The key idea is simple: the current recovery may represent a corrective Wave (4), while the main weekly scenario remains a continuation lower into Wave (5) if sellers defend the upper resistance zone.
⟡ Market structure
Gold remains inside a descending structure after the major peak near 4,680. Recent rebounds have continued to form below important resistance, while the descending channel is still controlling the broader direction.
The current recovery from around 4,240 has pushed price back toward the 4,390–4,410 sell zone, where Fibonacci resistance and the projected Wave (4) completion area overlap.
For next week, 4,334 is the first important support. A clean break below this level could confirm renewed bearish momentum and expose the 4,240–4,255 area.
If that support also fails, the larger Wave (5) projection points toward the 4,045–4,075 zone.
➤ Key levels
◌ Current price area: 4,375–4,385
◌ Main sell zone: 4,390–4,410
◌ Strong resistance: 4,410–4,430
◌ Strong support: 4,334
◌ Secondary support: 4,240–4,255
◌ First target: 4,334
◌ Second target: 4,240–4,255
◌ Main target: 4,045–4,075
◌ Invalidation: Above 4,430
⌁ Elliott Wave view
Wave (1): The first bearish leg pushed price lower from the previous recovery high.
Wave (2): Gold produced a corrective rebound before sellers regained control.
Wave (3): The stronger bearish impulse extended toward the 4,240 area.
Wave (4): The current rebound may be completing near 4,390–4,410, where the descending channel and Fibonacci resistance overlap.
Wave (5): If sellers reject this zone, the final bearish leg could develop toward 4,240 first, followed by the larger 4,045–4,075 target area.
▸ Trading scenario
Preferred bearish scenario
Entry: 4,390–4,410 after bearish confirmation
Stop Loss: Above 4,430
Take Profit 1: 4,334
Take Profit 2: 4,240–4,255
Take Profit 3: 4,045–4,075
The cleaner plan is to wait for rejection from the sell zone rather than chase price lower around current levels. A bearish reaction near 4,390–4,410, followed by a break below 4,334, would strengthen the Wave (5) scenario.
Alternative scenario:
If gold breaks above 4,410–4,430 and holds above the descending structure, the bearish Wave (5) setup may be delayed and price could extend toward the next higher resistance before sellers regain control.
◌ Invalidation
The main bearish scenario would weaken if price gains sustained acceptance above 4,410, and a confirmed break above 4,430 would invalidate the preferred Wave (5) structure for next week.
⌁ Kelly’s view
Kelly’s main view remains bearish for next week while gold stays below 4,390–4,430.
The current rebound may still have room to test the sell zone, but the broader structure favors another bearish leg if sellers defend resistance. 4,334 is the first confirmation level, while 4,240–4,255 remains the next major support before the larger 4,045–4,075 Wave (5) target comes into focus.
Do you think gold will reject the 4,390–4,410 sell zone first, or break 4,334 directly next week? Short