Short
Short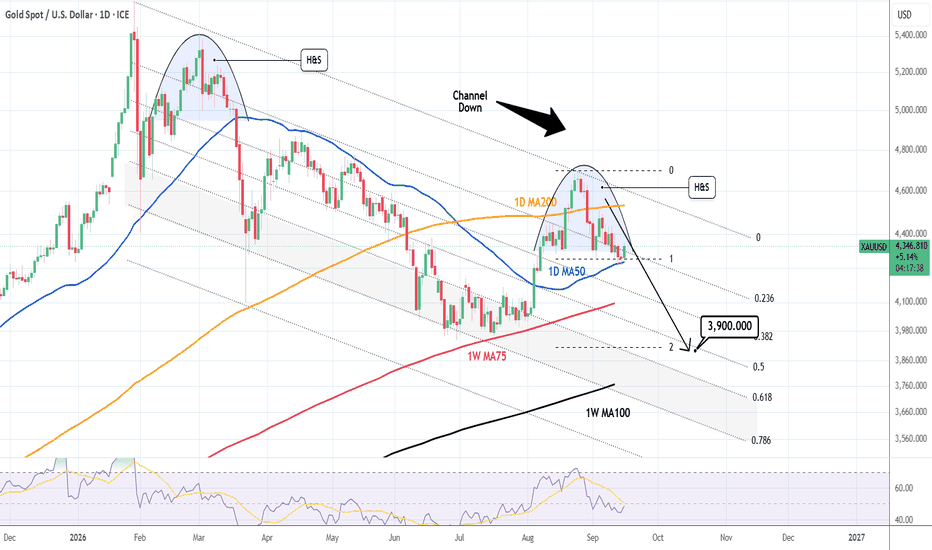
Long 
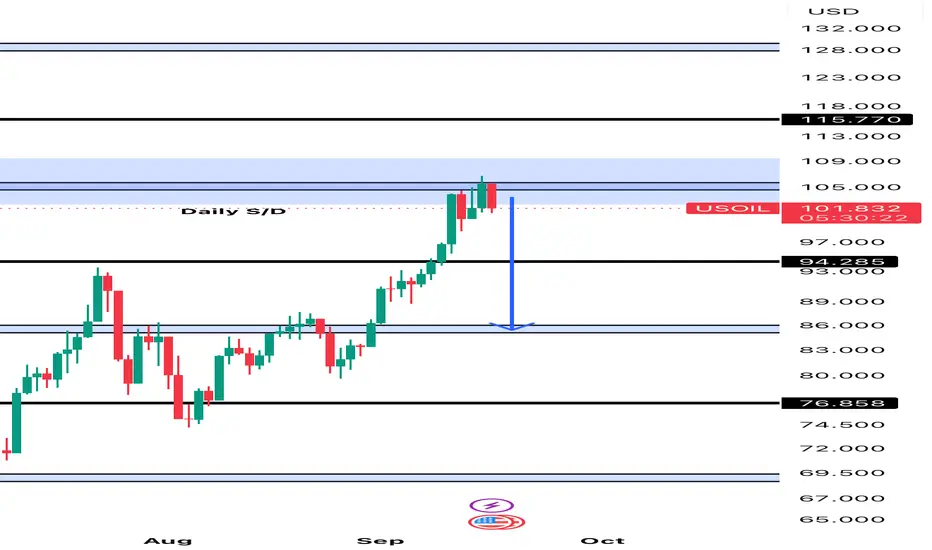
WTI Crude, What's next? Midterms ahead!Following my previous play, we see that price is now consolidating in the $101–$106 corridor.
Front-Month backwardation remains high
Remember, cash is king because cash markets cannot be bluffed.
The front-to-second month prompt spread sits at +$4.68/bbl backwardation. This means that commercial refiners and physical buyers are actively paying a ~$5 premium per barrel to secure immediate delivery.
Along with this, we can see through the EIA Weekly Petroleum Status Report that commercial inventories are at cushing levels, that means that we continue hovering near critical operational tank bottoms. Furthermore, the US Strategic Petroleum Reserve (SPR) remains depleted near ~293M barrels ( a multi-decade low ). Back in 2022, the US used the strategic reserve to absorve geopolitical shocks at the time. They discharged over 180M barrels of emergency supply and at the time it worked (debatable). The problem today is that structural dampener is gone. Thus, until the prompt spread compresses below 3$, any flat-price drop in spot crude reflects paper deleveraging rather than physical oversupply. (Why $3? According to the chart, its a historical level - if there is a real reason for that value, I'm afraid I'm not aware of it so, if you know something more, please comment below!)
Speculative headroom
Via the CFTC COT report we can see that:
- managed money sits at ~94k contracts net long, having slowly ground upward from the summer base near ~60k contracts.
- non-commercial length hovers around ~130k contracts.
Here, historical context matters. In sustained commodity bull cycles, managed money net length routinely seems to peak between 350k - 450k contracts. Thus, the implied is that there is a lot of sidelined capital waiting for clearer signals to position itself.
US Dilemma: Debt Servicing
With US 10-year yields lingering near 5.0% and 10-year real yields elevated at ~2.58% ( $TVC:US10Y-FRED:T10YIE ) , the US Treasury faces steep debt-refinancing costs. These yields will tighten global dollar liquidity and raise the bar for speculative carry trades across risk assets (specially looking at JPY).
FED operations in foreign exchange and money markets have recently shown clear strain. This adds pressure to the US debt markets, driving yields higher and keeping the USD buoyant.
Midterms
Due to midterms, we oughta look at oil from a game theory perspective as well.
The White House wants to deflate gas prices (the one you pay at the pump). Facing immense midterm pressure, high retail gasoline prices represent an existential political vulnerability. Trump ratings are falling heavily therefore, for him, it's pure survival at this time. The Dems have came forth more than once stating that if they win, they'll both remove trump from power and pursue legal actions against him - possibly landing him in jail. So, the rational move for the administration is to manufacture headline "paper relief" events ahead of the midterms. Such as floating diplomatic breakthroughs with Iran or jawboning the Fed into doing its bidding.
Tehran, on the other hand, recognizes Washington’s political sensitivity to $100+ oil as we've been at this point multiple times this year. Their dominant play is to sustain asymmetric tension around maritime both chokepoints ensuring war-risk tanker insurance remains elevated.
FED Independence
The broader macro risk is the perceived loss of Federal Reserve autonomy as the US heads into midterms.
With US 10-year yields pressing near 5.0%, annual interest on federal debt is rapidly becoming the single largest non-discretionary fiscal burden. Treasury Secretary Scott Bessent’s expanded use of debt buybacks and bilateral FX maneuvers highlights growing official sensitivity to borrowing costs. Meanwhile, Chair Kevin Warsh faces the mandate of re-anchoring 2% inflation while front-month energy spikes. The executive branch is openly pushing for rate relief ahead of elections. The line for so long separated Treasury debt management from independent monetary policy is starting to erode.
If the Fed blinks and halts hikes or signals premature easing to cushion the political cycle while oil sits at current levels, the bond market will revolt.
I think that if this is the case, then inflation expectations and term premiums will expand aggressively.
The long end of the curve (10Y/30Y) will steepen sharply, tightening financial conditions regardless of what the Fed funds rate target displays.
And currency markets experience liquidity strain as foreign reserve managers (such as Japan) are forced to sell treasuries to defend their own currencies against the dollar, compounding US debt supply pressures.
It's not the end of the USD but it's clearly a realignment, a painful one.
So, after all that, what can we do? I see essentially three scenarios.
Important : Avoid the 100-106 range as it presents positive dealer gamma. (That's related to options, no need to bother much on why, but its part of the reason as to why large wicks show here and there.)
Idea 1
- Headline-driven diplomatic or regulatory rumors trigger selloff but prompt backwardation ( $NYMEX:CL1!-NYMEX:CL2! ) holds firm above 3$
- Execution Area: Re-entry long between 94 – 96 upon a 4H bullish reversal print
- Invalidation: Confirmed daily close below 88.50 (prior multi-month breakout)
- Take Profits: TP1: 112 || TP2: 120
Idea 2
- Real maritime disruptions stall talks (if they start), and cracks through 110 call wall (it'll trigger short-gamma dealer covering)
- Execution Area: Confirmed daily close above 108.50 with $NYMEX:CL1!-NYMEX:CL2! widening past 5$
- Invalidation: Daily close back below 103
- Take Profits: TP1: 112 || TP2: 120
Idea 3
- True de-escalation leads ahead of midterms forces price under 100, forcing dealers to flip ( aggressively sell futures into negative gamma)
- Execution Area: 4H close below 99.5 alongside $NYMEX:CL1!-NYMEX:CL2! compressing below 3$
- Invalidation: 4H reclaim above 102.5
- Take Profits: TP1: 95 (Put Wall) || TP2: 91.5
Note: you can see options walls in aggregators such as Barchart
I'll update the article in the upcoming days. Short 
Order Blocks in SMC: How Institutions Leave Their Footprint
Order Blocks are one of the most important concepts within Smart Money Concepts (SMC), helping traders identify areas where significant buying or selling activity may have occurred before a strong displacement. A Bullish Order Block is generally identified around the last bearish candle or bearish price area before a strong upward move, while a Bearish Order Block is commonly identified around the last bullish candle or bullish price area before a strong downward move. The objective is not simply to mark every opposite-colored candle, but to focus on zones that are supported by meaningful market structure and displacement.
A more structured approach is to first determine the higher-timeframe market direction, then locate a relevant Order Block within a key area, and finally move to a lower timeframe for confirmation. When price returns to the zone, traders may look for confirmation such as a liquidity sweep, BOS/CHOCH, rejection, displacement, or Fair Value Gap (FVG) before considering an entry. Stop-loss placement can be structured beyond the invalidation point of the Order Block, while targets can be based on opposing liquidity, previous highs/lows, or other significant market-structure levels.
The key lesson is that an Order Block should not be treated as an automatic entry signal. Its relevance depends on context, timeframe alignment, liquidity, displacement, and how price reacts when revisiting the zone. Combining these elements can create a more systematic SMC framework and help traders avoid entering simply because price touched a marked rectangle. Education 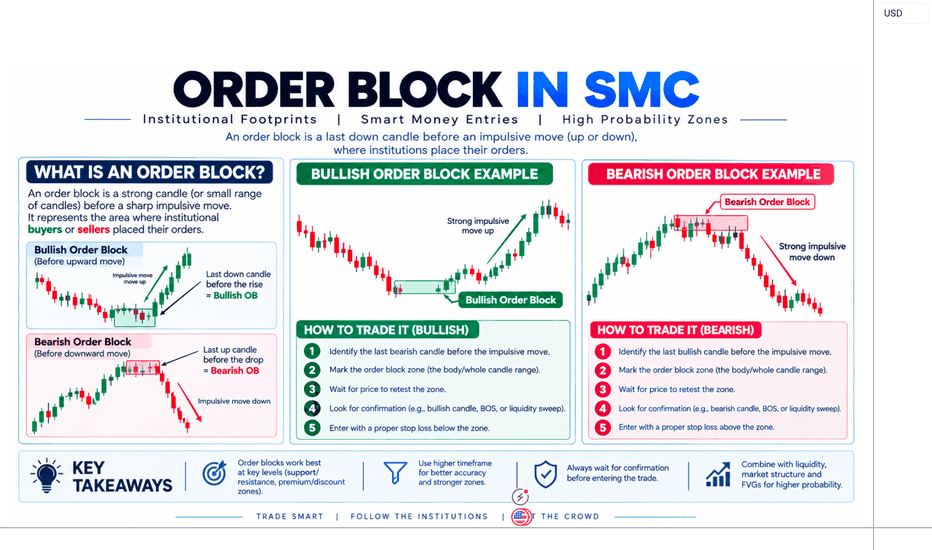
 Short
Short
 Long
Long
Don't fight the market!Gold Price Analysis: Gold prices fluctuated and corrected yesterday, falling back to a low of 4253, under pressure in the 4350-55 range. Although there was a rebound, prices were again resisted near 4318. From the daily chart, the price has been below the moving average band since last week, and the moving average band is showing a downward divergence, all indicating a weak gold price. Yesterday's break below 4300 and the previous low of 4280 further suggests that there is room for further decline in the short term. However, whether the bears can gain momentum remains to be seen. The key factor remains whether the Federal Reserve raises interest rates on Thursday. If the Fed raises rates as expected, gold may fall again, potentially initiating a medium- to long-term downtrend. The downside could be as low as 4200 or 4100 in the short term, or as high as 4000-3900 in the long term. However, if the Fed doesn't raise rates, gold is unlikely to see a strong rally. Multiple moving averages will continue to provide significant resistance, and even hawkish comments from the Fed could reignite market expectations of further rate hikes. Therefore, both technically and fundamentally, the bears have the upper hand in the gold market. The short-term H4 chart still shows a weak pattern, and gold is likely to see a slight pullback today. Considering the hourly chart, gold is expected to trade in a slightly weak range today. The upside resistance is around 4320, the recent high. The main resistance level to watch is the 5-day moving average around 4330-40, which is also the upper limit of the hourly chart's range. As long as gold doesn't break above the 5-day moving average today, the overall trend will remain weak. On the downside, watch the lower limit of the hourly chart's range around 4265-60, which is also yesterday's low. Short 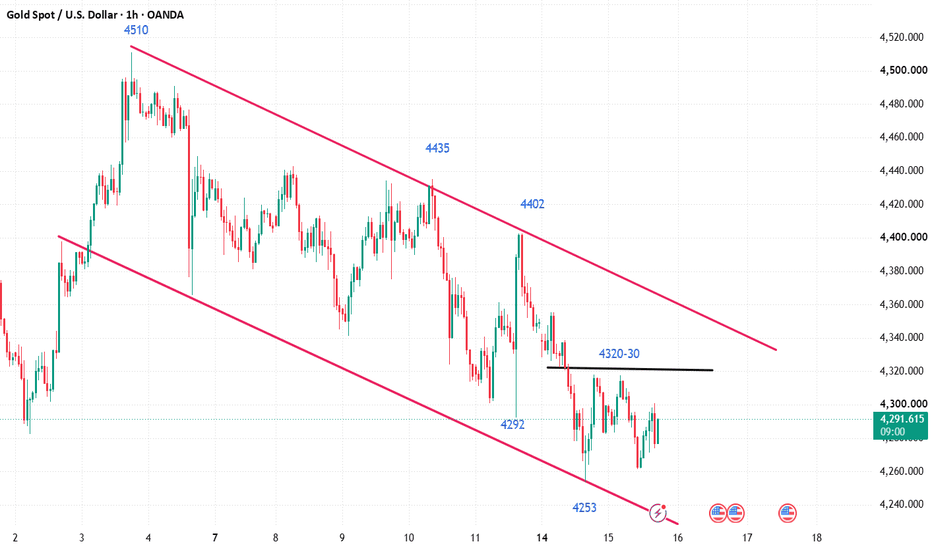
Short 
Trading Craft 101 · Lesson 05 — The Journal🔵 THE UNUSED EDGE
Most traders collect setups, not data. They can tell you the pattern they trade, but not their own win rate, average R, or biggest losing streak. Their edge exists — and they have no idea what it is. The journal is the tool that fixes that.
🔵 WHAT TO RECORD
Every trade: the setup (which pattern, which timeframe), entry and exit, the R-multiple, the reason in one sentence, the emotions in one word (calm, greedy, bored, revenge). The emotions column matters more than it looks — it is the only column that predicts the next mistake.
🔵 THE WEEKLY REVIEW
Once a week, answer three questions from the journal, not from memory: which setup made money, which one lost, and which trade violated the plan? The third question is the gold: plan violations are the only losses you control. Process errors are the leak; the journal finds it.
🔵 THE NUMBERS THAT MATTER
Track three numbers over rolling samples: win rate, average R per trade, and max losing streak. Win rate alone lies — 40% win rate at +2R average is a great system. The combination is the truth, and it only exists in the journal.
Next lesson: psychology — why discipline is not a personality trait but a system.
Educational content only. Not investment advice. Education 
XAU/USD Bullish Breakout | Buy Zone 4,341, Target 4,410 in FocusXAU/USD 15-Minute Analysis
Bias: BULLISH 📈
Trend: Bullish — price is making higher highs and higher lows above the rising trendline.
Market structure: A strong market breakout was followed by consolidation inside the range box, then bullish continuation.
Buy zone: 4,341.340 — marked as the key buy-entry area.
Stop Loss: 4,316.053 — below the recent structure/support.
Target: 4,410.615 — major resistance/sell zone.
Resistance: 4,400–4,411 is the key target/supply area.
Risk: ~25.29 points.
Potential reward: ~69.28 points.
Risk/Reward: approximately 1:2.74.
Trade idea
BUY above/around 4,341.340 if bullish structure remains intact. A sustained move toward 4,400–4,411 would complete the setup. A break below 4,316.053 invalidates the bullish idea. Long 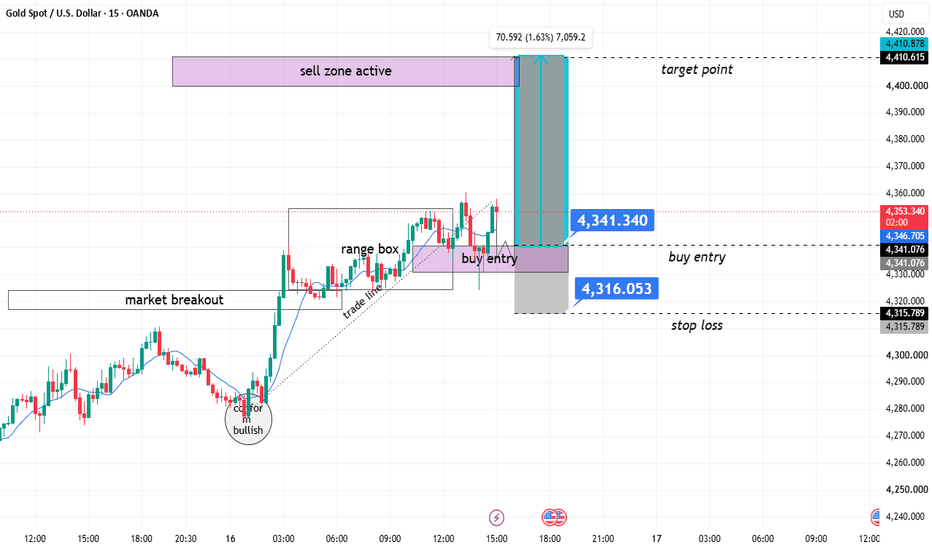
Long 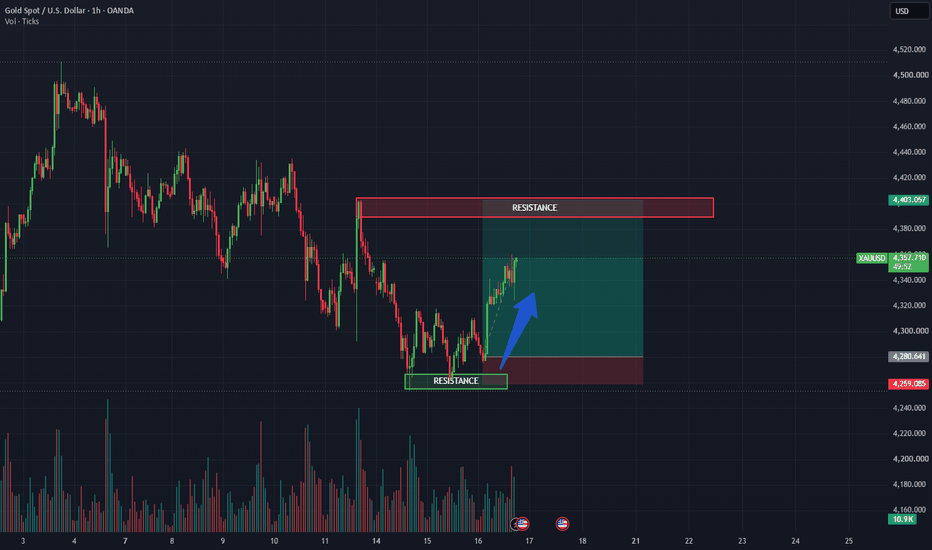
XAU/USD Bullish Channel Setup | Buy Zone 4,270 & Target 4,325XAU/USD 15-Minute Analysis — Bullish Setup 🟢
Trend: Bullish — price is moving inside an ascending channel.
Current price: ~4,284.9
Buy zone / Entry: 4,270.6 — wait for price to retrace into this zone and show bullish confirmation.
Stop Loss: 4,250.0
Target: 4,324.9
Resistance: 4,315–4,325 sell/resistance zone.
Liquidity: Sell-side liquidity appears below the recent lows around 4,270–4,275; a sweep followed by a bullish reversal would strengthen the setup.
Structure: Price is pulling back toward the lower boundary of the rising channel. Holding this area can support another move toward the upper channel/resistance.
Trade Plan
BUY: 4,270.6 zone
SL: 4,250.0
TP: 4,324.9
Bias: BULLISH — but avoid chasing at the current price; the chart's planned entry is lower around 4,270.6. Long 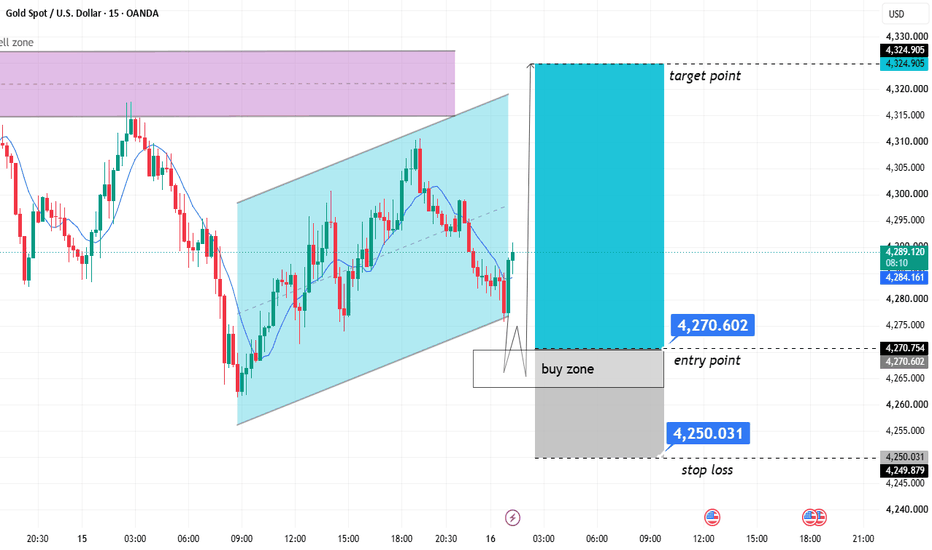
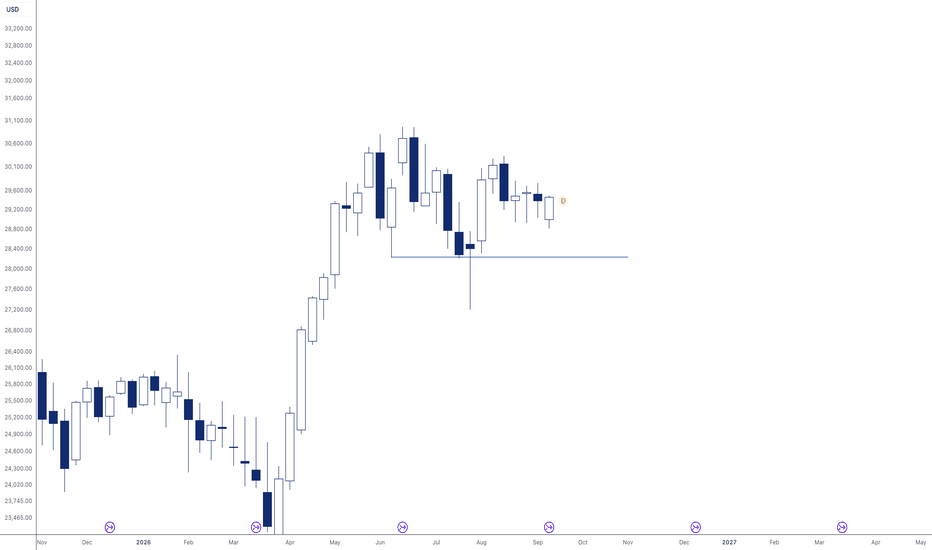
WTI Crude Oil — XTIUSD | Weekly Structure & Liquidity Map▪️ My read: Crude is mid-impulse, not mid-reversal. XTI ran off the July base at 71.90–74.30 and has repriced roughly 30 pts higher into the low-100s, now coiled at 103.19 in a tight consolidation directly beneath a clean overhead corridor. There is no graded supply between spot and the ★★ Bear Liquidity Cluster at 116.98–117.27 — the lone overhead pool on the board — which makes that zone the natural draw. Demand below is stacked and heavy: two POWER 10/10 bull clusters anchor the floor. Thin above, loaded below.
▪️ Below, the standout structure is the ★★★★ 8.1/10 VERY STRONG SUPPORT at 86.00 to 88.00 — 14 retests, sitting directly under the POWER 10/10 bull cluster and forming the primary reversal-long. Base case: while 98.00 holds, favor the trend-aligned push through the 104.59/107.26 pivots up into the 116.98–117.27 cluster — treat the first tag as a liquidity run, not a confirmed breakout, unless price reclaims and holds above 117.27. Lose 98.00 and the book inverts down toward the 86–90 confluence for the reaction long, with the 71.90–74.30 macro base as the deeper magnet. The Fed and the weekly EIA print are the wildcards that decide which side runs. Edges pay, the middle chops.
▪️ XTIUSD is trading near 103.19, up off the ~72 July low and mid-continuation after tagging ~108 and rotating back to the 101.94/104 pivot band. Price is coiled just under the 104.59 pivot with 107.26 and 110.15 as the next waypoints, and no graded supply until the Bear Liquidity Cluster at 116.98 to 117.27 — the single overhead pool. Below, the floor is loaded: a –2.9/10 FORMING SUPPORT · 2 retests around 98.00 to 100.00 is the first shelf, then a ★ 4.3/10 WEAK SUPPORT · 2 retests near 92.00 to 94.00 with the 95.66 pivot just above, a Bull Liquidity Cluster at 88.00 to 90.30 overlapping a ★★★★ 8.1/10 VERY STRONG SUPPORT · 14 retests at 86.00 to 88.00, a ★★★ 7.9/10 STRONG SUPPORT · 46 retests at 80.00 to 81.50, and a POWER 10/10 · 28.98% bull cluster at 71.90 to 74.30 overlapping a ★★★ 7.3/10 STRONG SUPPORT · 71 retests. Supply above is thin, demand below is heavier.
▪️ Primary outlook: ride the continuation, buy the deep demand on a flush. The yellow paths run price up through the 104.59/107.26 pivots toward the 116.98–117.27 cluster and, on strength, into fresh discovery above — the trend-aligned leg into the lone overhead pool to run stops. The red paths are the corrective leg: reject the cluster or lose 98.00, print a lower high, and roll down into the 86.00–90.30 confluence where the high-value long sits, with 95.66 as the first waypoint. Lose 86.00 and the 80.00–81.50 shelf then the 71.90–74.30 macro base become the magnets.
🔴 CEILING · overhead supply and sell-side liquidity ▪️ 104.59 to 107.26 · continuation pivot band · immediate overhead, price coiled just under it · roughly +1 to +4 pts ▪️ 110.15 · interim waypoint · clean-air continuation marker · roughly +7 pts ▪️ 116.98 to 117.27 · Bear Liquidity Cluster · the only overhead pool and key bull-flip line · roughly +13.8 to +14.1 pts
🟢 FLOOR · demand and buy-side liquidity ▪️ 98.00 to 100.00 · –2.9/10 FORMING SUPPORT · 2 retests · first shelf, low conviction · roughly -3 to -5 pts ▪️ 92.00 to 94.00 · ★ 4.3/10 WEAK SUPPORT · 2 retests · secondary shelf, 95.66 pivot just above · roughly -9 to -11 pts ▪️ 88.00 to 90.30 · Bull Liquidity Cluster overlapping ★★★★ 8.1/10 VERY STRONG SUPPORT · 14 retests at 86.00 to 88.00 · primary reversal-long, nearest high-value demand · roughly -13 to -17 pts ▪️ 80.00 to 81.50 · ★★★ 7.9/10 STRONG SUPPORT · 46 retests · heavily validated structural floor · roughly -22 to -23 pts ▪️ 71.90 to 74.30 · Bull Liquidity Cluster overlapping ★★★ 7.3/10 STRONG SUPPORT · 71 retests · deepest floor and range base · roughly -29 to -31 pts
▪️ ORDER FLOW / ZONE MAP ▪️ Overhead: 104.59/107.26 pivot band → 110.15 waypoint → Bear Cluster 7/10 at 116.98 to 117.27. The corridor is clean air with no graded supply until the cluster; that is the single overhead level a continuation is drawn to and the line a bull discovery has to clear and hold. ▪️ Below: –2.9/10 forming at 98.00 to 100.00 → 4.3/10 weak at 92.00 to 94.00 → Bull Cluster POWER 10/10 plus 8.1/10 VERY STRONG at 86.00 to 90.30 → 7.9/10 STRONG at 80.00 to 81.50 → Bull Cluster POWER 10/10 · 28.98% plus 7.3/10 STRONG at 71.90 to 74.30. The demand stack is the heaviest structure on the board — two POWER 10/10 clusters and three graded supports cushioning every dip.
🔍 SCENARIO PATH ▪️ Continuation / liquidity draw (dominant while 98.00 holds): push through the 104.59/107.26 pivots up into the 116.98–117.27 cluster to run stops — treat the first tag as a liquidity grab, not a breakout, unless reclaimed and held. ▪️ Rejection: reject the cluster, print a lower high, roll back down. ▪️ Down rotation: drive into the 86.00–90.30 confluence where the primary long fires, with 95.66 as the mid waypoint. ▪️ Bounce / reversal: lift off 86.00–90.30 back toward the 104.59 pivot band and the cluster. ▪️ Deeper flush if 86.00 fails: the 7.9/10 STRONG at 80.00 to 81.50 becomes the magnet, then the POWER 10/10 cluster plus 7.3/10 STRONG at 71.90 to 74.30 as the last floor. ▪️ Bull continuation / discovery: a clean reclaim and hold above the Bear Cluster at 117.27 negates the range and reopens fresh highs.
⚠️ MACRO CATALYST · FOMC + EIA this week ▪️ Two-sided risk into mid-week. The weekly EIA Petroleum Status Report is the direct supply-side driver — a larger-than-expected crude build pressures the tape toward the red rotation into 86–90; a draw supports the yellow extension into 117. Layered on top, the FOMC decision transmits through the dollar and demand channel: a hawkish outcome and firmer USD is a headwind for dollar-denominated crude and reinforces the downside; a dovish surprise supports risk appetite and the reach into the cluster. OPEC+ supply-policy headlines and any shift in the geopolitical risk premium remain the tails that override structure intraday. Expect erratic spikes into and just after the prints — the reaction, not the headline, sets the next leg. Size down and let the level confirm before committing.
🔒 Levels and paths from the zone model. No signals, no repaint, a scenario, not a promise. Not financial advice — the Fed and EIA prints can override any technical level in seconds.
▪️ ProjectSyndicate Levels Desk · weekly S/R and liquidity zones for metals, energies, FX, XAUUSD, GBPUSD, NVDA, NQ, ES, GC and WTI. Subscribe to stay up to date.
#WTI #CrudeOil #XTIUSD #Oil #Commodities #OOTT #EIA #FOMC Long 
Long 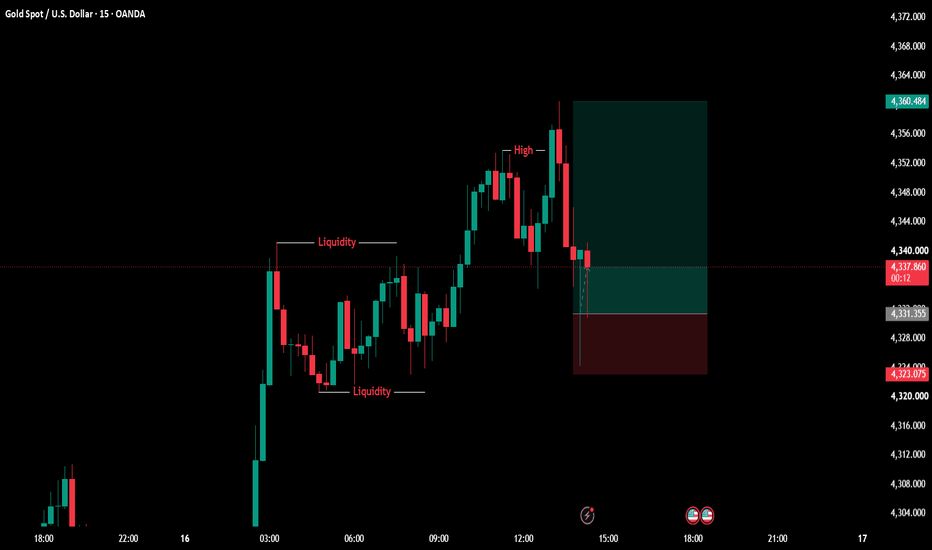
Oil consolidates above $100 as supply pressures remain
Ion Jauregui – Analyst at ActivTrades
Oil maintains a bullish structure at the European mid-session, although with some profit-taking after the strong advance of recent sessions. At 15:20 CET, LCrude is trading around $99.60 per barrel, consolidating around a zone that is once again gaining technical relevance after recovering the highs recorded in March, April and May.
The move remains supported by supply concerns. Attacks on Saudi energy infrastructure forced the interruption of the East-West Pipeline, a route capable of transporting around 4 million barrels per day to the port of Yanbu, while flows through the Strait of Hormuz remain constrained. The disruption also came after Saudi Arabia reduced some shipments to Europe.
The market has, however, started to partially price in an improvement in availability. Saudi Arabia is offering additional cargoes through Oman, while U.S. inventories increased by 7.1 million barrels last week according to API data. This explains part of today's correction, although it does not eliminate the supply risk while disruptions in the Middle East persist.
From a technical perspective, the current level is particularly relevant because the point of control is around $100, practically in the area where the contract is trading now. The recovery of the March, April and May highs has changed the structure of the daily chart and makes this area a reference for determining whether the move can extend towards new highs.
The indicators maintain a constructive reading, although the RSI stands at 67.60, close to the overbought zone, increasing the risk of short-term corrections. The MACD continues to show the average and signal line separating to the upside, with a positive and rising histogram, indicating that buying momentum continues to expand.
The behaviour of the moving averages also stands out. The 50-day moving average is approaching a recovery of its position relative to price versus the 100-day moving average, a configuration that would reinforce the bullish structure if it is ultimately confirmed. As long as the price manages to remain around $100 and the indicators maintain their momentum, the technical scenario continues to point towards a possible continuation towards previous highs.
The key for crude oil now will be its ability to turn $100 into support. Consolidation above this level would keep open the possibility of a further move higher, while a clear loss of the point of control would increase the risk of a correction before another recovery attempt.
*******************************************************************************************
The information provided does not constitute investment research. The material has not been prepared in accordance with the legal requirements designed to promote the independence of investment research and such should be considered a marketing communication.
All information has been prepared by ActivTrades ("AT"). The information does not contain a record of AT's prices, or an offer of or solicitation for a transaction in any financial instrument. No representation or warranty is given as to the accuracy or completeness of this information.
Any material provided does not have regard to the specific investment objective and financial situation of any person who may receive it. Past performance and forecasting are not a synonym of a reliable indicator of future performance. AT provides an execution-only service. Consequently, any person acting on the information provided does so at their own risk. Political risk is unpredictable. Central bank actions can vary. Platform tools do not guarantee success.
Long 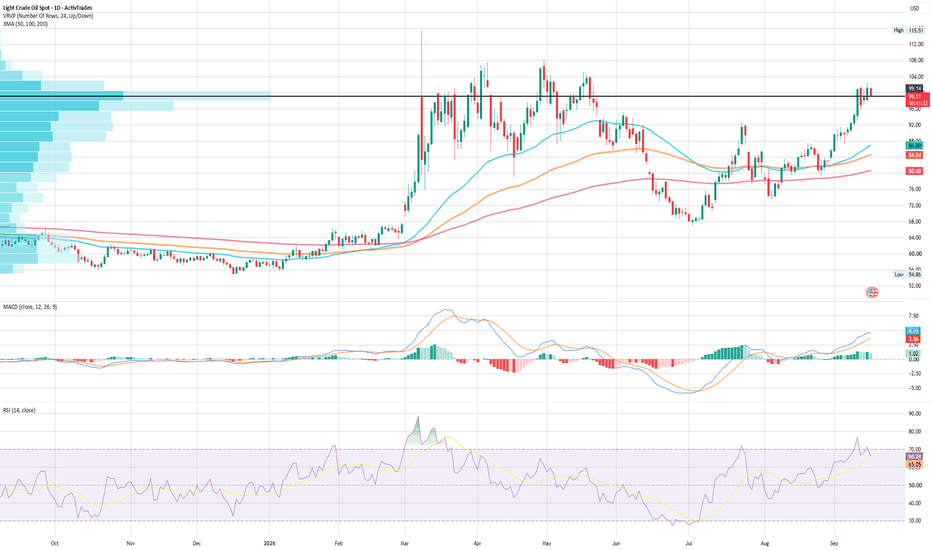
Fed Decision: Rate Hike ExpectedFed at a Crossroads: Could a Rate Hike Be the Wrong Move?
Markets have largely priced in a 25-basis-point rate hike at the Federal Reserve’s upcoming meeting. As a result, the hike itself may not be the main surprise. The real market-moving factor could be the Fed’s guidance on the path of interest rates in the months ahead.
Policymakers are facing a difficult trade-off. On one side, inflation remains above the Fed’s 2% target. On the other, there are growing signs that economic growth and the labor market may be becoming more vulnerable to restrictive monetary policy.
The Key Question: The Rate Hike or the Path Ahead?
Current economic projections put the policy rate at around 3.8%, with estimates of approximately 3.6% one year from now, 3.4% in the second year, 3.1% in the third year, and 3.1% over the longer term.
This suggests an important distinction: even if rates rise in the short term, the longer-term policy path does not necessarily have to remain upward.
That is why markets are likely to focus not only on the rate decision, but also on the FOMC statement, economic projections, Dot Plot, and press conference.
Why the Press Conference Could Matter More
If the Fed delivers a 25-basis-point hike but simultaneously signals caution about further increases, markets could interpret the decision as a dovish hike.
Under this scenario, short-term Treasury yields could come under pressure, the U.S. dollar could weaken, while gold and risk assets could find support.
On the other hand, if policymakers emphasize the need for continued monetary tightening and leave the door open to additional hikes, the dollar and Treasury yields could move higher, while gold and equities could face renewed pressure.
The key therefore may be the gap between the actual rate decision and the guidance surrounding future policy.
Economists Warn That a Hike Could Come Too Early
Several economists have also raised concerns about the risks of additional tightening.
Mark Zandi of Moody’s Analytics has warned about the increasing risk of a potential policy mistake, arguing that weakening economic growth combined with rising layoffs and unemployment could create a self-reinforcing negative cycle.
Carl Tannenbaum of Northern Trust has pointed to pressure on lower-income households, which have been drawing down savings to cope with elevated prices.
Steve Englander of Standard Chartered has also described a rate hike as potentially premature, arguing that the Fed may need more evidence from inflation and economic data before tightening further.
At the same time, other economists argue that underlying inflation may not justify aggressive tightening. Michael Strain of AEI has estimated core inflation, excluding some effects from energy prices and tariffs, at around 2.5%.
What Are Treasury Flows Telling Us?
Capital flows into U.S. Treasuries are another important factor.
Net long-term purchases of U.S. Treasury securities reached $172.7 billion in July, up from $146.3 billion previously.
Stronger demand for Treasuries can reflect investor demand for dollar-denominated fixed-income assets. However, the future direction of yields will ultimately depend on inflation, monetary policy, economic growth, and market expectations.
Three Scenarios for Markets
1. Rate Hike + Dovish Guidance
The Fed raises rates by 25 basis points but adopts a cautious tone regarding further increases.
In this scenario, markets could see lower short-term yields, a weaker dollar, and stronger demand for gold and equities.
2. Rate Hike + Hawkish Guidance
The Fed raises rates and signals that additional tightening remains possible.
This could support the dollar and Treasury yields while putting additional pressure on gold and equities.
3. No Rate Hike
If the Fed unexpectedly keeps rates unchanged, the initial market reaction could be significant as investors reassess their expectations for the monetary-policy path.
What Traders Should Watch
The Fed decision should not be reduced to a simple question of whether rates rise or stay unchanged.
Four variables may be particularly important:
1. The Dot Plot
2. Inflation and growth projections
3. The tone of the press conference
4. The simultaneous reaction in the U.S. dollar and Treasury yields
If rates rise but short-term yields fall, the dollar weakens, and the yield curve steepens, markets may be interpreting the decision as more dovish than previously expected.
Conversely, a simultaneous rise in short-term yields and the dollar could indicate a more hawkish interpretation.
Conclusion
The upcoming Fed meeting may be less about a single 25-basis-point rate hike and more about what comes next.
The Federal Reserve is attempting to balance two competing risks: inflation that has not yet been fully contained and an economy that may be becoming increasingly sensitive to restrictive interest rates.
For traders, the most important question may not be what the Fed does today, but what the market believes the Fed is telling it about tomorrow.
The reaction may therefore unfold not at the moment of the rate announcement, but during the minutes that follow the release of the Dot Plot and the press conference. Education